
User:DukeOfDelTaco/sandbox/Results of the 2020 United States presidential election
| This is not a Wikipedia article: This is a workpage, a collection of material and work in progress that may or may not be incorporated into an article. It should not necessarily be considered factual or authoritative. |
| |||||||||||||||||||||||||||||
538 members of the Electoral College 270 electoral votes needed to win | |||||||||||||||||||||||||||||
|---|---|---|---|---|---|---|---|---|---|---|---|---|---|---|---|---|---|---|---|---|---|---|---|---|---|---|---|---|---|
| |||||||||||||||||||||||||||||
| |||||||||||||||||||||||||||||


2020 U.S. presidential election | |
|---|---|
| Attempts to overturn | |
| Democratic Party | |
| Republican Party | |
| Third parties | |
| Related races | |
| |
This workpage details the results of the 2020 United States presidential election, which was the 59th quadrennial presidential election in the United States, held on November 3, 2020. Democratic nominee Joe Biden, the former vice president from Delaware, defeated incumbent Republican nominee Donald Trump from Florida. It was the first election since 1992, the first in the 21st century, and the fifth in the past 100 years in which the incumbent president lost re-election to a second term. Both major candidates received more than 74 million votes, surpassing Barack Obama's record of 69.5 million votes from 2008. Biden received more than 81 million votes, the most votes ever cast for a candidate in a U.S. presidential election.
Biden flipped five states that voted for Trump in 2016: Arizona, Georgia, Michigan, Pennsylvania, and Wisconsin, as well as Nebraska's 2nd congressional district. He was the first Democrat to win in Georgia since 1992 and in Arizona since 1996, and the first candidate to win nationally without Ohio since 1960 and without Florida since 1992. This election marked the first ever occurrence of back-to-back elections with the same electoral vote distribution between candidates (306-to-232), excluding faithless electors. Biden became the second former vice president, after Republican Richard Nixon in 1968, to be elected president without having succeeded to the office.
Overview[edit]
-
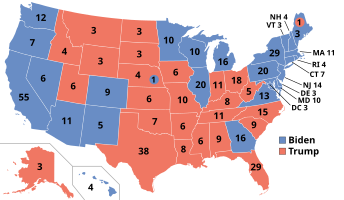
Presidential election results map. Blue denotes those won by Biden/Harris and red denotes states won by Trump/Pence. Numbers indicate electoral votes cast by each state and the District of Columbia. -
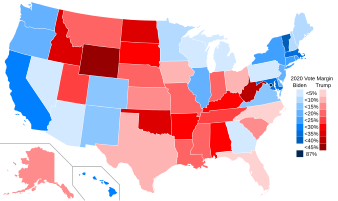 Results by state, shaded according to winning candidate's margin of victory. Biden performed the best in the District of Columbia, while Trump performed best in Wyoming. The closest state was Georgia.
 -
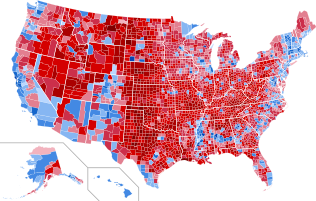 Results by county, shaded according to winning candidate's percentage of the vote.
 -
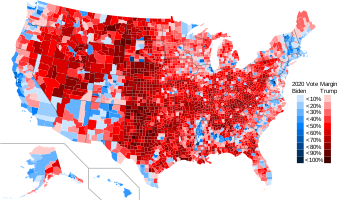
 Change in vote margins at the county level from the 2016 election to the 2020 election.
 -
 Results by state, shaded according to winning candidate's margin of victory.
 -
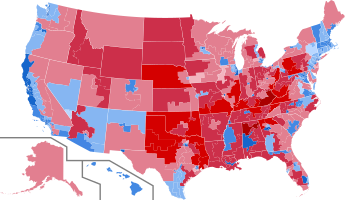 Results by congressional district, shaded according to winning candidate's percentage of the vote.


.svg)
Results[edit]
| 306 | 232 |
| Joe Biden | Donald Trump |
| Presidential candidate | Party | Home state | Popular vote | Electoral vote |
Running mate | |||
|---|---|---|---|---|---|---|---|---|
| Count | Percentage | Vice-presidential candidate | Home state | Electoral vote | ||||
| Joe Biden | Democratic[a] | Delaware | 81,268,924 | 51.31% | 306 | Kamala Harris | California | 306 |
| Donald Trump | Republican[b] | Florida | 74,216,154 | 46.86% | 232 | Mike Pence | Indiana | 232 |
| Jo Jorgensen | Libertarian | South Carolina | 1,865,724 | 1.18% | 0 | Spike Cohen | South Carolina | 0 |
| Howie Hawkins | Green[c] | New York | 405,035 | 0.26% | 0 | Angela Nicole Walker | South Carolina | 0 |
| Rocky De La Fuente | Alliance[d] | California | 88,234 | 0.06% | 0 | Darcy Richardson | Florida | 0 |
| Gloria La Riva | Socialism and Liberation[e] | California | 85,623 | 0.05% | 0 | Sunil Freeman | District of Columbia | 0 |
| Kanye West | Independent | Wyoming | 70,296 | 0.04% | 0 | Michelle Tidball | Wyoming | 0 |
| Don Blankenship | Constitution | West Virginia | 60,148 | 0.04% | 0 | William Mohr | Michigan | 0 |
| Brock Pierce | Independent[f] | Puerto Rico | 49,700 | 0.03% | 0 | Karla Ballard | Pennsylvania | 0 |
| Brian T. Carroll | American Solidarity | California | 39,230 | 0.02% | 0 | Amar Patel | Illinois | 0 |
| Other | 234,335 | 0.15% | — | Other | — | |||
| Total | 158,383,403 | 100% | 538 | 538 | ||||
| Needed to win | 270 | 270 | ||||||
Summary table[edit]
State or
district |
Joe Biden Democratic |
Donald Trump Republican |
Jo Jorgensen Libertarian |
Howie Hawkins Green |
Others | Margin | Margin swing |
Total votes | |||||||||||
|---|---|---|---|---|---|---|---|---|---|---|---|---|---|---|---|---|---|---|---|
| Votes | % | EV
|
Votes | % | EV
|
Votes | % | EV
|
Votes | % | EV
|
Votes | % | EV
|
Votes | % | % | ||
| Alabama | 849,624 | 36.57% | – | 1,441,170 | 62.03% | 9 | 25,176 | 1.08% | – | – | – | – | 7,312 | 0.31% | – | -591,546 | -25.46% | 2.26% | 2,323,282 |
| Alaska | 153,778 | 42.77% | – | 189,951 | 52.83% | 3 | 8,897 | 2.48% | – | – | – | – | 6,904 | 1.92% | – | -36,173 | -10.06% | 4.67% | 359,530 |
| Arizona | 1,672,143 | 49.36% | 11 | 1,661,686 | 49.06% | – | 51,465 | 1.52% | – | 1,557 | 0.05% | – | 478 | 0.01% | – | 10,457 | 0.31% | 3.86% | 3,387,326 |
| Arkansas | 423,932 | 34.78% | – | 760,647 | 62.40% | 6 | 13,133 | 1.08% | – | 2,980 | 0.24% | – | 18,377 | 1.51% | – | -336,715 | -27.62% | -0.70% | 1,219,069 |
| California | 11,110,250 | 63.48% | 55 | 6,006,429 | 34.32% | – | 187,895 | 1.07% | – | 81,029 | 0.46% | – | 115,278 | 0.66% | – | 5,103,821 | 29.16% | -0.95% | 17,500,881 |
| Colorado | 1,804,352 | 55.40% | 9 | 1,364,607 | 41.90% | – | 52,460 | 1.61% | – | 8,986 | 0.28% | – | 26,575 | 0.82% | – | 439,745 | 13.50% | 8.59% | 3,256,980 |
| Connecticut | 1,080,831 | 59.26% | 7 | 714,717 | 39.19% | – | 20,230 | 1.11% | – | 7,538 | 0.41% | – | 541 | 0.03% | – | 366,114 | 20.07% | 6.43% | 1,823,857 |
| Delaware | 296,268 | 58.74% | 3 | 200,603 | 39.77% | – | 5,000 | 0.99% | – | 2,139 | 0.42% | – | 336 | 0.07% | – | 95,665 | 18.97% | 7.60% | 504,346 |
| D.C. | 317,323 | 92.15% | 3 | 18,586 | 5.40% | – | 2,036 | 0.59% | – | 1,726 | 0.50% | – | 4,685 | 1.36% | – | 298,737 | 86.75% | -0.03% | 344,356 |
| Florida | 5,297,045 | 47.86% | – | 5,668,731 | 51.22% | 29 | 70,324 | 0.64% | – | 14,721 | 0.13% | – | 16,635 | 0.15% | – | -371,686 | -3.36% | -2.16% | 11,067,456 |
| Georgia | 2,473,633 | 49.47% | 16 | 2,461,854 | 49.24% | – | 62,229 | 1.24% | – | 1,013 | 0.02% | – | 1,231 | 0.03% | – | 11,779 | 0.24% | 5.37% | 4,999,960 |
| Hawaii | 366,130 | 63.73% | 4 | 196,864 | 34.27% | – | 5,539 | 0.96% | – | 3,822 | 0.67% | – | 2,114 | 0.37% | – | 169,266 | 29.46% | -2.72% | 574,469 |
| Idaho | 287,021 | 33.07% | – | 554,119 | 63.84% | 4 | 16,404 | 1.89% | – | 407 | 0.05% | – | 10,063 | 1.16% | – | -267,098 | -30.77% | 1.00% | 868,014 |
| Illinois | 3,471,915 | 57.54% | 20 | 2,446,891 | 40.55% | – | 66,544 | 1.10% | – | 30,494 | 0.51% | – | 17,900 | 0.30% | – | 1,025,024 | 16.99% | -0.07% | 6,033,744 |
| Indiana | 1,242,416 | 40.96% | – | 1,729,519 | 57.02% | 11 | 59,232 | 1.95% | – | 989 | 0.03% | – | 965 | 0.03% | – | -487,103 | -16.06% | 3.11% | 3,033,121 |
| Iowa | 759,061 | 44.89% | – | 897,672 | 53.09% | 6 | 19,637 | 1.16% | – | 3,075 | 0.18% | – | 11,426 | 0.68% | – | -138,611 | -8.20% | 1.21% | 1,690,871 |
| Kansas | 570,323 | 41.56% | – | 771,406 | 56.21% | 6 | 30,574 | 2.23% | – | – | – | – | – | – | – | -201,083 | -14.65% | 5.95% | 1,372,303 |
| Kentucky | 772,474 | 36.15% | – | 1,326,646 | 62.09% | 8 | 26,234 | 1.23% | – | 716 | 0.03% | – | 10,698 | 0.50% | – | -554,172 | -25.94% | 3.90% | 2,136,768 |
| Louisiana | 856,034 | 39.85% | – | 1,255,776 | 58.46% | 8 | 21,645 | 1.01% | – | – | – | – | 14,607 | 0.68% | – | -399,742 | -18.61% | 1.03% | 2,148,062 |
| Maine | 435,072 | 53.09% | 2 | 360,737 | 44.02% | – | 14,152 | 1.73% | – | 8,230 | 1.00% | – | 1,270 | 0.15% | – | 74,335 | 9.07% | 6.11% | 819,461 |
| ME-01 | 266,376 | 60.12% | 1 | 164,045 | 37.02% | – | 7,343 | 1.66% | – | 4,654 | 1.05% | – | 694 | 0.16% | – | 102,331 | 23.09% | 8.28% | 443,112 |
| ME-02 | 168,696 | 44.82% | – | 196,692 | 52.26% | 1 | 6,809 | 1.81% | – | 3,576 | 0.95% | – | 576 | 0.15% | – | -27,996 | -7.44% | 2.85% | 376,349 |
| Maryland | 1,985,023 | 65.36% | 10 | 976,414 | 32.15% | – | 33,488 | 1.10% | – | 15,799 | 0.52% | – | 26,306 | 0.87% | – | 1,008,609 | 33.21% | 6.79% | 3,037,030 |
| Massachusetts | 2,382,202 | 65.60% | 11 | 1,167,202 | 32.14% | – | 47,013 | 1.30% | – | 18,658 | 0.51% | – | 16,327 | 0.45% | – | 1,215,000 | 33.46% | 6.26% | 3,631,402 |
| Michigan | 2,804,040 | 50.62% | 16 | 2,649,852 | 47.84% | – | 60,381 | 1.09% | – | 13,718 | 0.25% | – | 11,311 | 0.20% | – | 154,188 | 2.78% | 3.00% | 5,539,302 |
| Minnesota | 1,717,077 | 52.40% | 10 | 1,484,065 | 45.29% | – | 34,976 | 1.07% | – | 10,033 | 0.31% | – | 31,020 | 0.95% | – | 233,012 | 7.11% | 5.59% | 3,277,171 |
| Mississippi | 539,398 | 41.06% | – | 756,764 | 57.60% | 6 | 8,026 | 0.61% | – | 1,498 | 0.11% | – | 8,073 | 0.61% | – | -217,366 | -16.55% | 1.28% | 1,313,759 |
| Missouri | 1,253,014 | 41.41% | – | 1,718,736 | 56.80% | 10 | 41,205 | 1.36% | – | 8,283 | 0.27% | – | 4,724 | 0.16% | – | -465,722 | -15.39% | 3.25% | 3,025,962 |
| Montana | 244,786 | 40.55% | – | 343,602 | 56.92% | 3 | 15,252 | 2.53% | – | – | – | – | 34 | 0.01% | – | -98,816 | -16.37% | 4.05% | 603,674 |
| Nebraska | 374,583 | 39.17% | – | 556,846 | 58.22% | 2 | 20,283 | 2.12% | – | – | – | – | 4,671 | 0.49% | – | -182,263 | -19.06% | 5.99% | 956,383 |
| NE-01 | 132,261 | 41.09% | – | 180,290 | 56.01% | 1 | 7,495 | 2.33% | – | – | – | – | 1,840 | 0.57% | – | -48,029 | -14.92% | 5.80% | 321,886 |
| NE-02 | 176,468 | 51.95% | 1 | 154,377 | 45.45% | – | 6,909 | 2.03% | – | – | – | – | 1,912 | 0.56% | – | 22,091 | 6.50% | 8.74% | 339,666 |
| NE-03 | 65,854 | 22.34% | – | 222,179 | 75.36% | 1 | 5,879 | 1.99% | – | – | – | – | 919 | 0.31% | – | -156,325 | -53.02% | 1.17% | 294,831 |
| Nevada | 703,486 | 50.06% | 6 | 669,890 | 47.67% | – | 14,783 | 1.05% | – | – | – | – | 17,217 | 1.23% | – | 33,596 | 2.39% | -0.03% | 1,405,376 |
| New Hampshire | 424,937 | 52.71% | 4 | 365,660 | 45.36% | – | 13,236 | 1.84% | – | 217 | 0.03% | – | 2,155 | 0.27% | – | 59,277 | 7.35% | 6.98% | 806,205 |
| New Jersey | 2,608,335 | 57.33% | 14 | 1,883,274 | 41.40% | – | 31,677 | 0.70% | – | 14,202 | 0.31% | – | 11,865 | 0.26% | – | 725,061 | 15.94% | 1.84% | 4,549,353 |
| New Mexico | 501,614 | 54.29% | 5 | 401,894 | 43.50% | – | 12,585 | 1.36% | – | 4,426 | 0.48% | – | 3,446 | 0.37% | – | 99,720 | 10.79% | 2.58% | 923,965 |
| New York | 5,230,985 | 60.86% | 29 | 3,244,798 | 37.75% | – | 60,234 | 0.70% | – | 32,753 | 0.38% | – | 26,056 | 0.30% | – | 1,986,187 | 23.11% | 0.62% | 8,594,826 |
| North Carolina | 2,684,292 | 48.59% | – | 2,758,775 | 49.93% | 15 | 48,678 | 0.88% | – | 12,195 | 0.22% | – | 20,684 | 0.38% | – | -74,483 | -1.35% | 2.31% | 5,524,804 |
| North Dakota | 114,902 | 31.76% | – | 235,595 | 65.11% | 3 | 9,393 | 2.60% | – | – | – | – | 1,929 | 0.53% | – | -120,693 | -33.36% | 2.37% | 361,819 |
| Ohio | 2,679,165 | 45.24% | – | 3,154,834 | 53.27% | 18 | 67,569 | 1.14% | – | 18,812 | 0.32% | – | 1,822 | 0.03% | – | -475,669 | -8.03% | 0.10% | 5,922,202 |
| Oklahoma | 503,890 | 32.29% | – | 1,020,280 | 65.37% | 7 | 24,731 | 1.58% | – | – | – | – | 11,798 | 0.76% | – | -516,390 | -33.09% | 3.30% | 1,560,699 |
| Oregon | 1,340,383 | 56.45% | 7 | 958,448 | 40.37% | – | 41,582 | 1.75% | – | 11,831 | 0.50% | – | 22,077 | 0.93% | – | 381,935 | 16.09% | 5.11% | 2,374,321 |
| Pennsylvania | 3,458,229 | 50.01% | 20 | 3,377,674 | 48.84% | – | 79,380 | 1.15% | – | – | – | – | – | – | – | 80,555 | 1.16% | 1.88% | 6,915,283 |
| Rhode Island | 307,486 | 59.39% | 4 | 199,922 | 38.61% | – | 5,053 | 0.98% | – | – | – | – | 5,296 | 1.02% | – | 107,564 | 20.77% | 5.26% | 517,757 |
| South Carolina | 1,091,541 | 43.43% | – | 1,385,103 | 55.11% | 9 | 27,916 | 1.11% | – | 6,907 | 0.28% | – | 1,862 | 0.07% | – | -293,562 | -11.68% | 2.59% | 2,513,329 |
| South Dakota | 150,471 | 35.61% | – | 261,043 | 61.77% | 3 | 11,095 | 2.62% | – | – | – | – | – | – | – | -110,572 | -26.16% | 3.63% | 422,609 |
| Tennessee | 1,143,711 | 37.45% | – | 1,852,475 | 60.66% | 11 | 29,877 | 0.98% | – | 4,545 | 0.15% | – | 23,243 | 0.76% | – | -708,764 | -23.21% | 2.80% | 3,053,851 |
| Texas | 5,259,126 | 46.48% | – | 5,890,347 | 52.06% | 38 | 126,243 | 1.12% | – | 33,396 | 0.29% | – | 5,944 | 0.05% | – | -631,221 | -5.58% | 3.42% | 11,315,056 |
| Utah | 560,282 | 37.65% | – | 865,140 | 58.13% | 6 | 38,447 | 2.58% | – | 5,053 | 0.34% | – | 19,367 | 1.30% | – | -304,858 | -20.48% | -2.40% | 1,488,289 |
| Vermont | 242,820 | 66.09% | 3 | 112,704 | 30.67% | – | 3,608 | 0.98% | – | 1,310 | 0.36% | – | 6,986 | 1.90% | – | 130,116 | 35.41% | 9.00% | 367,428 |
| Virginia | 2,413,568 | 54.11% | 13 | 1,962,430 | 44.00% | – | 64,761 | 1.45% | – | – | – | – | 19,765 | 0.44% | – | 451,138 | 10.11% | 4.79% | 4,460,524 |
| Washington | 2,369,612 | 57.97% | 12 | 1,584,651 | 38.77% | – | 80,500 | 1.97% | – | 18,289 | 0.45% | – | 34,579 | 0.85% | – | 784,961 | 19.20% | 3.49% | 4,087,631 |
| West Virginia | 235,984 | 29.69% | – | 545,382 | 68.82% | 5 | 10,687 | 1.35% | – | 2,599 | 0.33% | – | 79 | 0.01% | – | -309,398 | -38.93% | 3.14% | 794,731 |
| Wisconsin | 1,630,866 | 49.45% | 10 | 1,610,184 | 48.82% | – | 38,491 | 1.17% | – | 1,089 | 0.03% | – | 17,411 | 0.53% | – | 20,682 | 0.63% | 1.39% | 3,298,041 |
| Wyoming | 73,491 | 26.55% | – | 193,559 | 69.94% | 3 | 5,768 | 2.08% | – | – | – | – | 3,947 | 1.43% | – | -120,068 | -43.38% | 2.92% | 276,765 |
| Total | 81,268,924 | 51.31% | 306 | 74,216,154 | 46.86% | 232 | 1,865,724 | 1.18% | 0 | 405,035 | 0.26% | 0 | 627,566 | 0.40% | 0 | 7,052,770 | 4.45% | 2.35% | 158,383,403 |
| Joe Biden Democratic |
Donald Trump Republican |
Jo Jorgensen Libertarian |
Howie Hawkins Green |
Others | Margin | Margin swing |
Total votes | ||||||||||||
Close states[edit]
States where the margin of victory was under 1% (37 electoral votes):
- Georgia, 0.24% (11,779 votes) – 16 electoral votes
- Arizona, 0.31% (10,457 votes) – 11 electoral votes
- Wisconsin, 0.63% (20,682 votes) – 10 electoral votes
States where the margin of victory was under 5% (86 electoral votes):
- Pennsylvania, 1.16% (80,555 votes) – 20 electoral votes
- North Carolina, 1.35% (74,483 votes) – 15 electoral votes
- Nevada, 2.39% (33,596 votes) – 6 electoral votes
- Michigan, 2.78% (154,188 votes) – 16 electoral votes
- Florida, 3.36% (371,686 votes) – 29 electoral votes
States where the margin of victory was under 10% (76 electoral votes):
- Texas, 5.58% (631,221 votes) – 38 electoral votes
- Nebraska's 2nd congressional district, 6.50% (22,091 votes) – 1 electoral vote
- Minnesota, 7.11% (233,012 votes) – 10 electoral votes
- New Hampshire, 7.35% (59,277 votes) – 4 electoral votes
- Maine's 2nd congressional district, 7.44% (27,996 votes) – 1 electoral vote
- Ohio, 8.03% (475,669 votes) – 18 electoral votes
- Iowa, 8.20% (138,611 votes) – 6 electoral votes
- Maine, 9.07% (74,335 votes) – 2 electoral votes
County statistics[edit]
Results by state[edit]
Alabama[edit]

- Trump:
50–60%
60–70%
70–80%
80–90%
90–100% - Biden:
50–60%
60–70%
70–80%
80–90%
| Party | Candidate | Votes | % | ±% | |
|---|---|---|---|---|---|
| Republican | Donald Trump (incumbent) | 1,441,170 | 62.03% | –0.05 | |
| Democratic | Joe Biden | 849,624 | 36.57% | +2.21 | |
| Independent | Jo Jorgensen | 25,176 | 1.08% | –1.01 | |
| Write-in | 7,312 | 0.31% | |||
| Margin of victory | 591,546 | 25.46% | –2.26 | ||
| Total votes | 2,323,282 | 100.00% | |||
| Republican win | |||||
Alaska[edit]

- Trump:
40–50%
50–60%
60–70%
70–80% - Biden:
40–50%
50–60%
60–70%
70–80%
- Republican: North Slope
- Democratic: Anchorage, Prince of Wales–Hyder
| Party | Candidate | Votes | % | ±% | |
|---|---|---|---|---|---|
| Republican | Donald Trump (incumbent) | 189,951 | 52.83% | +1.55 | |
| Democratic | Joe Biden | 153,778 | 42.77% | +6.22 | |
| Libertarian | Jo Jorgensen | 8,897 | 2.48% | –3.40 | |
| Green | Jesse Ventura | 2,673 | 0.74% | –1.06 | |
| Constitution | Don Blankenship | 1,127 | 0.31% | –0.90 | |
| Independent | Brock Pierce | 825 | 0.23% | N/A | |
| Alliance | Rocky De La Fuente | 318 | 0.09% | –0.30 | |
| Write-in | 1,961 | 0.55% | |||
| Margin of victory | 36,173 | 10.06% | –4.67 | ||
| Total votes | 359,530 | 100.00% | |||
| Republican win | |||||
Arizona[edit]

- Biden:
50–60%
60–70% - Trump:
50–60%
60–70%
70–80%
- Democratic: Maricopa
| Party | Candidate | Votes | % | ±% | |
|---|---|---|---|---|---|
| Democratic | Joe Biden | 1,672,143 | 49.36% | +4.23 | |
| Republican | Donald Trump (incumbent) | 1,661,686 | 49.06% | +0.39 | |
| Libertarian | Jo Jorgensen | 51,465 | 1.52% | –2.61 | |
| Write-in | 2,032 | 0.06% | |||
| Margin of victory | 10,457 | 0.31% | –3.24 | ||
| Total votes | 3,387,326 | 100.00% | |||
| Democratic win | |||||
| Candidate | Votes | % | |
|---|---|---|---|
| Howie Hawkins | 1,557 | 0.05% | |
| Jade Simmons | 236 | 0.01% | |
| Gloria La Riva | 190 | 0.01% | |
| Scattering | 39 | 0.00% | |
| President R19 Boddie | 13 | 0.00% | |
| Total votes | 2,032 | 0.06% | |
Arkansas[edit]

- Trump:
50–60%
60–70%
70–80%
80–90% - Biden:
40–50%
50–60%
| Party | Candidate | Votes | % | ±% | |
|---|---|---|---|---|---|
| Republican | Donald Trump (incumbent) | 760,647 | 62.40% | +1.83 | |
| Democratic | Joe Biden | 423,932 | 34.78% | +1.13 | |
| Libertarian | Jo Jorgensen | 13,133 | 1.08% | –1.57 | |
| Independent | Kanye West | 4,099 | 0.34% | N/A | |
| Green | Howie Hawkins | 2,980 | 0.24% | –0.60 | |
| Independent | Phil Collins | 2,812 | 0.23% | –0.19 | |
| Independent | Brock Pierce | 2,141 | 0.18% | N/A | |
| Constitution | Don Blankenship | 2,108 | 0.17% | –0.24 | |
| American Solidarity | Brian T. Carroll | 1,713 | 0.14% | N/A | |
| Independent | Connie L. Gammon | 1,475 | 0.12% | N/A | |
| Life and Liberty | J. R. Myers | 1,372 | 0.11% | N/A | |
| Socialism and Liberation | Gloria La Riva | 1,336 | 0.11% | N/A | |
| Independent | Rocky De La Fuente | 1,321 | 0.11% | N/A | |
| Margin of victory | 336,715 | 27.62% | +0.70 | ||
| Total votes | 1,219,069 | 100.00% | |||
| Republican win | |||||
California[edit]

- Biden:
40–50%
50–60%
60–70%
70–80%
80–90% - Trump:
50–60%
60–70%
70–80%
| Party | Candidate | Votes | % | ±% | |
|---|---|---|---|---|---|
| Democratic | Joe Biden | 11,110,250 | 63.48% | +1.75 | |
| Republican | Donald Trump (incumbent) | 6,006,429 | 34.32% | +2.70 | |
| Libertarian | Jo Jorgensen | 187,895 | 1.07% | –2.30 | |
| Green | Howie Hawkins | 81,029 | 0.46% | –1.50 | |
| American Independent | Rocky De La Fuente | 60,160 | 0.34% | N/A | |
| Peace and Freedom | Gloria La Riva | 51,037 | 0.29% | –0.18 | |
| Write-in | 4,081 | 0.02% | |||
| Margin of victory | 5,103,821 | 29.16% | –0.95 | ||
| Total votes | 17,500,881 | 100.00% | |||
| Democratic win | |||||
| Candidate | Votes | % | |
|---|---|---|---|
| Brian T. Carroll | 2,605 | 0.02% | |
| Jesse Ventura | 611 | 0.00% | |
| Mark Charles | 559 | 0.00% | |
| Brock Pierce | 185 | 0.00% | |
| Joseph Kishore | 121 | 0.00% | |
| Total votes | 4,081 | 0.02% | |
Colorado[edit]

- Biden:
40–50%
50–60%
60–70%
70–80% - Trump:
40–50%
50–60%
60–70%
70–80%
80–90%
| Party | Candidate | Votes | % | ±% | |
|---|---|---|---|---|---|
| Democratic | Joe Biden | 1,804,352 | 55.40% | +7.24 | |
| Republican | Donald Trump (incumbent) | 1,364,607 | 41.90% | –1.35 | |
| Libertarian | Jo Jorgensen | 52,460 | 1.61% | –3.57 | |
| Green | Howie Hawkins | 8,986 | 0.28% | –1.10 | |
| Independent | Kanye West | 8,089 | 0.25% | N/A | |
| American Constitution | Don Blankenship | 5,061 | 0.16% | –0.26 | |
| Unity | Bill Hammons | 2,730 | 0.08% | N/A | |
| American Solidarity | Brian T. Carroll | 2,515 | 0.08% | +0.05 | |
| Independent | Mark Charles | 2,011 | 0.06% | N/A | |
| Socialism and Liberation | Gloria La Riva | 1,035 | 0.03% | +0.01 | |
| Independent American | Kyle Kopitke | 762 | 0.02% | –0.02 | |
| Alliance | Rocky De La Fuente | 636 | 0.02% | –0.03 | |
| Independent | Joe McHugh | 614 | 0.02% | N/A | |
| Independent | Brock Pierce | 572 | 0.02% | N/A | |
| Prohibition | Phil Collins | 568 | 0.02% | +0.01 | |
| Independent | Princess Khadijah Jacob-Fambro | 495 | 0.02% | N/A | |
| Progressive | Dario Hunter | 379 | 0.01% | N/A | |
| Approval Voting | Blake Huber | 355 | 0.01% | ±0.00 | |
| Socialist Workers | Alyson Kennedy | 354 | 0.01% | –0.01 | |
| Socialist Equality | Joseph Kishore | 196 | 0.01% | N/A | |
| Independent | Jordan Scott | 175 | 0.01% | N/A | |
| Write-in | 28 | 0.00% | |||
| Margin of victory | 439,745 | 13.50% | +8.59 | ||
| Total votes | 3,256,980 | 100.00% | |||
| Democratic win | |||||
| Candidate | Votes | % | |
|---|---|---|---|
| Tom Hoefling | 24 | 0.00% | |
| Scattering | 4 | 0.00% | |
| Total votes | 28 | 0.00% | |
Connecticut[edit]

- Biden:
50–60%
60–70% - Trump:
50–60%
| Party | Candidate | Votes | % | ±% | |
|---|---|---|---|---|---|
| Democratic | Joe Biden | 1,080,831 | 59.26% | +4.69 | |
| Republican | Donald Trump (incumbent) | 714,717 | 39.19% | –1.74 | |
| Libertarian | Jo Jorgensen | 20,230 | 1.11% | –1.85 | |
| Green | Howie Hawkins | 7,538 | 0.41% | –0.98 | |
| Write-in | 541 | 0.03% | |||
| Margin of victory | 366,114 | 20.07% | +6.43 | ||
| Total votes | 1,823,857 | 100.00% | |||
| Democratic win | |||||
| Candidate | Votes | % | |
|---|---|---|---|
| Kanye West | 255 | 0.01% | |
| Brian T. Carroll | 219 | 0.01% | |
| Jade Simmons | 22 | 0.00% | |
| Scattering | 21 | 0.00% | |
| Rocky De La Fuente | 13 | 0.00% | |
| Mark Charles | 11 | 0.00% | |
| Total votes | 541 | 0.03% | |
Delaware[edit]

- Biden:
50–60%
60–70% - Trump:
50–60%
- Democratic: Kent
| Party | Candidate | Votes | % | ±% | |
|---|---|---|---|---|---|
| Democratic | Joe Biden | 296,268 | 58.74% | +5.65 | |
| Republican | Donald Trump (incumbent) | 200,603 | 39.77% | –1.94 | |
| Libertarian | Jo Jorgensen | 5,000 | 0.99% | –2.34 | |
| Green | Howie Hawkins | 2,139 | 0.42% | –0.96 | |
| Write-in | 336 | 0.07% | |||
| Margin of victory | 95,665 | 18.97% | +7.60 | ||
| Total votes | 504,346 | 100.00% | |||
| Democratic win | |||||
| Candidate | Votes | % | |
|---|---|---|---|
| Kanye West | 169 | 0.03% | |
| Brian T. Carroll | 87 | 0.02% | |
| Jade Simmons | 28 | 0.01% | |
| Scattering | 21 | 0.00% | |
| Gloria La Riva | 14 | 0.00% | |
| Mark Charles | 8 | 0.00% | |
| Brock Pierce | 5 | 0.00% | |
| Princess Khadijah Jacob-Fambro | 2 | 0.00% | |
| President R19 Boddie | 1 | 0.00% | |
| Tom Hoefling | 1 | 0.00% | |
| Total votes | 336 | 0.07% | |
District of Columbia[edit]

- Biden:
80–90%
90–100%
| Party | Candidate | Votes | % | ±% | |
|---|---|---|---|---|---|
| Democratic | Joe Biden | 317,323 | 92.15% | +1.29 | |
| Republican | Donald Trump (incumbent) | 18,586 | 5.40% | +1.31 | |
| Libertarian | Jo Jorgensen | 2,036 | 0.59% | –0.99 | |
| DC Statehood Green | Howie Hawkins | 1,726 | 0.50% | –0.87 | |
| Independent | Gloria La Riva | 855 | 0.25% | N/A | |
| Independent | Brock Pierce | 693 | 0.20% | N/A | |
| Write-in | 3,137 | 0.91% | |||
| Margin of victory | 298,737 | 86.75% | –0.03 | ||
| Total votes | 344,356 | 100.00% | |||
| Democratic win | |||||
Florida[edit]

- Trump:
50–60%
60–70%
70–80%
80–90% - Biden:
40–50%
50–60%
60–70%
| Party | Candidate | Votes | % | ±% | |
|---|---|---|---|---|---|
| Republican | Donald Trump (incumbent) | 5,668,731 | 51.22% | +2.20 | |
| Democratic | Joe Biden | 5,297,045 | 47.86% | +0.04 | |
| Libertarian | Jo Jorgensen | 70,324 | 0.64% | –1.56 | |
| Green | Howie Hawkins | 14,721 | 0.13% | –0.55 | |
| Reform | Rocky De La Fuente | 5,966 | 0.05% | –0.05 | |
| Socialism and Liberation | Gloria La Riva | 5,712 | 0.05% | N/A | |
| Constitution | Don Blankenship | 3,902 | 0.04% | –0.13 | |
| Write-in | 1,055 | 0.01% | |||
| Margin of victory | 371,686 | 3.36% | +2.16 | ||
| Total votes | 11,067,456 | 100.00% | |||
| Republican win | |||||
| Candidate | Votes | % | |
|---|---|---|---|
| Brian T. Carroll | 854 | 0.01% | |
| Jade Simmons | 181 | 0.00% | |
| Scattering | 20 | 0.00% | |
| Total votes | 1,055 | 0.01% | |
Georgia[edit]

- Biden:
50–60%
60–70%
70–80%
80–90% - Trump:
50–60%
60–70%
70–80%
80–90%
90–100%
- Republican: Burke
| Party | Candidate | Votes | % | ±% | |
|---|---|---|---|---|---|
| Democratic | Joe Biden | 2,473,633 | 49.47% | +3.83 | |
| Republican | Donald Trump (incumbent) | 2,461,854 | 49.24% | –1.53 | |
| Libertarian | Jo Jorgensen | 62,229 | 1.24% | –1.81 | |
| Write-in | 2,244 | 0.05% | |||
| Margin of victory | 11,779 | 0.24% | –4.89 | ||
| Total votes | 4,999,960 | 100.00% | |||
| Democratic win | |||||
| Candidate | Votes | % | |
|---|---|---|---|
| Howie Hawkins | 1,013 | 0.02% | |
| Brian T. Carroll | 701 | 0.01% | |
| Jade Simmons | 181 | 0.00% | |
| Gloria La Riva | 159 | 0.00% | |
| Mark Charles | 65 | 0.00% | |
| Don Blankenship | 61 | 0.00% | |
| Scattering | 49 | 0.00% | |
| President R19 Boddie | 8 | 0.00% | |
| Princess Khadijah Jacob-Fambro | 7 | 0.00% | |
| Total votes | 2,244 | 0.05% | |
Hawaii[edit]

- Biden:
60–70%
90–100%
| Party | Candidate | Votes | % | ±% | |
|---|---|---|---|---|---|
| Democratic | Joe Biden | 366,130 | 63.73% | +1.51 | |
| Republican | Donald Trump (incumbent) | 196,864 | 34.27% | +4.23 | |
| Libertarian | Jo Jorgensen | 5,539 | 0.96% | –2.76 | |
| Green | Howie Hawkins | 3,822 | 0.67% | –2.30 | |
| American Shopping | Brock Pierce | 1,183 | 0.21% | N/A | |
| Constitution | Don Blankenship | 931 | 0.16% | –0.89 | |
| Margin of victory | 169,266 | 29.46% | –2.72 | ||
| Total votes | 574,469 | 100.00% | |||
| Democratic win | |||||
Idaho[edit]

- Trump:
50–60%
60–70%
70–80%
80–90% - Biden:
40–50%
50–60%
60–70%
- Democratic: Teton
| Party | Candidate | Votes | % | ±% | |
|---|---|---|---|---|---|
| Republican | Donald Trump (incumbent) | 554,119 | 63.84% | +4.58 | |
| Democratic | Joe Biden | 287,021 | 33.07% | +5.58 | |
| Libertarian | Jo Jorgensen | 16,404 | 1.89% | –2.21 | |
| Independent | Kanye West | 3,632 | 0.42% | N/A | |
| Independent | Brock Pierce | 2,808 | 0.32% | N/A | |
| Constitution | Don Blankenship | 1,886 | 0.22% | –0.12 | |
| Independent | Rocky De La Fuente | 1,491 | 0.17% | –0.03 | |
| Write-in | 653 | 0.08% | |||
| Margin of victory | 267,098 | 30.77% | –1.00 | ||
| Total votes | 868,014 | 100.00% | |||
| Republican win | |||||
| Candidate | Votes | % | |
|---|---|---|---|
| Howie Hawkins | 407 | 0.05% | |
| Brian T. Carroll | 163 | 0.02% | |
| Gloria La Riva | 49 | 0.01% | |
| Jade Simmons | 21 | 0.00% | |
| Tom Hoefling | 7 | 0.00% | |
| Scattering | 6 | 0.00% | |
| Total votes | 653 | 0.08% | |
Illinois[edit]

- Biden:
40–50%
50–60%
60–70%
70–80% - Trump:
40–50%
50–60%
60–70%
70–80%
80–90%
| Party | Candidate | Votes | % | ±% | |
|---|---|---|---|---|---|
| Democratic | Joe Biden | 3,471,915 | 57.54% | +1.71 | |
| Republican | Donald Trump (incumbent) | 2,446,891 | 40.55% | +1.79 | |
| Libertarian | Jo Jorgensen | 66,544 | 1.10% | –2.69 | |
| Green | Howie Hawkins | 30,494 | 0.51% | –0.88 | |
| American Solidarity | Brian T. Carroll | 9,548 | 0.16% | N/A | |
| Socialism and Liberation | Gloria La Riva | 8,046 | 0.13% | N/A | |
| Write-in | 306 | 0.01% | |||
| Margin of victory | 1,025,024 | 16.99% | –0.07 | ||
| Total votes | 6,033,744 | 100.00% | |||
| Democratic win | |||||
| Candidate | Votes | % | |
|---|---|---|---|
| Scattering | 127 | 0.00% | |
| Jade Simmons | 78 | 0.00% | |
| Mark Charles | 75 | 0.00% | |
| Don Blankenship | 18 | 0.00% | |
| Joseph Kishore | 5 | 0.00% | |
| Phil Collins | 3 | 0.00% | |
| Total votes | 306 | 0.01% | |
Indiana[edit]

- Trump:
50–60%
60–70%
70–80%
80–90% - Biden:
40–50%
50–60%
60–70%
- Democratic: Tippecanoe
| Party | Candidate | Votes | % | ±% | |
|---|---|---|---|---|---|
| Republican | Donald Trump (incumbent) | 1,729,519 | 57.02% | +0.08 | |
| Democratic | Joe Biden | 1,242,416 | 40.96% | +3.19 | |
| Libertarian | Jo Jorgensen | 59,232 | 1.95% | –2.95 | |
| Write-in | 1,954 | 0.06% | |||
| Margin of victory | 487,103 | 16.06% | –3.11 | ||
| Total votes | 3,033,121 | 100.00% | |||
| Republican win | |||||
| Candidate | Votes | % | |
|---|---|---|---|
| Howie Hawkins | 989 | 0.03% | |
| Brian T. Carroll | 895 | 0.03% | |
| Scattering | 70 | 0.00% | |
| Total votes | 1,954 | 0.06% | |
Iowa[edit]

- Trump:
40–50%
50–60%
60–70%
70–80%
80–90% - Biden:
50–60%
70–80%
| Party | Candidate | Votes | % | ±% | |
|---|---|---|---|---|---|
| Republican | Donald Trump (incumbent) | 897,672 | 53.09% | +1.94 | |
| Democratic | Joe Biden | 759,061 | 44.89% | +3.15 | |
| Libertarian | Jo Jorgensen | 19,637 | 1.16% | –2.62 | |
| Independent | Kanye West | 3,210 | 0.19% | N/A | |
| Green | Howie Hawkins | 3,075 | 0.18% | –0.55 | |
| Constitution | Don Blankenship | 1,707 | 0.10% | –0.24 | |
| Alliance | Rocky De La Fuente | 1,082 | 0.06% | +0.03 | |
| Genealogy Know Your Family History | Ricki Sue King | 546 | 0.03% | N/A | |
| Independent | Brock Pierce | 544 | 0.03% | N/A | |
| Write-in | 4,337 | 0.26% | |||
| Margin of victory | 138,611 | 8.20% | –1.21 | ||
| Total votes | 1,690,871 | 100.00% | |||
| Republican win | |||||
Kansas[edit]

- Trump:
50–60%
60–70%
70–80%
80–90%
90–100% - Biden:
50–60%
60–70%
| Party | Candidate | Votes | % | ±% | |
|---|---|---|---|---|---|
| Republican | Donald Trump (incumbent) | 771,406 | 56.21% | –0.44 | |
| Democratic | Joe Biden | 570,323 | 41.56% | +5.51 | |
| Libertarian | Jo Jorgensen | 30,574 | 2.23% | –2.45 | |
| Margin of victory | 201,083 | 14.65% | –5.95 | ||
| Total votes | 1,372,303 | 100.00% | |||
| Republican win | |||||
Kentucky[edit]

- Trump:
40–50%
50–60%
60–70%
70–80%
80–90% - Biden:
50–60%
| Party | Candidate | Votes | % | ±% | |
|---|---|---|---|---|---|
| Republican | Donald Trump (incumbent) | 1,326,646 | 62.09% | –0.43 | |
| Democratic | Joe Biden | 772,474 | 36.15% | +3.47 | |
| Libertarian | Jo Jorgensen | 26,234 | 1.23% | –1.56 | |
| Independent | Kanye West | 6,483 | 0.30% | N/A | |
| Independent | Brock Pierce | 3,599 | 0.17% | N/A | |
| Write-in | 1,332 | 0.06% | |||
| Margin of victory | 554,172 | 25.94% | –3.90 | ||
| Total votes | 2,136,768 | 100.00% | |||
| Republican win | |||||
| Candidate | Votes | % | |
|---|---|---|---|
| Howie Hawkins | 716 | 0.03% | |
| Brian T. Carroll | 408 | 0.02% | |
| Gloria La Riva | 98 | 0.00% | |
| Mark Charles | 43 | 0.00% | |
| Jade Simmons | 29 | 0.00% | |
| Tom Hoefling | 20 | 0.00% | |
| Scattering | 11 | 0.00% | |
| President R19 Boddie | 7 | 0.00% | |
| Total votes | 1,332 | 0.06% | |
Louisiana[edit]

- Trump:
50–60%
60–70%
70–80%
80–90%
90–100% - Biden:
50–60%
60–70%
80–90%
| Party | Candidate | Votes | % | ±% | |
|---|---|---|---|---|---|
| Republican | Donald Trump (incumbent) | 1,255,776 | 58.46% | +0.37 | |
| Democratic | Joe Biden | 856,034 | 39.85% | +1.40 | |
| Libertarian | Jo Jorgensen | 21,645 | 1.01% | –0.86 | |
| Birthday | Kanye West | 4,897 | 0.23% | N/A | |
| American Solidarity | Brian T. Carroll | 2,497 | 0.12% | N/A | |
| Becoming One Nation | Jade Simmons | 1,626 | 0.08% | N/A | |
| C.U.P. | President R19 Boddie | 1,125 | 0.05% | N/A | |
| Socialism and Liberation | Gloria La Riva | 987 | 0.05% | +0.03 | |
| Constitution | Don Blankenship | 860 | 0.04% | –0.11 | |
| Freedom and Prosperity | Brock Pierce | 749 | 0.04% | N/A | |
| Life, Liberty, Constitution | Tom Hoefling | 668 | 0.03% | –0.05 | |
| Unity | Bill Hammons | 662 | 0.03% | N/A | |
| Socialist Workers | Alyson Kennedy | 536 | 0.03% | +0.01 | |
| Margin of victory | 399,742 | 18.61% | –1.03 | ||
| Total votes | 2,148,062 | 100.00% | |||
| Republican win | |||||
Maine[edit]

- Biden:
40–50%
50–60%
60–70% - Trump:
40–50%
50–60%
60–70%
- Democratic: Kennebec
| Party | Candidate | Votes | % | ±% | |
|---|---|---|---|---|---|
| Democratic | Joe Biden | 435,072 | 53.09% | +5.26 | |
| Republican | Donald Trump (incumbent) | 360,737 | 44.02% | –0.85 | |
| Libertarian | Jo Jorgensen | 14,152 | 1.73% | –3.36 | |
| Green | Howie Hawkins | 8,230 | 1.00% | –0.91 | |
| Alliance | Rocky De La Fuente | 1,183 | 0.14% | N/A | |
| Write-in | 87 | 0.01% | |||
| Margin of victory | 74,335 | 9.07% | +6.11 | ||
| Total votes | 819,461 | 100.00% | |||
| Democratic win | |||||
1st congressional district[edit]

- Biden:
60–70% - Trump:
50–60%
| Party | Candidate | Votes | % | ±% | |
|---|---|---|---|---|---|
| Democratic | Joe Biden | 266,376 | 60.12% | +6.15 | |
| Republican | Donald Trump (incumbent) | 164,045 | 37.02% | –2.13 | |
| Libertarian | Jo Jorgensen | 7,343 | 1.66% | –3.05 | |
| Green | Howie Hawkins | 4,654 | 1.05% | –0.87 | |
| Alliance | Rocky De La Fuente | 649 | 0.15% | N/A | |
| Write-in | 45 | 0.01% | |||
| Margin of victory | 102,331 | 23.09% | +8.28 | ||
| Total votes | 443,112 | 100.00% | |||
| Democratic win | |||||
2nd congressional district[edit]
| Party | Candidate | Votes | % | ±% | |
|---|---|---|---|---|---|
| Republican | Donald Trump (incumbent) | 196,692 | 52.26% | +1.00 | |
| Democratic | Joe Biden | 168,696 | 44.82% | +3.84 | |
| Libertarian | Jo Jorgensen | 6,809 | 1.81% | –3.71 | |
| Green | Howie Hawkins | 3,576 | 0.95% | –0.94 | |
| Alliance | Rocky De La Fuente | 534 | 0.14% | N/A | |
| Write-in | 42 | 0.01% | |||
| Margin of victory | 27,996 | 7.44% | –2.85 | ||
| Total votes | 376,349 | 100.00% | |||
| Republican win | |||||
Maryland[edit]

- Biden:
40–50%
50–60%
60–70%
70–80%
80–90% - Trump:
40–50%
50–60%
60–70%
70–80%
| Party | Candidate | Votes | % | ±% | |
|---|---|---|---|---|---|
| Democratic | Joe Biden | 1,985,023 | 65.36% | +5.03 | |
| Republican | Donald Trump (incumbent) | 976,414 | 32.15% | –1.76 | |
| Libertarian | Jo Jorgensen | 33,488 | 1.10% | –1.76 | |
| Green | Howie Hawkins | 15,799 | 0.52% | –0.77 | |
| Bread and Roses | Jerome Segal | 5,884 | 0.19% | N/A | |
| Write-in | 20,422 | 0.67% | |||
| Margin of victory | 1,008,609 | 33.21% | +6.79 | ||
| Total votes | 3,037,030 | 100.00% | |||
| Democratic win | |||||
| Candidate | Votes | % | |
|---|---|---|---|
| Scattering | 18,157 | 0.60% | |
| Kanye West | 1,117 | 0.04% | |
| Brian T. Carroll | 795 | 0.03% | |
| Jade Simmons | 131 | 0.00% | |
| Gloria La Riva | 125 | 0.00% | |
| Mark Charles | 30 | 0.00% | |
| Rocky De La Fuente | 26 | 0.00% | |
| Brock Pierce | 16 | 0.00% | |
| Tom Hoefling | 11 | 0.00% | |
| Phil Collins | 10 | 0.00% | |
| President R19 Boddie | 4 | 0.00% | |
| Total votes | 20,422 | 0.67% | |
Massachusetts[edit]

- Biden:
50–60%
60–70%
70–80%
80–90%
| Party | Candidate | Votes | % | ±% | |
|---|---|---|---|---|---|
| Democratic | Joe Biden | 2,382,202 | 65.60% | +5.59 | |
| Republican | Donald Trump (incumbent) | 1,167,202 | 32.14% | –0.67 | |
| Libertarian | Jo Jorgensen | 47,013 | 1.30% | –2.85 | |
| Green-Rainbow | Howie Hawkins | 18,658 | 0.51% | –0.92 | |
| Write-in | 16,327 | 0.45% | |||
| Margin of victory | 1,215,000 | 33.46% | +6.26 | ||
| Total votes | 3,631,402 | 100.00% | |||
| Democratic win | |||||
Michigan[edit]

- Biden:
40–50%
50–60%
60–70%
70–80% - Trump:
40–50%
50–60%
60–70%
70–80%
| Party | Candidate | Votes | % | ±% | |
|---|---|---|---|---|---|
| Democratic | Joe Biden | 2,804,040 | 50.62% | +3.35 | |
| Republican | Donald Trump (incumbent) | 2,649,852 | 47.84% | +0.34 | |
| Libertarian | Jo Jorgensen | 60,381 | 1.09% | –2.50 | |
| Green | Howie Hawkins | 13,718 | 0.25% | –0.82 | |
| Constitution | Don Blankenship | 7,235 | 0.13% | –0.21 | |
| Natural Law | Rocky De La Fuente | 2,986 | 0.05% | ±0.00 | |
| Write-in | 1,090 | 0.02% | |||
| Margin of victory | 154,188 | 2.78% | +2.56 | ||
| Total votes | 5,539,302 | 100.00% | |||
| Democratic win | |||||
| Candidate | Votes | % | |
|---|---|---|---|
| Brian T. Carroll | 963 | 0.02% | |
| Jade Simmons | 89 | 0.00% | |
| Tom Hoefling | 32 | 0.00% | |
| Scattering | 6 | 0.00% | |
| Total votes | 1,090 | 0.02% | |
Minnesota[edit]

- Biden:
40–50%
50–60%
60–70%
70–80% - Trump:
40–50%
50–60%
60–70%
70–80%
- Democratic: Blue Earth, Clay, Nicollet, Winona
| Party | Candidate | Votes | % | ±% | |
|---|---|---|---|---|---|
| Democratic (DFL) | Joe Biden | 1,717,077 | 52.40% | +5.96 | |
| Republican | Donald Trump (incumbent) | 1,484,065 | 45.29% | +0.37 | |
| Libertarian | Jo Jorgensen | 34,976 | 1.07% | –2.77 | |
| Green | Howie Hawkins | 10,033 | 0.31% | –0.95 | |
| Independent | Kanye West | 7,940 | 0.24% | N/A | |
| Independent | Brock Pierce | 5,651 | 0.17% | N/A | |
| Independence | Rocky De La Fuente | 5,611 | 0.17% | +0.12 | |
| Socialism and Liberation | Gloria La Riva | 1,210 | 0.04% | +0.04 | |
| Socialist Workers | Alyson Kennedy | 643 | 0.02% | –0.04 | |
| Write-in | 9,965 | 0.30% | |||
| Margin of victory | 233,012 | 7.11% | +5.59 | ||
| Total votes | 3,277,171 | 100.00% | |||
| Democratic (DFL) win | |||||
| Candidate | Votes | % | |
|---|---|---|---|
| Scattering | 8,728 | 0.27% | |
| Brian T. Carroll | 1,037 | 0.03% | |
| Mark Charles | 112 | 0.00% | |
| Don Blankenship | 75 | 0.00% | |
| Tom Hoefling | 12 | 0.00% | |
| Dario Hunter | 1 | 0.00% | |
| Total votes | 9,965 | 0.30% | |
Mississippi[edit]

- Trump:
50–60%
60–70%
70–80%
80–90% - Biden:
40–50%
50–60%
60–70%
70–80%
80–90%
- Democratic: Warren
| Party | Candidate | Votes | % | ±% | |
|---|---|---|---|---|---|
| Republican | Donald Trump (incumbent) | 756,764 | 57.60% | –0.34 | |
| Democratic | Joe Biden | 539,398 | 41.06% | +0.95 | |
| Libertarian | Jo Jorgensen | 8,026 | 0.61% | –0.58 | |
| Independent | Kanye West | 3,657 | 0.28% | N/A | |
| Green | Howie Hawkins | 1,498 | 0.11% | –0.20 | |
| Independent | Phil Collins | 1,317 | 0.10% | +0.04 | |
| Constitution | Don Blankenship | 1,279 | 0.10% | –0.23 | |
| American Solidarity | Brian T. Carroll | 1,161 | 0.09% | N/A | |
| Independent | Brock Pierce | 659 | 0.05% | N/A | |
| Margin of victory | 217,366 | 16.55% | –1.28 | ||
| Total votes | 1,313,759 | 100.00% | |||
| Republican win | |||||
Missouri[edit]

- Trump:
50–60%
60–70%
70–80%
80–90% - Biden:
50–60%
60–70%
80–90%
| Party | Candidate | Votes | % | ±% | |
|---|---|---|---|---|---|
| Republican | Donald Trump (incumbent) | 1,718,736 | 56.80% | +0.03 | |
| Democratic | Joe Biden | 1,253,014 | 41.41% | +3.27 | |
| Libertarian | Jo Jorgensen | 41,205 | 1.36% | –2.11 | |
| Green | Howie Hawkins | 8,283 | 0.27% | –0.64 | |
| Constitution | Don Blankenship | 3,919 | 0.13% | –0.34 | |
| Write-in | 805 | 0.03% | |||
| Margin of victory | 465,722 | 15.39% | –3.25 | ||
| Total votes | 3,025,962 | 100.00% | |||
| Republican win | |||||
| Candidate | Votes | % | |
|---|---|---|---|
| Brian T. Carroll | 664 | 0.02% | |
| Jade Simmons | 74 | 0.00% | |
| Gloria La Riva | 64 | 0.00% | |
| Scattering | 3 | 0.00% | |
| Total votes | 805 | 0.03% | |
Montana[edit]

- Trump:
40–50%
50–60%
60–70%
70–80%
80–90%
90–100% - Biden:
50–60%
60–70%
- Democratic: Blaine
| Party | Candidate | Votes | % | ±% | |
|---|---|---|---|---|---|
| Republican | Donald Trump (incumbent) | 343,602 | 56.92% | +0.75 | |
| Democratic | Joe Biden | 244,786 | 40.55% | +4.80 | |
| Libertarian | Jo Jorgensen | 15,252 | 2.53% | –3.11 | |
| Write-in | 34 | 0.01% | |||
| Margin of victory | 98,816 | 16.37% | –4.05 | ||
| Total votes | 603,674 | 100.00% | |||
| Republican win | |||||
| Candidate | Votes | % | |
|---|---|---|---|
| Mark Charles | 23 | 0.00% | |
| Jade Simmons | 6 | 0.00% | |
| Tom Hoefling | 3 | 0.00% | |
| Scattering | 2 | 0.00% | |
| Total votes | 34 | 0.01% | |
Nebraska[edit]

- Trump:
40–50%
50–60%
60–70%
70–80%
80–90%
90–100% - Biden:
50–60%
| Party | Candidate | Votes | % | ±% | |
|---|---|---|---|---|---|
| Republican | Donald Trump (incumbent) | 556,846 | 58.22% | –0.53 | |
| Democratic | Joe Biden | 374,583 | 39.17% | +5.47 | |
| Libertarian | Jo Jorgensen | 20,283 | 2.12% | –2.49 | |
| Write-in | 4,671 | 0.49% | |||
| Margin of victory | 182,263 | 19.06% | –5.99 | ||
| Total votes | 956,383 | 100.00% | |||
| Republican win | |||||
1st congressional district[edit]

- Trump:
50–60%
70–80% - Biden:
50–60%
| Party | Candidate | Votes | % | ±% | |
|---|---|---|---|---|---|
| Republican | Donald Trump (incumbent) | 180,290 | 56.01% | –0.17 | |
| Democratic | Joe Biden | 132,261 | 41.09% | +5.63 | |
| Libertarian | Jo Jorgensen | 7,495 | 2.33% | –2.64 | |
| Write-in | 1,840 | 0.57% | |||
| Margin of victory | 48,029 | 14.92% | –5.80 | ||
| Total votes | 321,886 | 100.00% | |||
| Republican win | |||||
2nd congressional district[edit]
| Party | Candidate | Votes | % | ±% | |
|---|---|---|---|---|---|
| Democratic | Joe Biden | 176,468 | 51.95% | +7.03 | |
| Republican | Donald Trump (incumbent) | 154,377 | 45.45% | –1.71 | |
| Libertarian | Jo Jorgensen | 6,909 | 2.03% | –2.51 | |
| Write-in | 1,912 | 0.56% | |||
| Margin of victory | 22,091 | 6.50% | +4.26 | ||
| Total votes | 339,666 | 100.00% | |||
| Democratic win | |||||
3rd congressional district[edit]
| Party | Candidate | Votes | % | ±% | |
|---|---|---|---|---|---|
| Republican | Donald Trump (incumbent) | 222,179 | 75.36% | +1.44 | |
| Democratic | Joe Biden | 65,854 | 22.34% | +2.61 | |
| Libertarian | Jo Jorgensen | 5,879 | 1.99% | –2.33 | |
| Write-in | 919 | 0.31% | |||
| Margin of victory | 156,325 | 53.02% | –1.17 | ||
| Total votes | 294,831 | 100.00% | |||
| Republican win | |||||
Nevada[edit]

- Biden:
50–60% - Trump:
50–60%
60–70%
70–80%
80–90%
| Party | Candidate | Votes | % | ±% | |
|---|---|---|---|---|---|
| Democratic | Joe Biden | 703,486 | 50.06% | +2.14 | |
| Republican | Donald Trump (incumbent) | 669,890 | 47.67% | +2.17 | |
| Libertarian | Jo Jorgensen | 14,783 | 1.05% | –2.27 | |
| None of These Candidates | 14,079 | 1.00% | –1.56 | ||
| Independent American | Don Blankenship | 3,138 | 0.22% | –0.25 | |
| Margin of victory | 33,596 | 2.39% | –0.03 | ||
| Total votes | 1,405,376 | 100.00% | |||
| Democratic win | |||||
New Hampshire[edit]

- Biden:
50–60%
60–70%
70–80% - Trump:
50–60%
- Democratic: Carroll, Hillsborough, Rockingham, Sullivan
| Party | Candidate | Votes | % | ±% | |
|---|---|---|---|---|---|
| Democratic | Joe Biden | 424,937 | 52.71% | +5.88 | |
| Republican | Donald Trump (incumbent) | 365,660 | 45.36% | –1.10 | |
| Libertarian | Jo Jorgensen | 13,236 | 1.64% | –2.50 | |
| Write-in | 2,372 | 0.29% | |||
| Margin of victory | 59,277 | 7.35% | +6.98 | ||
| Total votes | 806,205 | 100.00% | |||
| Democratic win | |||||
| Candidate | Votes | % | |
|---|---|---|---|
| Scattering | 2,073 | 0.26% | |
| Howie Hawkins | 217 | 0.03% | |
| Kanye West | 82 | 0.01% | |
| Total votes | 2,372 | 0.29% | |
New Jersey[edit]

- Biden:
40–50%
50–60%
60–70%
70–80% - Trump:
50–60%
60–70%
- Democratic: Gloucester, Morris
| Party | Candidate | Votes | % | ±% | |
|---|---|---|---|---|---|
| Democratic | Joe Biden | 2,608,335 | 57.33% | +1.88 | |
| Republican | Donald Trump (incumbent) | 1,883,274 | 41.40% | +0.05 | |
| Libertarian | Jo Jorgensen | 31,677 | 0.70% | –1.17 | |
| Green | Howie Hawkins | 14,202 | 0.31% | –0.67 | |
| Unity | Bill Hammons | 3,255 | 0.07% | N/A | |
| Constitution | Don Blankenship | 2,954 | 0.06% | –0.10 | |
| Socialism and Liberation | Gloria La Riva | 2,928 | 0.06% | +0.02 | |
| Alliance | Rocky De La Fuente | 2,728 | 0.06% | +0.01 | |
| Margin of victory | 725,061 | 15.94% | +1.84 | ||
| Total votes | 4,549,353 | 100.00% | |||
| Democratic win | |||||
New Mexico[edit]

- Biden:
50–60%
60–70%
70–80% - Trump:
50–60%
60–70%
70–80%
| Party | Candidate | Votes | % | ±% | |
|---|---|---|---|---|---|
| Democratic | Joe Biden | 501,614 | 54.29% | +6.03 | |
| Republican | Donald Trump (incumbent) | 401,894 | 43.50% | +3.46 | |
| Libertarian | Jo Jorgensen | 12,585 | 1.36% | –7.98 | |
| Green | Howie Hawkins | 4,426 | 0.48% | –0.76 | |
| Constitution | Sheila Tittle | 1,806 | 0.20% | +0.01 | |
| Socialism and Liberation | Gloria La Riva | 1,640 | 0.18% | +0.03 | |
| Margin of victory | 99,720 | 10.79% | +2.58 | ||
| Total votes | 923,965 | 100.00% | |||
| Democratic win | |||||
New York[edit]

- Biden:
50–60%
60–70%
70–80%
80–90% - Trump:
40–50%
50–60%
60–70%
70–80%
- Democratic: Broome, Essex, Rensselaer, Saratoga
| Party | Candidate | Votes | % | ±% | |
|---|---|---|---|---|---|
| Democratic | Joe Biden | 5,230,985 | 60.86% | +1.85 | |
| Republican | Donald Trump (incumbent) | 3,244,798 | 37.75% | +1.23 | |
| Libertarian | Jo Jorgensen | 60,234 | 0.70% | –1.59 | |
| Green | Howie Hawkins | 32,753 | 0.38% | –1.02 | |
| Independence | Brock Pierce | 22,587 | 0.26% | –1.28 | |
| Write-in | 3,469 | 0.04% | |||
| Margin of victory | 1,986,187 | 23.11% | +0.62 | ||
| Total votes | 8,594,826 | 100.00% | |||
| Democratic win | |||||
| Candidate | Votes | % | |
|---|---|---|---|
| Kanye West | 1,897 | 0.02% | |
| Brian T. Carroll | 805 | 0.01% | |
| Gloria La Riva | 376 | 0.00% | |
| Jade Simmons | 155 | 0.00% | |
| Mark Charles | 98 | 0.00% | |
| Don Blankenship | 43 | 0.00% | |
| Scattering | 30 | 0.00% | |
| Joseph Kishore | 28 | 0.00% | |
| Rocky De La Fuente | 20 | 0.00% | |
| Phil Collins | 9 | 0.00% | |
| Dario Hunter | 8 | 0.00% | |
| Total votes | 3,469 | 0.04% | |
North Carolina[edit]

- Trump:
50–60%
60–70%
70–80% - Biden:
40–50%
50–60%
60–70%
70–80%
80–90%
- Democratic: Nash, New Hanover
- Republican: Scotland
| Party | Candidate | Votes | % | ±% | |
|---|---|---|---|---|---|
| Republican | Donald Trump (incumbent) | 2,758,775 | 49.93% | +0.10 | |
| Democratic | Joe Biden | 2,684,292 | 48.59% | +2.42 | |
| Libertarian | Jo Jorgensen | 48,678 | 0.88% | –1.86 | |
| Green | Howie Hawkins | 12,195 | 0.22% | –0.04 | |
| Constitution | Don Blankenship | 7,549 | 0.14% | N/A | |
| Write-in | 13,315 | 0.24% | |||
| Margin of victory | 74,483 | 1.35% | –2.31 | ||
| Total votes | 5,524,804 | 100.00% | |||
| Republican win | |||||
| Candidate | Votes | % | |
|---|---|---|---|
| Scattering | 13,196 | 0.24% | |
| Jade Simmons | 119 | 0.00% | |
| Total votes | 13,315 | 0.24% | |
North Dakota[edit]

- Trump:
40–50%
50–60%
60–70%
70–80%
80–90% - Biden:
60–70%
| Party | Candidate | Votes | % | ±% | |
|---|---|---|---|---|---|
| Republican | Donald Trump (incumbent) | 235,595 | 65.11% | +2.15 | |
| Democratic–NPL | Joe Biden | 114,902 | 31.76% | +4.53 | |
| Libertarian | Jo Jorgensen | 9,393 | 2.60% | –3.62 | |
| Write-in | 1,929 | 0.53% | |||
| Margin of victory | 120,693 | 33.36% | –2.37 | ||
| Total votes | 361,819 | 100.00% | |||
| Republican win | |||||
Ohio[edit]

- Trump:
50–60%
60–70%
70–80%
80–90% - Biden:
50–60%
60–70%
- Republican: Lorain, Mahoning
- Democratic: Montgomery
| Party | Candidate | Votes | % | ±% | |
|---|---|---|---|---|---|
| Republican | Donald Trump (incumbent) | 3,154,834 | 53.27% | +1.58 | |
| Democratic | Joe Biden | 2,679,165 | 45.24% | +1.68 | |
| Libertarian | Jo Jorgensen | 67,569 | 1.14% | –2.03 | |
| Green | Howie Hawkins | 18,812 | 0.32% | –0.52 | |
| Write-in | 1,822 | 0.03% | |||
| Margin of victory | 475,669 | 8.03% | –0.10 | ||
| Total votes | 5,922,202 | 100.00% | |||
| Republican win | |||||
| Candidate | Votes | % | |
|---|---|---|---|
| Brian T. Carroll | 1,450 | 0.02% | |
| Jade Simmons | 212 | 0.00% | |
| Tom Hoefling | 114 | 0.00% | |
| Dario Hunter | 27 | 0.00% | |
| Scattering | 16 | 0.00% | |
| President R19 Boddie | 3 | 0.00% | |
| Total votes | 1,822 | 0.03% | |
Oklahoma[edit]

- Trump:
40–50%
50–60%
60–70%
70–80%
80–90%
90–100%
| Party | Candidate | Votes | % | ±% | |
|---|---|---|---|---|---|
| Republican | Donald Trump (incumbent) | 1,020,280 | 65.37% | +0.05 | |
| Democratic | Joe Biden | 503,890 | 32.29% | +3.36 | |
| Libertarian | Jo Jorgensen | 24,731 | 1.58% | –4.17 | |
| Independent | Kanye West | 5,597 | 0.36% | N/A | |
| Independent | Jade Simmons | 3,654 | 0.23% | N/A | |
| Independent | Brock Pierce | 2,547 | 0.16% | N/A | |
| Margin of victory | 516,390 | 33.09% | – | ||
| Total votes | 1,560,699 | 100.00% | |||
| Republican win | |||||
Oregon[edit]

- Biden:
40–50%
50–60%
60–70%
70–80% - Trump:
40–50%
50–60%
60–70%
70–80%
| Party | Candidate | Votes | % | ±% | |
|---|---|---|---|---|---|
| Democratic | Joe Biden | 1,340,383 | 56.45% | +6.38 | |
| Republican | Donald Trump (incumbent) | 958,448 | 40.37% | +1.28 | |
| Libertarian | Jo Jorgensen | 41,582 | 1.75% | –2.96 | |
| Pacific Green | Howie Hawkins | 11,831 | 0.50% | –2.00 | |
| Progressive | Dario Hunter | 4,988 | 0.21% | –2.29 | |
| Write-in | 17,089 | 0.72% | |||
| Margin of victory | 381,935 | 16.09% | +5.11 | ||
| Total votes | 2,374,321 | 100.00% | |||
| Democratic win | |||||
Pennsylvania[edit]

- Biden:
40–50%
50–60%
60–70%
80–90% - Trump:
50–60%
60–70%
70–80%
80–90%
- Democratic: Erie, Northampton
| Party | Candidate | Votes | % | ±% | |
|---|---|---|---|---|---|
| Democratic | Joe Biden | 3,458,229 | 50.01% | +2.55 | |
| Republican | Donald Trump (incumbent) | 3,377,674 | 48.84% | +0.66 | |
| Libertarian | Jo Jorgensen | 79,380 | 1.15% | –1.23 | |
| Margin of victory | 80,555 | 1.16% | +0.44 | ||
| Total votes | 6,915,283 | 100.00% | |||
| Democratic win | |||||
Rhode Island[edit]

- Biden:
50–60%
60–70%
- Democratic: Kent
| Party | Candidate | Votes | % | ±% | |
|---|---|---|---|---|---|
| Democratic | Joe Biden | 307,486 | 59.39% | +4.98 | |
| Republican | Donald Trump (incumbent) | 199,922 | 38.61% | –0.29 | |
| Libertarian | Jo Jorgensen | 5,053 | 0.98% | –2.20 | |
| Alliance | Rocky De La Fuente | 923 | 0.18% | +0.04 | |
| Socialism and Liberation | Gloria La Riva | 847 | 0.16% | +0.16 | |
| American Solidarity | Brian T. Carroll | 767 | 0.15% | +0.14 | |
| Write-in | 2,759 | 0.53% | |||
| Margin of victory | 107,564 | 20.77% | +5.26 | ||
| Total votes | 517,757 | 100.00% | |||
| Democratic win | |||||
South Carolina[edit]

- Trump:
40–50%
50–60%
60–70%
70–80% - Biden:
40–50%
50–60%
60–70%
70–80%
| Party | Candidate | Votes | % | ±% | |
|---|---|---|---|---|---|
| Republican | Donald Trump (incumbent) | 1,385,103 | 55.11% | +0.17 | |
| Democratic | Joe Biden | 1,091,541 | 43.43% | +2.76 | |
| Libertarian | Jo Jorgensen | 27,916 | 1.11% | –1.23 | |
| Green | Howie Hawkins | 6,907 | 0.28% | –0.34 | |
| Alliance | Rocky De La Fuente | 1,862 | 0.07% | –0.08 | |
| Margin of victory | 293,562 | 11.68% | –2.59 | ||
| Total votes | 2,513,329 | 100.00% | |||
| Republican win | |||||
South Dakota[edit]

- Trump:
50–60%
60–70%
70–80%
80–90%
90–100% - Biden:
50–60%
60–70%
70–80%
80–90%
- Democratic: Ziebach
| Party | Candidate | Votes | % | ±% | |
|---|---|---|---|---|---|
| Republican | Donald Trump (incumbent) | 261,043 | 61.77% | +0.24 | |
| Democratic | Joe Biden | 150,471 | 35.61% | +3.87 | |
| Libertarian | Jo Jorgensen | 11,095 | 2.62% | –3.01 | |
| Margin of victory | 110,572 | 26.16% | –3.63 | ||
| Total votes | 422,609 | 100.00% | |||
| Republican win | |||||
Tennessee[edit]

- Trump:
50–60%
60–70%
70–80%
80–90% - Biden:
50–60%
60–70%
| Party | Candidate | Votes | % | ±% | |
|---|---|---|---|---|---|
| Republican | Donald Trump (incumbent) | 1,852,475 | 60.66% | –0.06 | |
| Democratic | Joe Biden | 1,143,711 | 37.45% | +2.73 | |
| Independent | Jo Jorgensen | 29,877 | 0.98% | –1.83 | |
| Independent | Kanye West | 10,279 | 0.34% | N/A | |
| Independent | Don Blankenship | 5,365 | 0.18% | +0.12 | |
| Independent | Howie Hawkins | 4,545 | 0.15% | –0.49 | |
| Independent | Alyson Kennedy | 2,576 | 0.08% | –0.03 | |
| Independent | Gloria La Riva | 2,301 | 0.08% | N/A | |
| Independent | Rocky De La Fuente | 1,860 | 0.06% | –0.10 | |
| Write-in | 862 | 0.03% | |||
| Margin of victory | 708,764 | 23.21% | –2.80 | ||
| Total votes | 3,053,851 | 100.00% | |||
| Republican win | |||||
| Candidate | Votes | % | |
|---|---|---|---|
| Brian T. Carroll | 762 | 0.03% | |
| Jade Simmons | 68 | 0.00% | |
| Tom Hoefling | 31 | 0.00% | |
| President R19 Boddie | 1 | 0.00% | |
| Total votes | 862 | 0.03% | |
Texas[edit]

- Trump:
50–60%
60–70%
70–80%
80–90%
90–100% - Biden:
40–50%
50–60%
60–70%
70–80%
| Party | Candidate | Votes | % | ±% | |
|---|---|---|---|---|---|
| Republican | Donald Trump (incumbent) | 5,890,347 | 52.06% | –0.17 | |
| Democratic | Joe Biden | 5,259,126 | 46.48% | +3.24 | |
| Libertarian | Jo Jorgensen | 126,243 | 1.12% | –2.04 | |
| Green | Howie Hawkins | 33,396 | 0.29% | –0.51 | |
| Write-in | 5,944 | 0.05% | |||
| Margin of victory | 631,221 | 5.58% | –3.42 | ||
| Total votes | 11,315,056 | 100.00% | |||
| Republican win | |||||
| Candidate | Votes | % | |
|---|---|---|---|
| Brian T. Carroll | 2,785 | 0.03% | |
| President R19 Boddie | 2,012 | 0.02% | |
| Scattering | 460 | 0.00% | |
| Tom Hoefling | 337 | 0.00% | |
| Gloria La Riva | 350 | 0.00% | |
| Total votes | 5,944 | 0.05% | |
Utah[edit]

- Biden:
50–60%
60–70%
70–80%
80–90% - Trump:
50–60%
- Democratic: Grand
| Party | Candidate | Votes | % | ±% | |
|---|---|---|---|---|---|
| Republican | Donald Trump (incumbent) | 865,140 | 58.13% | +12.59 | |
| Democratic | Joe Biden | 560,282 | 37.65% | +10.19 | |
| Libertarian | Jo Jorgensen | 38,447 | 2.58% | –0.92 | |
| Independent | Kanye West | 7,213 | 0.48% | N/A | |
| Constitution | Don Blankenship | 5,551 | 0.37% | –0.34 | |
| Green | Howie Hawkins | 5,053 | 0.34% | –0.49 | |
| Independent | Brock Pierce | 2,623 | 0.18% | N/A | |
| Independent | Joe McHugh | 2,229 | 0.15% | N/A | |
| Independent | Gloria La Riva | 1,139 | 0.08% | N/A | |
| Write-in | 612 | 0.04% | |||
| Margin of victory | 304,858 | 20.48% | +2.40 | ||
| Total votes | 1,488,289 | 100.00% | |||
| Republican win | |||||
| Candidate | Votes | % | |
|---|---|---|---|
| Brian T. Carroll | 368 | 0.02% | |
| Jade Simmons | 186 | 0.01% | |
| Tom Hoefling | 51 | 0.00% | |
| President R19 Boddie | 6 | 0.00% | |
| Scattering | 1 | 0.00% | |
| Total votes | 612 | 0.04% | |
Vermont[edit]

- Biden:
50–60%
60–70%
70–80% - Trump:
50–60%
| Party | Candidate | Votes | % | ±% | |
|---|---|---|---|---|---|
| Democratic | Joe Biden | 242,820 | 66.09% | +9.41 | |
| Republican | Donald Trump (incumbent) | 112,704 | 30.67% | +0.40 | |
| Libertarian | Jo Jorgensen | 3,608 | 0.98% | –2.22 | |
| Green | Howie Hawkins | 1,310 | 0.36% | –1.78 | |
| Independent | Kanye West | 1,269 | 0.35% | N/A | |
| Grumpy Old Patriots | H. Brooke Paige | 1,175 | 0.32% | N/A | |
| Independent | Christopher LaFontaine | 856 | 0.23% | N/A | |
| Independent | Richard Duncan | 213 | 0.06% | N/A | |
| American Solidarity | Brian T. Carroll | 209 | 0.06% | +0.06 | |
| Constitution | Don Blankenship | 208 | 0.06% | +0.04 | |
| Socialist Workers | Alyson Kennedy | 195 | 0.05% | +0.05 | |
| Liberty Union | Gloria La Riva | 166 | 0.05% | –0.05 | |
| Boiling Frog | Gary Swing | 141 | 0.04% | N/A | |
| Prohibition | Phil Collins | 137 | 0.04% | N/A | |
| Bull Moose | Keith McCormic | 126 | 0.03% | N/A | |
| Independent | Brock Pierce | 100 | 0.03% | N/A | |
| Bread and Roses | Jerome Segal | 65 | 0.02% | N/A | |
| Approval Voting | Blake Huber | 54 | 0.01% | N/A | |
| Independent | Kyle Kopitke | 53 | 0.01% | N/A | |
| Alliance | Rocky De La Fuente | 48 | 0.01% | –0.33 | |
| Independent | Zachary Scalf | 29 | 0.01% | N/A | |
| Write-in | 1,942 | 0.53% | |||
| Margin of victory | 130,116 | 35.41% | +9.00 | ||
| Total votes | 367,428 | 100.00% | |||
| Democratic win | |||||
Virginia[edit]

- Biden:
40–50%
50–60%
60–70%
70–80%
80–90% - Trump:
40–50%
50–60%
60–70%
70–80%
80–90%
- Democratic: Chesapeake, Chesterfield, James City, Lynchburg, Stafford, Virginia Beach
| Party | Candidate | Votes | % | ±% | |
|---|---|---|---|---|---|
| Democratic | Joe Biden | 2,413,568 | 54.11% | +4.38 | |
| Republican | Donald Trump (incumbent) | 1,962,430 | 44.00% | –0.41 | |
| Libertarian | Jo Jorgensen | 64,761 | 1.45% | –1.52 | |
| Write-in | 19,765 | 0.44% | |||
| Margin of victory | 451,138 | 10.11% | +4.79 | ||
| Total votes | 4,460,524 | 100.00% | |||
| Democratic win | |||||
Washington[edit]

- Biden:
50–60%
60–70%
70–80% - Trump:
40–50%
50–60%
60–70%
70–80%
- Democratic: Clallam
| Party | Candidate | Votes | % | ±% | |
|---|---|---|---|---|---|
| Democratic | Joe Biden | 2,369,612 | 57.97% | +5.43 | |
| Republican | Donald Trump (incumbent) | 1,584,651 | 38.77% | +1.94 | |
| Libertarian | Jo Jorgensen | 80,500 | 1.97% | –2.88 | |
| Green | Howie Hawkins | 18,289 | 0.45% | –1.31 | |
| Socialism and Liberation | Gloria La Riva | 4,840 | 0.12% | +0.01 | |
| Socialist Workers | Alyson Kennedy | 2,487 | 0.06% | –0.07 | |
| Write-in | 27,252 | 0.67% | |||
| Margin of victory | 784,961 | 19.20% | +3.49 | ||
| Total votes | 4,087,631 | 100.00% | |||
| Democratic win | |||||
West Virginia[edit]

- Trump:
40–50%
50–60%
60–70%
70–80%
80–90%
| Party | Candidate | Votes | % | ±% | |
|---|---|---|---|---|---|
| Republican | Donald Trump (incumbent) | 545,382 | 68.62% | +0.12 | |
| Democratic | Joe Biden | 235,984 | 29.69% | +3.26 | |
| Libertarian | Jo Jorgensen | 10,687 | 1.35% | –1.87 | |
| Mountain | Howie Hawkins | 2,599 | 0.33% | –0.80 | |
| Write-in | 79 | 0.01% | |||
| Margin of victory | 309,398 | 38.93% | –3.14 | ||
| Total votes | 794,731 | 100.00% | |||
| Republican win | |||||
| Candidate | Votes | % | |
|---|---|---|---|
| Don Blankenship | 25 | 0.00% | |
| Scattering | 16 | 0.00% | |
| Mark Charles | 11 | 0.00% | |
| Gloria La Riva | 9 | 0.00% | |
| Tom Hoefling | 6 | 0.00% | |
| Jade Simmons | 6 | 0.00% | |
| Brock Pierce | 5 | 0.00% | |
| Princess Khadijah Jacob-Fambro | 1 | 0.00% | |
| Total votes | 79 | 0.01% | |
Wisconsin[edit]

- Biden:
40–50%
50–60%
60–70%
70–80%
80–90% - Trump:
40–50%
50–60%
60–70%
70–80%
| Party | Candidate | Votes | % | ±% | |
|---|---|---|---|---|---|
| Democratic | Joe Biden | 1,630,866 | 49.45% | +3.00 | |
| Republican | Donald Trump (incumbent) | 1,610,184 | 48.82% | +1.60 | |
| Libertarian | Jo Jorgensen | 38,491 | 1.17% | –2.41 | |
| American Solidarity | Brian T. Carroll | 5,259 | 0.16% | +0.15 | |
| Constitution | Don Blankenship | 5,146 | 0.16% | –0.25 | |
| Write-in | 8,095 | 0.24% | |||
| Margin of victory | 20,682 | 0.63% | –0.13 | ||
| Total votes | 3,298,041 | 100.00% | |||
| Democratic win | |||||
| Candidate | Votes | % | |
|---|---|---|---|
| Scattering | 6,392 | 0.19% | |
| Howie Hawkins | 1,089 | 0.03% | |
| Kanye West | 411 | 0.01% | |
| Gloria La Riva | 110 | 0.00% | |
| Mark Charles | 52 | 0.00% | |
| Jade Simmons | 36 | 0.00% | |
| President R19 Boddie | 5 | 0.00% | |
| Total votes | 8,095 | 0.24% | |
Wyoming[edit]

- Trump:
60–70%
70–80%
80–90% - Biden:
40–50%
60–70%
- Democratic: Albany
| Party | Candidate | Votes | % | ±% | |
|---|---|---|---|---|---|
| Republican | Donald Trump (incumbent) | 193,559 | 69.94% | +1.77 | |
| Democratic | Joe Biden | 73,491 | 26.55% | +4.67 | |
| Libertarian | Jo Jorgensen | 5,768 | 2.08% | –3.11 | |
| Independent | Brock Pierce | 2,208 | 0.80% | N/A | |
| Write-in | 1,739 | 0.63% | |||
| Margin of victory | 120,068 | 43.38% | –2.92 | ||
| Total votes | 276,765 | 100.00% | |||
| Republican win | |||||
See also[edit]
- Results of the 2020 Democratic Party presidential primaries
- Results of the 2020 Republican Party presidential primaries
Notes[edit]
- ^ Also nominated by the Working Families Party and the Independent Party of Oregon.
- ^ Also nominated by the Conservative Party of New York State.
- ^ Also nominated by the Legal Marijuana Now, Socialist, and Socialist Alternative parties.
- ^ Also nominated by the Reform, Natural Law, and American Independent parties.
- ^ Also nominated by the Liberty Union and Peace and Freedom parties.
- ^ Also nominated by the Independence Party of New York.
References[edit]
- ^ a b c d "2020 Presidential General Election Results". Dave Leip's Atlas of U.S. Presidential Elections. Retrieved March 8, 2022.
- ^ a b "U.S. President by Congressional District". Maine Department of the Secretary of State. Retrieved December 9, 2020.