From Wikipedia, the free encyclopedia
This is not a Wikipedia article : This is a workpage , a collection of material and work in progress that may or may not be incorporated into an article. It should not necessarily be considered factual or authoritative.
2016 United States presidential election
This workpage details the results of the 2016 United States presidential election , which was the 58th quadrennial presidential election held on November 8, 2016. Republican nominee Donald Trump , a businessman from New York , defeated Democratic nominee Hillary Clinton , the former secretary of state .
Clinton led in almost every nationwide and swing-state poll with some experts predicting a landslide, however as the election neared her margins decreased. On Election Day, Trump over-performed his polls, winning several key swing-states, while losing the popular vote by 2.87 million votes. Trump received the majority in the Electoral College and won upset victories in the pivotal Rust Belt region. Ultimately, Trump received 304 electoral votes and Clinton 227, as two faithless electors defected from Trump and five from Clinton. Trump was the first president with neither prior public service nor military experience .
Trump flipped six states that voted Democratic in 2012 : Florida , Iowa , Michigan , Ohio , Pennsylvania , and Wisconsin , as well as Maine's 2nd congressional district Colorado or Nevada since 1908 ; he was also the first Republican to win without Virginia since 1924 . As of 2024, this was the last time that Arizona , Georgia , Michigan , Pennsylvania , Wisconsin , and Nebraska's 2nd congressional district
Overview [ edit ]
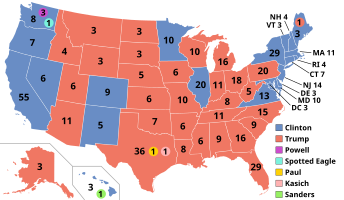
Presidential election results map. Red blue electoral votes cast by each state and the District of Columbia. On election night, Trump won 306 electors and Clinton 232. However, because of seven faithless electors (five Democratic and two Republican), Trump received just 304 votes to Clinton's 227.
Results by state, shaded according to winning candidate's margin of victory. Trump performed best in Wyoming, while Clinton performed the best in the District of Columbia. The closest state was Michigan.
Results by county, shaded according to winning candidate's percentage of the vote.
Change in vote margins at the county level from the 2012 election to the 2016 election.
Results [ edit ]
↓
227
304
Hillary Clinton Donald Trump
Electoral results
Presidential candidate
Party
Home state
Popular vote
Electoral
Running mate
Count
Percentage
Vice-presidential candidate
Home state
Electoral vote
Donald Trump
Republican
New York
62,984,828
46.09%
304
Mike Pence
Indiana
304
Hillary Clinton
Democratic
New York
65,853,514
48.18%
227
Tim Kaine
Virginia
227
Gary Johnson
Libertarian
New Mexico
4,489,341
3.28%
0
Bill Weld
Massachusetts
0
Jill Stein
Green
Massachusetts
1,457,218
1.07%
0
Ajamu Baraka
Illinois
0
Evan McMullin
Independent
Utah
731,991
0.54%
0
Mindy Finn
Texas
0
Darrell Castle
Constitution
Tennessee
203,090
0.15%
0
Scott Bradley
Utah
0
Gloria La Riva
Socialism and Liberation
California
74,401
0.05%
0
Eugene Puryear
District of Columbia
0
Rocky De La Fuente
American Delta
California
33,136
0.02%
0
Michael Steinberg
Florida
0
Richard Duncan
Independent
Ohio
24,307
0.02%
0
Ricky Johnson
Pennsylvania
0
Dan Vacek
Legal Marijuana Now
Minnesota
13,537
0.01%
0
Mark Elworth Jr.
Nebraska
0
Alyson Kennedy
Socialist Workers
Illinois
12,467
0.01%
0
Osborne Hart
Pennsylvania
0
Mike Smith
Independent
–
9,338
0.01%
0
Daniel White
–
0
Chris Keniston
Veterans
Texas
7,211
0.01%
0
Deacon Taylor
Florida
0
Other
874,893
0.64%
—
Other
—
Total
136,669,276
100%
538
538
Needed to win
270
270
Popular vote
Clinton
48.18%
Trump
46.09%
Johnson
3.28%
Stein
1.07%
McMullin
0.54%
Others
0.84%
Electoral vote
Trump
56.51%
Clinton
42.19%
Others
1.30%
Summary table [ edit ]
Donald Trump
Hillary Clinton
Gary Johnson
Jill Stein
Evan McMullin
Darrell Castle
Others
Margin
Margin
Total
Votes
%
Votes
%
Votes
%
Votes
%
Votes
%
Votes
%
Votes
%
Votes
%
%
Alabama
1,318,255
62.08%
9
729,547
34.36%
–
44,467
2.09%
–
9,391
0.44%
–
–
–
–
–
–
–
21,712
1.02%
–
588,708
27.72%
5.53%
2,123,372
Alaska
163,387
51.28%
3
116,454
36.55%
–
18,725
5.88%
–
5,735
1.80%
–
–
–
–
3,866
1.21%
–
10,441
3.28%
–
46,933
14.73%
0.74%
318,608
Arizona
1,252,401
48.67%
11
1,161,167
45.13%
–
106,327
4.13%
–
34,345
1.33%
–
17,449
0.68%
–
1,058
0.04%
–
418
0.02%
–
91,234
3.55%
-5.51%
2,573,165
Arkansas
684,872
60.57%
6
380,494
33.65%
–
29,949
2.65%
–
9,473
0.84%
–
13,176
1.17%
–
4,613
0.41%
–
8,099
0.72%
–
304,378
26.92%
3.23%
1,130,676
California
4,483,814
31.62%
–
8,753,792
61.73%
55
478,500
3.37%
–
278,658
1.96%
–
39,596
0.28%
–
–
–
–
147,244
1.04%
–
-4,269,978
-30.11%
-6.99%
14,181,604
Colorado
1,202,484
43.25%
–
1,338,870
48.16%
9
144,121
5.18%
–
38,437
1.38%
–
28,917
1.04%
–
11,699
0.42%
–
15,719
0.56%
–
-136,386
-4.90%
0.46%
2,780,247
Connecticut
673,215
40.93%
–
897,572
54.57%
7
48,676
2.96%
–
22,841
1.39%
–
2,108
0.13%
–
147
0.01%
–
361
0.02%
–
-224,357
-13.64%
3.69%
1,644,920
Delaware
185,127
41.71%
–
235,603
53.09%
3
14,757
3.33%
–
6,103
1.38%
–
706
0.16%
–
74
0.02%
–
37
0.01%
–
-50,476
-11.37%
7.26%
443,814
D.C.
12,723
4.09%
–
282,830
90.86%
3
4,906
1.58%
–
4,258
1.37%
–
–
–
–
–
–
–
6,551
2.10%
–
-270,107
-86.78%
-3.15%
311,268
Florida
4,617,886
49.02%
29
4,504,975
47.82%
–
207,043
2.20%
–
64,399
0.68%
–
–
–
–
16,475
0.17%
–
9,261
0.10%
–
112,911
1.20%
2.08%
9,420,039
Georgia
2,089,104
50.77%
16
1,877,963
45.64%
–
125,306
3.05%
–
7,674
0.19%
–
13,017
0.32%
–
1,110
0.03%
–
558
0.01%
–
211,141
5.13%
-2.69%
4,114,732
Hawaii
128,847
30.04%
–
266,891
62.22%
3
15,954
3.72%
–
12,737
2.97%
–
–
–
–
4,508
1.05%
–
–
–
1
-138,044
-32.18%
10.53%
428,937
Idaho
409,055
59.26%
4
189,765
27.49%
–
28,331
4.10%
–
8,496
1.23%
–
46,476
6.73%
–
4,403
0.64%
–
3,729
0.54%
–
219,290
31.77%
-0.14%
690,255
Illinois
2,146,015
38.76%
–
3,090,729
55.83%
20
209,596
3.79%
–
76,802
1.39%
–
11,655
0.21%
–
1,138
0.02%
–
489
0.01%
–
-944,714
-17.06%
-0.19%
5,536,424
Indiana
1,557,286
56.94%
11
1,033,126
37.77%
–
133,993
4.90%
–
7,841
0.29%
–
–
–
–
1,937
0.07%
–
775
0.03%
–
524,160
19.16%
8.96%
2,734,958
Iowa
800,983
51.15%
6
653,669
41.74%
–
59,186
3.78%
–
11,479
0.73%
–
12,366
0.79%
–
5,335
0.34%
–
23,013
1.47%
–
147,314
9.41%
15.22%
1,566,031
Kansas
671,018
56.65%
6
427,005
36.05%
–
55,406
4.68%
–
23,506
1.98%
–
6,520
0.55%
–
646
0.05%
–
301
0.02%
–
244,013
20.60%
-1.12%
1,184,402
Kentucky
1,202,971
62.52%
8
628,854
32.68%
–
53,752
2.79%
–
13,913
0.72%
–
22,780
1.18%
–
438
0.02%
–
1,441
0.07%
–
574,117
29.84%
7.15%
1,924,149
Louisiana
1,178,638
58.09%
8
780,154
38.45%
–
37,978
1.87%
–
14,031
0.69%
–
8,547
0.42%
–
3,129
0.15%
–
6,555
0.32%
–
398,484
19.64%
2.43%
2,029,032
Maine
335,593
44.87%
–
357,735
47.83%
2
38,105
5.09%
–
14,251
1.91%
–
1,887
0.25%
–
333
0.04%
–
23
0.00%
–
-22,142
-2.96%
12.33%
747,927
ME-01 154,384 39.15% – 212,774 53.96% 1 18,592 4.71% – 7,563 1.92% – 807 0.20% – 203 0.05% – 6 0.00% – -58,390 -14.81% % 394,329
ME-02 181,177 51.26% 1 144,817 40.98% – 19,510 5.52% – 6,685 1.89% – 1,080 0.31% – 130 0.04% – 17 0.00% – 36,360 10.29% % 353,416
Maryland
943,169
33.91%
–
1,677,928
60.33%
10
79,605
2.86%
–
35,945
1.29%
–
9,630
0.35%
–
566
0.02%
–
34,603
1.24%
–
-734,759
-26.42%
-0.34%
2,781,446
Massachusetts
1,090,893
32.81%
–
1,995,196
60.01%
11
138,018
4.15%
–
47,661
1.43%
–
2,719
0.08%
–
–
–
–
50,599
1.52%
–
-904,303
-27.20%
-4.06%
3,325,046
Michigan
2,279,543
47.50%
16
2,268,839
47.27%
–
172,136
3.59%
–
51,463
1.07%
–
8,177
0.17%
–
16,139
0.34%
–
2,987
0.06%
–
10,704
0.22%
9.72%
4,799,284
Minnesota
1,322,951
44.92%
–
1,367,716
46.44%
10
112,972
3.84%
–
36,985
1.26%
–
53,076
1.80%
–
9,456
0.32%
–
41,657
1.41%
–
-44,765
-1.52%
6.17%
2,944,813
Mississippi
700,714
57.94%
6
485,131
40.11%
–
14,435
1.19%
–
3,731
0.31%
–
–
–
–
3,987
0.33%
–
1,359
0.11%
–
215,583
17.83%
6.33%
1,209,357
Missouri
1,594,511
56.77%
10
1,071,068
38.14%
–
97,359
3.47%
–
25,419
0.91%
–
7,071
0.25%
–
13,092
0.47%
–
85
0.00%
–
523,443
18.64%
9.26%
2,808,605
Montana
279,240
56.17%
3
177,709
35.75%
–
28,037
5.64%
–
7,970
1.60%
–
2,297
0.46%
–
296
0.06%
–
1,598
0.32%
–
101,531
20.42%
6.77%
497,147
Nebraska
495,961
58.75%
2
284,494
33.70%
–
38,946
4.61%
–
8,775
1.04%
–
–
–
–
–
–
–
16,051
1.90%
–
211,467
25.05%
3.27%
844,227
NE-01 158,642 56.18% 1 100,132 35.46% – 14,033 4.97% – 3,374 1.19% – – – – – – – 6,181 2.19% – 58,510 20.72% % 282,362
NE-02 137,564 47.16% 1 131,030 44.92% – 13,245 4.54% – 3,347 1.15% – – – – – – – 6,494 2.23% – 6,534 2.24% % 291,680
NE-03 199,755 73.91% 1 53,332 19.73% – 11,668 4.32% – 2,054 0.76% – – – – – – – 3,451 1.28% – 146,423 54.18% % 270,260
Nevada
512,058
45.50%
–
539,260
47.92%
6
37,384
3.32%
–
–
–
–
–
–
–
5,268
0.47%
–
31,415
2.79%
–
-27,202
-2.42%
4.26%
1,125,385
New Hampshire
345,790
46.46%
–
348,526
46.83%
4
30,777
4.14%
–
6,496
0.87%
–
1,064
0.14%
–
–
–
–
11,643
1.56%
–
-2,736
-0.37%
5.21%
744,296
New Jersey
1,601,933
41.35%
–
2,148,278
55.45%
14
72,477
1.87%
–
37,772
0.98%
–
–
–
–
6,161
0.16%
–
7,425
0.19%
–
-546,345
-14.10%
3.69%
3,874,046
New Mexico
319,667
40.04%
–
385,234
48.26%
5
74,541
9.34%
–
9,879
1.24%
–
5,825
0.73%
–
1,514
0.19%
–
1,659
0.21%
–
-65,567
-8.21%
1.94%
798,319
New York
2,819,533
36.52%
–
4,556,118
59.01%
29
176,598
2.29%
–
107,935
1.40%
–
10,397
0.13%
–
955
0.01%
–
49,906
0.65%
–
-1,736,585
-22.49%
5.69%
7,721,442
North Carolina
2,362,631
49.83%
15
2,189,316
46.17%
–
130,126
2.74%
–
12,105
0.26%
–
–
–
–
–
–
–
47,386
1.00%
–
173,315
3.65%
1.61%
4,741,564
North Dakota
216,794
62.96%
3
93,758
27.23%
–
21,434
6.22%
–
3,780
1.10%
–
–
–
–
1,833
0.53%
–
6,761
1.96%
–
123,036
35.73%
16.10%
344,360
Ohio
2,841,005
51.69%
18
2,394,164
43.56%
–
174,498
3.17%
–
46,271
0.84%
–
12,574
0.23%
–
1,887
0.03%
–
26,088
0.47%
–
446,841
8.13%
11.11%
5,496,487
Oklahoma
949,136
65.32%
7
420,375
28.93%
–
83,481
5.75%
–
–
–
–
–
–
–
–
–
–
–
–
–
528,761
36.39%
2.85%
1,452,992
Oregon
782,403
39.09%
–
1,002,106
50.07%
7
94,231
4.71%
–
50,002
2.50%
–
–
–
–
–
–
–
72,594
3.63%
–
-219,703
-10.98%
1.11%
2,001,336
Pennsylvania
2,970,733
48.18%
20
2,926,441
47.46%
–
146,715
2.38%
–
49,941
0.81%
–
6,472
0.10%
–
21,572
0.35%
–
43,604
0.71%
–
44,292
0.72%
6.10%
6,165,478
Rhode Island
180,543
38.90%
–
252,525
54.41%
4
14,746
3.18%
–
6,220
1.34%
–
773
0.17%
–
52
0.01%
–
9,285
2.00%
–
-71,982
-15.51%
11.95%
464,144
South Carolina
1,155,389
54.94%
9
855,373
40.67%
–
49,204
2.34%
–
13,034
0.62%
–
21,016
1.00%
–
5,765
0.27%
–
3,246
0.15%
–
300,016
14.27%
3.80%
2,103,027
South Dakota
227,721
61.53%
3
117,458
31.74%
–
20,850
5.63%
–
–
–
–
–
–
–
4,064
1.10%
–
–
–
–
110,263
29.79%
11.77%
370,093
Tennessee
1,522,925
60.72%
11
870,695
34.72%
–
70,397
2.81%
–
15,993
0.64%
–
11,991
0.48%
–
1,584
0.06%
–
14,442
0.58%
–
652,230
26.01%
5.61%
2,508,027
Texas
4,685,047
52.23%
36
3,877,868
43.24%
–
283,492
3.16%
–
71,558
0.80%
–
42,366
0.47%
–
4,261
0.05%
–
4,634
0.05%
2
807,179
9.00%
-6.78%
8,969,226
Utah
515,231
45.54%
6
310,676
27.46%
–
39,608
3.50%
–
9,438
0.83%
–
243,690
21.54%
–
8,032
0.71%
–
4,755
0.42%
–
204,555
18.08%
-29.96%
1,131,430
Vermont
95,369
30.27%
–
178,573
56.68%
3
10,078
3.20%
–
6,758
2.14%
–
640
0.20%
–
63
0.02%
–
23,586
7.49%
–
-83,204
-26.41%
9.19%
315,067
Virginia
1,769,443
44.41%
–
1,981,473
49.73%
13
118,274
2.97%
–
27,638
0.69%
–
54,054
1.36%
–
–
–
–
33,749
0.85%
–
-212,030
-5.32%
-1.45%
3,984,631
Washington
1,221,747
36.83%
–
1,742,718
52.54%
8
160,879
4.85%
–
58,417
1.76%
–
–
–
–
17,623
0.53%
–
115,635
3.49%
4
-520,971
-15.71%
-0.84%
3,317,019
West Virginia
489,371
68.50%
5
188,794
26.43%
–
23,004
3.22%
–
8,075
1.13%
–
1,104
0.15%
–
3,807
0.53%
–
268
0.04%
–
300,577
42.07%
15.31%
714,423
Wisconsin
1,405,284
47.22%
10
1,382,536
46.45%
–
106,674
3.58%
–
31,072
1.04%
–
11,855
0.40%
–
12,162
0.41%
–
26,567
0.89%
–
22,748
0.76%
7.70%
2,976,150
Wyoming
174,419
68.17%
3
55,973
21.88%
–
13,287
5.19%
–
2,515
0.98%
–
–
–
–
2,042
0.80%
–
7,613
2.98%
–
118,446
46.29%
5.47%
255,849
Total
62,984,828
46.09%
304
65,853,514
48.18%
227
4,489,341
3.28%
–
1,457,218
1.07%
–
731,991
0.54%
–
203,090
0.15%
–
949,294
0.69%
7
-2,868,686
-2.10%
1.76%
136,669,276
Donald Trump
Hillary Clinton
Gary Johnson
Jill Stein
Evan McMullin
Darrell Castle
Others
Margin
Margin swing
Total
Vote margin swing by state 2012 to 2016. Only twelve states (as well as the District of Columbia and Nebraka's 2nd congressional district) shifted more Democratic. Close states [ edit ] States where the margin of victory was under 1% (50 electoral votes):
Michigan, 0.22% (10,704 votes) New Hampshire, 0.37% (2,736 votes) Pennsylvania, 0.72% (44,292 votes) Wisconsin, 0.76% (22,748 votes) States where the margin of victory was under 5% (85 electoral votes):
Florida, 1.20% (112,911 votes) Minnesota, 1.52% (44,765 votes) Nebraska's 2nd congressional district, 2.24% (6,534 votes) Nevada, 2.42% (27,202 votes) Maine, 2.96% (22,142 votes) Arizona, 3.55% (91,234 votes) North Carolina, 3.65% (173,315 votes) Colorado, 4.90% (136,386 votes) States where the margin of victory was under 10% (96 electoral votes):
Georgia, 5.13% (211,141 votes) Virginia, 5.32% (212,030 votes) Ohio, 8.13% (446,841 votes) New Mexico, 8.21% (65,567 votes) Texas, 9.00% (807,179 votes) Iowa, 9.41% (147,314 votes) County statistics [ edit ]
Counties with the highest percentage of Republican vote:
Roberts County, Texas – 94.58% King County, Texas – 93.71% Motley County, Texas – 92.03% Shackelford County, Texas – 91.62% Hayes County, Nebraska – 91.83% Glasscock County, Texas – 91.56% McMullen County, Texas – 90.98% Garfield County, Montana – 90.95% Grant County, Nebraska – 90.62% Wheeler County, Texas – 90.50% Counties with the highest percentage of Libertarian vote:
Los Alamos County, New Mexico – 13.89% Guadalupe County, New Mexico – 13.03% Cibola County, New Mexico – 12.03% Socorro County, New Mexico – 11.68% McKinley County, New Mexico – 11.11% Valencia County, New Mexico – 11.04% Torrance County, New Mexico – 10.94% Bernalillo County, New Mexico – 10.81% Sandoval County, New Mexico – 10.79% Ransom County, North Dakota – 10.47%
Counties with the highest percentage of Democratic vote:
Washington, D.C. – 90.86% Bronx County, New York – 88.52% Prince George's County, Maryland – 88.13% Petersburg, Virginia – 87.20% Claiborne County, Mississippi – 86.80% New York County, New York – 86.56% Jefferson County, Mississippi – 86.45% Oglala Lakota County, South Dakota – 86.40% Baltimore, Maryland – 84.66% San Francisco, California – 84.47% Counties with the highest percentage of Green vote:
Sioux County, North Dakota – 10.39% Humboldt County, California – 6.13% Mendocino County, California – 5.56% Rolette County, North Dakota – 4.66% Maui County, Hawaii – 4.60% Saguache County, Colorado – 4.55% Hawaii County, Hawaii – 4.40% San Juan County, Washington – 4.19% Trinity County, California – 4.13% Taos County, New Mexico – 4.04%
Results by state [ edit ] Nebraska [ edit ] Nebraska results by county Trump: 40–50% 50–60% 60–70% 70–80% 80–90% 90-100% Clinton: 40–50% Nebraska results by congressional district Trump: 40–50% 50–60% 70–80% 1st congressional district [ edit ] 2nd congressional district [ edit ] 3rd congressional district [ edit ] Nevada results by county Clinton: 40–50% 50–60% Trump: 50–60% 60–70% 70–80% 80–90% New Hampshire [ edit ] New Hampshire results by county Clinton: 40–50% 50–60% Trump: 40–50% 50–60% New Jersey [ edit ] New Jersey results by county Clinton: 50–60% 60–70% 70–80% Trump: 40–50% 50–60% 60–70% New Mexico [ edit ] New Mexico results by county Clinton: 40–50% 50–60% 60–70% 70–80% Trump: 40–50% 50–60% 60–70% 70–80% New York [ edit ] New York results by county Clinton: 40–50% 50–60% 60–70% 70–80% 80–90% Trump: 40–50% 50–60% 60–70% 70–80% North Carolina [ edit ] North Carolina results by county Trump: 40–50% 50–60% 60–70% 70–80% Clinton: 40–50% 50–60% 60–70% 70–80% North Dakota [ edit ] North Dakota results by county Trump: 40–50% 50–60% 60–70% 70–80% 80–90% Clinton: 50–60% 60–70% Ohio results by county Trump: 40–50% 50–60% 60–70% 70–80% 80–90% Clinton: 40–50% 50–60% 60–70% Oklahoma [ edit ] Oklahoma results by county Trump: 50–60% 60–70% 70–80% 80–90% Oregon results by county Clinton: 40–50% 50–60% 70–80% Trump: 40–50% 50–60% 60–70% 70–80% Pennsylvania [ edit ] Pennsylvania results by county Trump: 40–50% 50–60% 60–70% 70–80% 80–90% Clinton: 40–50% 50–60% 80–90% Rhode Island [ edit ] Rhode Island results by county Clinton: 50–60% Trump: 40–50% South Carolina [ edit ] South Carolina results by county Trump: 50–60% 60–70% 70–80% Clinton: 40–50% 50–60% 60–70% 70–80% South Dakota [ edit ] South Dakota results by county Trump: 40–50% 50–60% 60–70% 70–80% 80–90% 90–100% Clinton: 50–60% 60–70% 70–80% 80–90% Tennessee [ edit ] Tennessee results by county Trump: 50–60% 60–70% 70–80% 80–90% Clinton: 50–60% 60–70% Texas results by county Trump: 40–50% 50–60% 60–70% 70–80% 80–90% 90–100% Clinton: 40–50% 50–60% 60–70% 70–80% Utah results by county Trump: 40–50% 50–60% 60–70% 70–80% 80–90% Clinton: 40–50% 50–60% Write-in votes
Utah write-ins
Candidate
Votes
%
Mike Smith
19
0.00%
Dustin Baird
9
0.00%
Laurence Kotlikoff
9
0.00%
Tom Hoefling
6
0.00%
Andrew D. Basiago
4
0.00%
Mimi Soltysik
4
0.00%
Robert L. Buchanan
1
0.00%
Jamin Burton
1
0.00%
Sheila Tittle
1
0.00%
Tony Valdivia
1
0.00%
Total votes
55
0.00%
Vermont [ edit ] Vermont results by county Clinton: 40–50% 50–60% 60–70% Trump: 50–60% Virginia [ edit ] Virginia results by county and independent city Clinton: 40–50% 50–60% 60–70% 70–80% 80–90% Trump: 40–50% 50–60% 60–70% 70–80% 80–90% Washington [ edit ] Washington results by county Clinton: 40–50% 50–60% 60–70% Trump: 40–50% 50–60% 60–70% 70–80% West Virginia [ edit ] West Virginia results by county Trump: 50–60% 60–70% 70–80% 80–90% Wisconsin [ edit ] Wisconsin results by county Trump: 40–50% 50–60% 60–70% 70–80% Clinton: 40–50% 50–60% 60–70% 70–80% Wyoming [ edit ] Wyoming results by county Trump: 40–50% 60–70% 70–80% 80–90% Clinton: 50–60% See also [ edit ] References [ edit ]
U.S. U.S. U.S. (Election ) Governors Attorneys State Mayors
Bakersfield, CA Baltimore, MD Baton Rouge, LA Corpus Christi, TX Columbia, MO Fresno, CA Gainesville, FL Glendale, AZ Hampton, VA Honolulu, HI Irvine, CA Lubbock, TX Miami-Dade County, FL Milwaukee, WI Norfolk, VA Portland, OR Richmond, VA Riverside, CA Sacramento, CA Salt Lake County, UT San Diego, CA San Juan, PR Santa Ana, CA Stockton, CA Tulsa, OK Wilmington, DE Winston-Salem, NC Local State-wide


.jpg)
 Results by state, shaded according to winning candidate's margin of victory. Trump performed best in Wyoming, while Clinton performed the best in the District of Columbia. The closest state was Michigan.
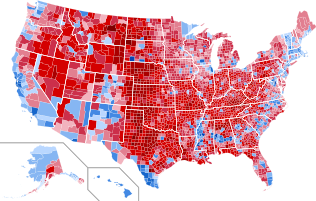 Results by county, shaded according to winning candidate's percentage of the vote.
 Change in vote margins at the county level from the 2012 election to the 2016 election.


