
User:PenangLion/City sandbox 1
This article details the list of the most populous settlements in Malaysia. Malaysia designates all populated regions into three categories: a district, municipality, or city. While district boundaries are limited to individual state-drawn district boundaries, some municipalities and cities are made up of several smaller component districts whose elevated status forms a local government. Thus, this list does not include component districts and only includes overall administrative localities defined by their respective local governments.
Within defined boundaries[edit]
This table lists all cities, municipalities and districts in Malaysia whose population exceeds 150,000 people, according to statistics published in the 2020 Malaysian census by the Malaysian Department of Statistics (DOSM). There are 64 populated regions in Malaysia whose population exceeds 150,000 people. All 13 states and the Federal Territories have at least one city, municipality or district whose population exceeded 150,000 people.
This table displays:
- The settlement rank by population as of 2020, as estimated by the DOSM;
- The settlement name;
- The state in which the settlement is located;
- The settlement's population as of 2020, as estimated in the 2020 census conducted by the DOSM;
- The settlement's population as of 2010, as estimated in the 2010 census conducted by the DOSM;
- The settlement's population difference between 2010 and 2020;
- The land area of the settlement's defined boundaries in square kilometres (km2);
- The population density of the settlement in people per square kilometres (/km2), as estimated in by the settlement's 2020 population figures.
| Key (local governments) | |
|---|---|
| Regions administered by City Councils (Majlis Bandaraya) | |
| Regions administered by Municipal Councils (Majlis Perbandaran) | |
| Regions administered by District Councils (Majlis Daerah) | |
| † | National capital |
| # | State administrative capitals |
| * | State royal capitals |
| List of the largest cities, municipalities, districts in Malaysia (in accordance to population figures of over 150,000 people) | ||||||||
|---|---|---|---|---|---|---|---|---|
| № | City, municipality or district | State | Government census figures | Land
area |
Density
(2020) |
Ref. | ||
| 2020 | 2010 | Diff. | ||||||
| 1 | Kuala Lumpur† | 1,982,112 | 1,588,750 | +24.76% | 243 km2 | 8,156/km2 | [1] | |
| 2 | Kajang | 1,047,356 | 795,522 | +31.66% | 790 km2 | 1,326/km2 | [2] | |
| 3 | Seberang Perai | 946,092 | 818,097 | +15.65% | 751 km2 | 1,260/km2 | [3] | |
| 4 | Petaling Jaya | 902,086 | 613,977 | +46.93% | 97 km2 | 9,300/km2 | [2] | |
| 5 | Klang*[note 1] | 902,025 | 744,062 | +21.23% | 573 km2 | 1,574/km2 | [2] | |
| 6 | Johor Bahru# | 858,118 | 497,067 | +72.64% | 220 km2 | 3,900/km2 | [5] | |
| 7 | Shah Alam# | 812,327 | 541,306 | +50.07% | 290 km2 | 2,801/km2 | [2] | |
| 8 | George Town# | 794,313 | 708,127 | +12.17% | 306 km2 | 2,596/km2 | [3] | |
| 9 | Subang Jaya | 771,687 | 708,296 | +8.95% | 70 km2 | 10,960/km2 | [2] | |
| 10 | Selayang | 764,327 | 542,409 | +40.91% | 549 km2 | 1,392/km2 | [2] | |
| 11 | Ipoh# | 759,952 | 657,892 | +15.51% | 643 km2 | 1,182/km2 | [6] | |
| 12 | Seremban#[note 2] | 681,541 | 515,490 | +32.21% | 959 km2 | 711/km2 | [8] | |
| 13 | Iskandar Puteri[note 3] | 575,977 | 529,074 | +8.87% | 367 km2 | 1,569/km2 | [5] | |
| 14 | Kuantan# | 548,014 | 427,515 | +28.19% | 324 km2 | 1,691/km2 | [10] | |
| 15 | Sungai Petani | 545,053 | 443,488 | +22.90% | 928 km2 | 587/km2 | [11] | |
| 16 | Ampang Jaya | 531,904 | 468,961 | +13.42% | 144 km2 | 3,964/km2 | [2] | |
| 17 | Kota Kinabalu# | 500,425 | 452,058 | +10.70% | 351 km2 | 1,426/km2 | [12] | |
| 18 | Malacca City#[note 4] | 453,904 | – | – | 277 km2 | 1,639/km2 | [14] | |
| 19 | Sandakan | 439,050 | 396,290 | +10.79% | 2,266 km2 | 194/km2 | [12] | |
| 20 | Alor Setar# | 423,868 | 405,523 | +4.52% | 609 km2 | 696/km2 | [11] | |
| 21 | Tawau | 420,806 | 397,673 | +5.82% | 6,125 km2 | 69/km2 | [12] | |
| 22 | Batu Pahat | 401,210 | 209,461 | +91.54% | 1,873 km2 | 214/km2 | [5] | |
| 23 | Kota Bharu | 396,193 | 314,964 | +25.79% | 195 km2 | 2,032/km2 | [15] | |
| 24 | Kuala Terengganu# | 375,424 | 337,533 | +11.23% | 605 km2 | 621/km2 | [16] | |
| 25 | Kuching# | 349,147 | 325,132 | +7.39% | 450 km2 | 776/km2 | [17] | |
| 26 | Sepang | 324,585 | 207,354 | +56.54% | 198 km2 | 1,639/km2 | [2] | |
| 27 | Kulim | 319,056 | 281,260 | +13.44% | 765 km2 | 417/km2 | [11] | |
| 28 | Muar* | 314,776 | 201,148 | +56.49% | 1,376 km2 | 229/km2 | [5] | |
| 29 | Pasir Gudang | 312,437 | 46,571 | +570.88% | 360 km2 | 868/km2 | [5] | |
| 30 | Kuala Langat | 307,418 | 220,214 | +39.60% | 858 km2 | 358/km2 | [2] | |
| 31 | Kulai | 294,156 | 234,532 | +25.42% | 754 km2 | 390/km2 | [5] | |
| 32 | Kangar# | 284,853 | 225,590 | +26.27% | 819 km2 | 348/km2 | [18] | |
| 33 | Kuala Selangor | 281,717 | 205,257 | +37.25% | 1,195 km2 | 236/km2 | [2] | |
| 34 | Padawan | 260,058 | 273,485 | −4.91% | 1,771 km2 | 147/km2 | [17] | |
| 35 | Miri | 248,877 | 234,541 | +6.11% | 997 km2 | 250/km2 | [17] | |
| 36 | Manjung | 246,978 | 211,113 | +16.99% | 1,114 km2 | 222/km2 | [6] | |
| 37 | Hulu Selangor | 241,932 | 194,387 | +24.46% | 1,756 km2 | 138/km2 | [2] | |
| 38 | Taiping | 241,517 | 245,182 | −1.49% | 186 km2 | 1,295/km2 | [6] | |
| 39 | Bintulu | 240,172 | 212,994 | +12.76% | 7,220 km2 | 33/km2 | [17] | |
| 40 | Kubang Pasu | 237,759 | 214,479 | +10.85% | 946 km2 | 251/km2 | [11] | |
| 41 | Kluang | 235,715 | 167,833 | +40.45% | 2,851 km2 | 83/km2 | [5] | |
| 42 | Pasir Mas | 230,424 | 180,878 | +27.39% | 570 km2 | 404/km2 | [15] | |
| 43 | Lahad Datu | 229,138 | 199,830 | +14.67% | 6,501 km2 | 35/km2 | [12] | |
| 44 | Alor Gajah | 219,210 | 173,712 | +26.19% | 660 km2 | 332/km2 | [14] | |
| 45 | Kemaman | 215,582 | 166,750 | +29.28% | 518 km2 | 416/km2 | [16] | |
| 46 | Hang Tuah Jaya | 188,857 | – | – | 145 km2 | 1,302/km2 | [14] | |
| 47 | Tumpat | 179,944 | 143,793 | +25.14% | 180 km2 | 1,000/km2 | [15] | |
| 48 | Pontian | 173,319 | 93,651 | +85.07% | 907 km2 | 191/km2 | [5] | |
| 49 | Teluk Intan | 172,505 | 128,143 | +34.62% | 127 km2 | 1,359/km2 | [6] | |
| 50 | Sibu | 170,404 | 162,676 | +4.75% | 130 km2 | 1,316/km2 | [17] | |
| 51 | Temerloh | 169,023 | 158,724 | +6.49% | 2,251 km2 | 75/km2 | [10] | |
| 52 | Semporna | 166,587 | 133,164 | +25.10% | 1,145 km2 | 145/km2 | [12] | |
| 53 | Kerian | 166,352 | 120,192 | +38.41% | 921 km2 | 181/km2 | [6] | |
| 54 | Tangkak | 163,449 | 131,890 | +23.93% | 970 km2 | 169/km2 | [5] | |
| 55 | Penampang | 162,174 | 176,667 | −8.20% | 466 km2 | 348/km2 | [12] | |
| 56 | Kota Samarahan | 161,890 | 116,685 | +38.74% | 407 km2 | 398/km2 | [17] | |
| 57 | Ketereh | 159,560 | 153,474 | +3.97% | 156 km2 | 1,023/km2 | [15] | |
| 58 | Dungun | 158,128 | 149,851 | +5.52% | 2,735 km2 | 58/km2 | [16] | |
| 59 | Bachok | 157,291 | 77,447 | +103.10% | 279 km2 | 564/km2 | [15] | |
| 60 | Besut | 154,168 | 136,563 | +12.89% | 1,234 km2 | 125/km2 | [16] | |
| 61 | Segamat | 152,458 | 103,035 | +47.97% | 2,851 km2 | 53/km2 | [5] | |
| 62 | Keningau | 150,927 | 173,103 | −12.81% | 3,533 km2 | 43/km2 | [12] | |
| 63 | Tanah Merah | 150,766 | 115,949 | +30.03% | 880 km2 | 171/km2 | [15] | |
| 64 | Papar | 150,667 | 124,420 | +21.10% | 1,243 km2 | 121/km2 | [12] | |
Distribution[edit]
_wiki.svg)
There are 64 settlements in Malaysia with a population of over 150,000 people. All 13 states and the Federal Territories have at least one settlement in the list. West Malaysia has more settlements that fit this criteria than East Malaysia, with 50 settlements against the East's 14. The states with the least amount of settlements in this list are Negeri Sembilan, the Federal Territories and Perlis, with one locality each respectively, while the state with the highest amount of settlements with a population above 150,000 is Selangor, with 11 settlements in the list.
| Population | States | Regions | Total | ||||||||||||||
|---|---|---|---|---|---|---|---|---|---|---|---|---|---|---|---|---|---|
| SR | JH | SH | SK | KT | PR | KD | TG | ML | PN | PG | FT | N9 | PS | WM | EM | ||
| 1,000,000+ | 1 | – | – | – | – | – | – | – | – | – | – | 1 | – | – | 2 | – | 2 |
| 750,000–999,999 | 5 | 1 | – | – | – | 1 | – | – | – | 2 | – | – | – | – | 9 | – | 9 |
| 500,000–749,999 | 1 | 1 | 1 | – | – | – | 1 | – | – | – | 1 | – | 1 | – | 5 | 1 | 6 |
| 250,000–499,999 | 3 | 4 | 2 | 2 | 1 | – | 2 | 1 | 1 | – | – | – | – | 1 | 13 | 4 | 17 |
| 150,000–249,999 | 1 | 4 | 5 | 4 | 5 | 4 | 1 | 3 | 2 | – | 1 | – | – | – | 21 | 9 | 30 |
| Total | 11 | 10 | 8 | 6 | 6 | 5 | 4 | 4 | 3 | 2 | 2 | 1 | 1 | 1 | 50 | 14 | 64 |
Gallery[edit]
-
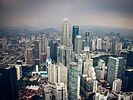 1. Kuala Lumpur, Federal Territories
 -
 2. Kajang, Selangor
 -
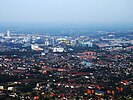
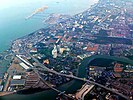 3. Seberang Perai, Penang
 -
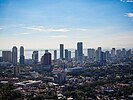
 4. Petaling Jaya, Selangor
 -
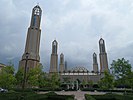
 5. Klang, Selangor
 -
 6. Johor Bahru, Johor
 -
 7. Shah Alam, Selangor
 -
 8. George Town, Penang
 -
 9. Subang Jaya, Selangor
 -
 10. Selayang, Selangor
 -
 11. Ipoh, Perak
 -
 12. Seremban, Negeri Sembilan
 -
 13. Iskandar Puteri, Johor
 -
 14. Kuantan, Pahang
 -
 15. Sungai Petani, Kedah
.jpg)
_(cropped_4to3_landscape).jpg)
.jpg)
.jpg)

.jpg)
.jpg)

.jpg)
_(cropped_4to3_landscape).png)
.jpg)
.jpg)

.jpg)
.jpg)
Largest metropolitan areas by population[edit]
The DOSM does not provide any definitions related to metropolitan areas in Malaysia, nor have any statistical calculations that concern build-up areas surrounding an urban centre. However, several major urban regions, such as Klang Valley, Greater Penang and Iskandar Malaysia, have been well-described as metropolitan areas since the early-2010s by local media and government authorities. Despite this, there remains some ambiguity in defining the actual boundaries of other smaller counterparts.
There are 11 metropolitan areas in Malaysia. Perlis and Kelantan are the only states without one. Kedah is the only state with two metro areas (Greater Penang and Alor Setar), while Greater Penang is the only metro to span three different states (Penang, Kedah and Perak). Greater Penang is also the only metropolitan area where its core city is not its most populated settlement (George Town has a population of 794,313, while Seberang Perai has a population of 946,092).
This table displays:
- The metropolitan area rank by population as of 2020, as estimated with individual local authority population figures by the DOSM;
- The name of the metropolitan area;
- The core city of the metropolitan area;
- The metropolitan area's population as of 2020, as estimated in the 2020 census conducted by the DOSM;
- The metropolitan area's population as of 2010, as estimated in the 2010 census conducted by the DOSM;
- The metropolitan area's population difference between 2010 and 2020;
- The land area of the metropolitan area's defined boundaries in square kilometres (km2);
- The population density of the metropolitan area in people per square kilometres (/km2);
| List of the largest metropolitan areas in Malaysia by population | |||||||||||
|---|---|---|---|---|---|---|---|---|---|---|---|
| № | Metropolitan area | Core city | Councils | DOSM census figures | Land
area |
Density
(2020) |
Ref. | ||||
| C | M | D | 2020 | 2010 | Diff. | ||||||
| 1 | Klang Valley[note 5] | Kuala Lumpur | 5 | 6 | 0 | 9,085,737 | 7,119,252 | +27.62% | 2,967 km2 | 3,062/km2 | [19] |
| 2 | Greater Penang[note 6] | George Town | 2 | 2 | 2 | 2,815,278 | 2,412,811 | +16.68% | 3,961 km2 | 711/km2 | [20] |
| 3 | Iskandar Malaysia[note 7] | Johor Bahru | 3 | 2 | 2 | 2,265,219 | 1,307,274 | +73.28% | 4,749 km2 | 477/km2 | [21] |
| 4 | Metropolitan Kinta[note 8] | Ipoh | 1 | 0 | 2 | 984,586 | 828,174 | +18.89% | 1,988 km2 | 495/km2 | [22] |
| 5 | Greater Kota Kinabalu | Kota Kinabalu | 1 | 0 | 2 | 949,931 | 855,556 | +11.03% | 3,277 km2 | 290/km2 | [23] |
| 6 | Greater Kuching | Kuching | 2 | 2 | 0 | 934,515 | 857,110 | +9.03% | 2,031 km2 | 460/km2 | [24] |
| 7 | Greater Kuantan | Kuantan | 1 | 1 | 1 | 884,754 | 697,788 | +26.79% | 5,211 km2 | 170/km2 | [25] |
| 8 | Seremban metropolitan | Seremban | 1 | 1 | 0 | 795,279 | 613,324 | +29.67% | 1,534 km2 | 518/km2 | [26] |
| 9 | Malacca City metropolitan | Malacca City | 1 | 1 | 0 | 642,761 | 484,885 | +32.56% | 308 km2 | 2,087/km2 | [27] |
| 10 | Greater Miri | Miri | 1 | 1 | 1 | 546,338 | 502,135 | +8.80% | 9,069 km2 | 60/km2 | [28] |
| 11 | Alor Setar metropolitan | Alor Setar | 1 | 0 | 0 | 423,868 | 405,523 | +4.52% | 609 km2 | 696/km2 | [11] |
See also[edit]
References[edit]
Notes[edit]
- ^ Klang is expected to achieve city status on 23 November 2023.[4]
- ^ The present municipal government administering the regions of Seremban had merged with the now-defunct Nilai municipal government (of the town of Nilai) in 2020.[7]
- ^ Formerly known as Nusajaya until 2015.[9]
- ^ Malacca City's administrative zone was separated into two when a breakaway municipality, Hang Tuah Jaya, was created in 2010.[13]
- ^ Klang Valley is generally recognised to encompass five cities (Kuala Lumpur, Putrajaya, Petaling Jaya, Shah Alam and Subang Jaya), and six municipalities (Kajang, Klang, Selayang, Ampang Jaya, Sepang and Kuala Langat).
- ^ Greater Penang, also referred to as the George Town Conurbation is comprised of two cities (George Town and Seberang Perai), two municipalities (Sungai Petani and Kulim) and two districts (Bandar Baharu and Kerian).
- ^ Iskandar Malaysia is comprised of three cities, two municipalities and two districts. It underwent an expansion in February 2019 which doubled its area. Its original area was at 2,217 km2.
- ^ Also referred to as Kinta Valley.
Citations[edit]
- ^ DOSM 2022, p. 75.
- ^ a b c d e f g h i j k DOSM 2022l, p. 97.
- ^ a b DOSM 2022i, p. 96.
- ^ Zainal 2023.
- ^ a b c d e f g h i j DOSM 2022a, p. 95.
- ^ a b c d e DOSM 2022g, p. 97.
- ^ New Straits Times 2020.
- ^ DOSM 2022d, p. 95.
- ^ Musa 2015.
- ^ a b DOSM 2022e, p. 94.
- ^ a b c d e DOSM 2022b, p. 97.
- ^ a b c d e f g h DOSM 2022j, pp. 101–102.
- ^ Carvalho 2010.
- ^ a b c DOSM 2022d, p. 93.
- ^ a b c d e f DOSM 2022c, p. 100.
- ^ a b c d DOSM 2022m, p. 94.
- ^ a b c d e f DOSM 2022k, p. 123.
- ^ DOSM 2022h, p. 91.
- ^ Malaysian Digest 2011.
- ^ Samat et al. 2020, p. 373.
- ^ New Straits Times 2019.
- ^ Fleming 2021, p. 8.
- ^ World Bank 2015, p. 81.
- ^ Adenan 2017.
- ^ NST–via ECERDC 2013.
- ^ Singh 2023.
- ^ Malacca City Council 2015.
- ^ Kiew 2023.
Bibliography[edit]
Academic journals and publications[edit]
- Fleming, Tom (2021). "Ipoh and Metropolitan Kinta in Numbers". Ipoh, Perak (PDF). British Council. pp. 1–37.
- Samat, Narimah; Tan, Mou Leong; Tilaki, Mohammad J. M.; Tew, Yi Lin (2020). "Modelling Land Cover Changes in Peri-Urban Areas: A Case Study of George Town Conurbation, Malaysia" (PDF). Land. 9 (10) – via ResearchGate.
- "Achieving a System of Competitive Cities in Malaysia [Main Report]" (PDF). World Bank Reimbursable Advisory Service Social, Urban, Rural, and Resilience Global Practice. 2015 – via World Bank.
Articles from magazines, newspapers and websites[edit]
- Adenan, Asmah (18 November 2017). "CM: Greater Kuching to be a Smart City". Sarawak Voice. Retrieved 21 June 2023.
- Carvalho, Martin (2 January 2010). "Malacca ushers in 2010 with new Hang Tuah Jaya municipality". The Star. Retrieved 16 June 2023.
- Kiew, Philip (16 June 2023). "Minister: Greater Miri masterplan focuses on coexistence between urban progress, sustainability". The Borneo Post. Retrieved 21 June 2023.
- "Background". Malacca City Council. 8 October 2015. Archived from the original on 11 October 2015. Retrieved 12 October 2015.
- "Greater KL to Drive Rapid Growth". Malaysian Digest. 25 October 2010. Archived from the original on 9 March 2011. Retrieved 3 July 2022.
- Musa, Zakali (7 December 2015). "Nusajaya to be renamed Iskandar Puteri". The Star. Retrieved 16 June 2023.
- "Iskandar Malaysia to be extended, covering more areas in Johor". New Straits Times. 22 February 2019.
- "Zazali appointed first Mayor of Seremban City Council". New Straits Times. Bernama. 2 January 2020. Retrieved 16 June 2023.
- Singh, Sarban (14 June 2023). "Federal govt committed to supporting Negri's Malaysian Vision Valley, says Anwar". The Star. Retrieved 21 June 2023.
- "MCKIP will put Kuantan on Asian investment map". ecerdc.com.my. New Straits Times. 2 February 2013. Retrieved 21 June 2023 – via East Coast Economic Region Development Council.
- Zainal, Siti Rohaniah (31 January 2023). "MPK dijangka capai status bandar raya 23 November ini" [MPK expects to reach city status on 23 November this year]. SelangorKini (in Malay). Retrieved 22 June 2023.
Government journals and statistical reports[edit]
- "Population and Housing Statistics". Key Findings Population and Housing Census of Malaysia 2020: Federal Territories of Kuala Lumpur (in Malay and English). Putrajaya: Department of Statistics (Malaysia). 2022. ISBN 9789672535232.
{{cite book}}: CS1 maint: url-status (link) - "Population and Housing Statistics". Key Findings Population and Housing Census of Malaysia 2020: Johor (in Malay and English). Putrajaya: Department of Statistics (Malaysia). 2022a. ISBN 9789672535126.
{{cite book}}: CS1 maint: url-status (link) - "Population and Housing Statistics". Key Findings Population and Housing Census of Malaysia 2020: Kedah (in Malay and English). Putrajaya: Department of Statistics (Malaysia). 2022b. p. 97. ISBN 9789672535126.
{{cite book}}: CS1 maint: url-status (link) - "Population and Housing Statistics". Key Findings Population and Housing Census of Malaysia 2020: Kelantan (in Malay and English). Putrajaya: Department of Statistics (Malaysia). 2022c. ISBN 9789672535126.
{{cite book}}: CS1 maint: url-status (link) - "Population and Housing Statistics". Key Findings Population and Housing Census of Malaysia 2020: Melaka (in Malay and English). Putrajaya: Department of Statistics (Malaysia). 2022d. ISBN 9789672535126.
{{cite book}}: CS1 maint: url-status (link) - "Population and Housing Statistics". Key Findings Population and Housing Census of Malaysia 2020: Negeri Sembilan (in Malay and English). Putrajaya: Department of Statistics (Malaysia). 2022e. ISBN 9789672535126.
{{cite book}}: CS1 maint: url-status (link) - "Population and Housing Statistics". Key Findings Population and Housing Census of Malaysia 2020: Pahang (in Malay and English). Putrajaya: Department of Statistics (Malaysia). 2022f. ISBN 9789672535126.
{{cite book}}: CS1 maint: url-status (link) - "Population and Housing Statistics". Key Findings Population and Housing Census of Malaysia 2020: Perak (in Malay and English). Putrajaya: Department of Statistics (Malaysia). 2022g. ISBN 9789672535126.
{{cite book}}: CS1 maint: url-status (link) - "Population and Housing Statistics". Key Findings Population and Housing Census of Malaysia 2020: Perlis (in Malay and English). Putrajaya: Department of Statistics (Malaysia). 2022h. ISBN 9789672535126.
{{cite book}}: CS1 maint: url-status (link) - "Population and Housing Statistics". Key Findings Population and Housing Census of Malaysia 2020: Pulau Pinang (in Malay and English). Putrajaya: Department of Statistics (Malaysia). 2022i. ISBN 9789672535164.
{{cite book}}: CS1 maint: url-status (link) - "Population and Housing Statistics". Key Findings Population and Housing Census of Malaysia 2020: Sabah (in Malay and English). Putrajaya: Department of Statistics (Malaysia). 2022j. ISBN 9789672535218.
{{cite book}}: CS1 maint: url-status (link) - "Population and Housing Statistics". Key Findings Population and Housing Census of Malaysia 2020: Sarawak (in Malay and English). Putrajaya: Department of Statistics (Malaysia). 2022k. ISBN 9789672535225.
{{cite book}}: CS1 maint: url-status (link) - "Population and Housing Statistics". Key Findings Population and Housing Census of Malaysia 2020: Selangor (in Malay and English). Putrajaya: Department of Statistics (Malaysia). 2022l. ISBN 9789672535126.
{{cite book}}: CS1 maint: url-status (link) - "Population and Housing Statistics". Key Findings Population and Housing Census of Malaysia 2020: Terengganu (in Malay and English). Putrajaya: Department of Statistics (Malaysia). 2022m. ISBN 9789672535126.
{{cite book}}: CS1 maint: url-status (link)