
User:Mdd/History of flowcharting
< User:Mdd
Flowcharting is the charting of a flow of activities, data and/or information in a system. It seems:
- Flowcharting as a topic of reflection has become popular in the 1970s, yet description of its use go back to the early 20th century.
- In the 1970s reflection occurred in multiple fields: Auditing (Porter & Burton, 1971), Business education (Business Education Forum (1975), Financial Management (Hospital Financial Management, 1975), computer system design (Atwood, 1977) etc.
- It has become a building block in many software development methodologies, modelling languages
Quotes, 20th century[edit]
1900s-1910s[edit]
- See also: Charles Day (1879-1931) and John Calder (1866-1936)
- The first disadvantage of the numerical method of indexing is the necessity of a separate index to locate individual correspondence. On the principle that a straight line is the shortest distance between two given points, We can-imagine no good reason why it need be necessary to look in two places to find the correspondence. In Fig. 120 we illustrate this, principle by means of a graphic chart. one case, the filing clerk goes first to the index drawer, finds the card of the individual, gets the number, then goes to correspondence files, refers to another index and finally finds the desired folder. One of the cardinal principles of system is, “do the thing right but do it in the easiest possible way.” We think no further argument is required to show which is the easiest way to find a given folder.
- Griffith, James Bray (ed.). Systematizing. International Accountants' Society, inc. Detroit; The Book Keeper Press, 1905. p. 406
Procedure for Indexing, 1905
-
 Procedure for Alphabetical Indexing, 1905
 -
 Procedure for Numerical Indexing, 1905


- In any large office having several departments, and where a considerable number of people are employed, there is at all times quite a large amount of correspondence out of the files. Various department heads call for correspondence relating to some subject in which they are interested, and before the papers are returned, someone else is likely to want to refer to the same correspondence. It is necessary, therefore, for the file clerk to know to whom the papers have been delivered so that they may quickly be located. To accomplish this, it is best to have a form of requisition.
We illustrate in Fig. 121 a form used by one of the largest manufacturing concerns. These requisitions are put up in pads and furnished to every department head and employe who is privileged to call for papers from the files. From the president down, everyone is required to fill out one of these requisition slips, before he can secure any correspondence.- Griffith, James Bray (ed.). Systematizing. International Accountants' Society, inc. Detroit; The Book Keeper Press, 1905. p. 406
- Metallurgical Chart of Operations in the Mill of the Butters Copla Mines in Sinaloa, Mexico. Min. Sci. Press, 94, 221 (Feb. 16. 1907). Press, 94, 221 (Feb. 16. 1907).— A graphic presentation of the work done in this mill. A process chart showing the extraction in the various operations, a consumption table, showing the consumption of the various materials used in the process, and a pair of recovery charts showing the recovery from sands and slimes with...
- Chemical Abstracts, 1907.
- The work of the mine-manager will be facilitated by devising a labor-chart which will show diagrammatically the various departments of labor, the number and class of men employed, the cost, and the method of supervising each class. The foreman of each department should have a labor-chart pertaining to his own special department, and all charts of the various superintendents, combined on one sheet, should make up the manager's chart, which will serve also as a " flowsheet" of authority in the organization. A labor-chart may show the distribution of labor for a month, or a year, or any other period.
- Bulletin of the American Institute of Mining Engineers. nr 25–30, 1909, p. 79

- One of the most useful methods of describing the various steps in an operation is by means of “flow sheets.” These took their name from ore-concentrating processes, where they have been long used to describe the flow of ore, or of water through the mills. They closely resemble the old-fashioned family trees, where the relation of the different members to each other were shown, and flow sheets might well be called "process trees."
- The principle of flow sheets is of wide application; in business, it can be used to show the organization of the staff and to whom each is responsible; in manufacturing, the passage of the material through the works, from department to department, and even the steps in each department, can be shown; in milling or metallurgical operations, the passage of the material from process to process and the resulting products and their disposal can be shown; in power distribution, the heat generated by coal under the boilers can be followed in its change to mechanical power and its application to various machines.
- Flow sheets are useful to give a picture of a technical operation, or process to a non-technical person, and, for such purposes, may be very simple, and details and minor parts of the operation may be omitted. To the engineer, flow sheets are of great value. first, in studying the operation of a plant; second, in describing a process briefly, yet completely, and third, In designing.
- Edward B. Durham. "Flow Sheets," in: The California Journal of Technology, Volumes 14-15. The University, 1909. p. 7
- Remark : In this description Durham talks about features of, what we now know as, both the organizational chart and of the flow chart. Yet, this article might be one of the first articles solely devoted to the flow chart.
- The flow-sheet illustrates clearly the sequence of the various operations and is self-explanatory...
- Mining and Scientific Press, Vol. 100 (1910), p. 357
- The management of Utah Copper Company made a decided move for the better when early in 1910 it radically changed the flow sheet of the mill. Formerly all the pulp had gone to Chilean mills to be...
- "Revised Flow Sheet of Utah Copper' Mill," in: The Engineering and Mining Journal, Vol. 90 No. 1 (1910), p. 1264
- Comment: This quote indicates the flow sheet was used for business process improvement.

- The routing of work through the many processes and departments of a large plant is a subject of such great importance that charts are frequently desired for the study of such routing. Fig. 14 is a fairly good example of this class of chart. In a complete chart, the departments would of course be designated for easy reference, by names, numbers, or letters. Colored ink could be used to keep one class of work distinct from another. Colored inks would help tremendously in simplifying Fig. 14, but are not available here because of the prohibitive expense of color printing. Colored drawing inks can be obtained at almost any stationery store. A bottle of each color should be a part of the equipment of any person who is regularly doing chart work. Note in Fig. 14 the small curves drawn where one route line crosses another line. By means of small curves like these it is very easy to keep the lines separate and to show clearly that the lines crossing each other are entirely independent.
- Brinton, Willard Cope. Graphic methods for presenting facts. The Engineering magazine company, 1914. p. 16-19

- Orders and other printed forms sent through a large organization must follow a routing entirely distinct from that actually followed by the heavy materials. The routing of printed forms in a large business is, in itself, a matter worthy of most careful study to get a true understanding of their complex movements. A clear idea of office system is almost impossible unless the data are charted. Fig. 15 may give some suggestions for a chart to show the movement of printed forms through an industrial plant. Here again printing by colored inks such as would be used on the original drawing would be of great service in making the chart easy to understand and easy to follow from department to department.
If a building contains many stories the routing diagram for materials and also the routing diagram for printed forms can be made conveniently by a rough perspective drawing showing the different floors as planes one above the other. Colored ink lines on the perspective chart will show clearly the movement of materials through the manufacturing building, and will indicate the elevator movements for material in a manner not possible if the departments are represented all in one plane on the ordinary sheet of paper. Perspective charts of floors, one above the other, are so simply made that their advantage should not be overlooked when preparing routing charts for plants having multi-story .buildings.- Brinton, Willard Cope. Graphic methods for presenting facts. The Engineering magazine company, 1914. p. 16-19
- Comment : While Brinton (1914) visualized in a routing diagram for both materials and data (the printing forms) Gilman (1920) visualized both in two separate diagrams: a "Flow Chart of Flow of Materials through Various Processes" and an "Order Flow Chart of a Company"
1920s-1930s[edit]
- ORGANIZATION CHARTS
Even such a complicated thing as the organization of a large business may #be reduced to the form of a picture. In Figure 10 is illustrated an organization chart which clearly shows how such a complex and intangible thing as organization may be crystallized into the form of a picture.
Organization charts are of the very highest importance in connection with expert consulting services such as accountants and engineers are called upon to per- form. The defects of an organization are never so apparent as when an attempt is made to construct an organization chart. It is almost an invariable ruled that public accountants engaged in system work construct organization charts for their clients before taking any other steps, for the very good reason that the accounts merely reflect organization activity, and until the organization is clearly determined, the appropriate accounting system cannot possibly be constructed. There are no particular rules with regard to the technique of constructing organization charts. This is a procedure which is almost unstandardized. Each accountant or engineer follows his own fancy as to form and arrangement of these exhibits.- Stephen Gilman (1920) Graphic Charts for the Business Man, p. 16-17 : About the organizational chart
- FLOW CHARTS
Another type of chart which has been in use for many years among engineers and which is attaining considerable vogue among accountants is what is known as a "flow" chart. The flow chart usually pictures the flow of materials through the various processes in a factory. The flow chart usually pictures the flow of materials through the various processes in a factory. Figure 11 shows a typical flow chart. Such exhibits are often very useful to the consulting cost accountant as well as to the efficiency man, since they since they enable them to visualize in a comprehensive way the activities of an organization.
As in the case of organization charts, we find there is no particular standardization as to form, although it is a safe rule that the simpler they are, the better.- Stephen Gilman (1920) Graphic Charts for the Business Man, p. 17
Three types of flow charts in Graphic Charts for the Business Man, 1920
-
 Flow Chart of Flow of Materials through Various Processes
 -
 Order Flow Chart of a Company
 -
 Car Flow Chart


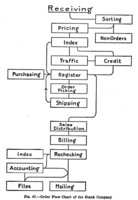
- In nearly all efficiency work it is necessary to construct flow charts. This type of chart has already been illustrated (see Figure 11). Another type of flow chart is shown in Figure 47, representing the procedure of handling orders in a large mail-order house. Another flow chart built on a different basis is shown in Figure 48, which represents a traffic study made in the city of Chicago, based upon which some startling recommendations for rerouting of cars were made.
- Stephen Gilman (1920) Graphic Charts for the Business Man, p. 57-58
- The process chart is a device for visualizing a process as a means of improving it. Every detail of a process is more or less affected by every other detail; therefore the entire process must be presented in such form that it can be visualized all at once before any changes are made in any of its subdivisions. In any subdivision of the process under examination, any changes made without du£ consideration of all the decisions and all the motions that precede and follow that subdivision will often be found unsuited to the ultimate plan of operation.
- Frank Bunker Gilbreth & Lillian Moller Gilbreth. Process Charts. American Society of Mechanical Engineers. (1921) p. 3
Standard Symbols for Process Charts by Gilbreth, 1921
-
 Standard Symbols for Process Charts (1), 1921
 -
 Standard Symbols for Process Charts (2), 1921
 -
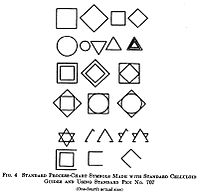 Chart Symbols Made with Standard Celluloid Guides and Using Standard Pen, 1921
,_1921.jpg)
,_1921.jpg)

Three examples of Process Charts by Gilbreth, 1921
-
 Process Chart for Loading Rifle Grenades,1921
 -
 Process Chart for Ordering Blank Forms - Present Method, 1921
 -
 Proposed Process Chart for First Orders, 1921


1940s-1950s[edit]
- This A.S.M.E. Special Committee on the Standardization of Therbligs, Process Charts, and Their Symbols was appointed on July 3, 1942, following the recommendation made by Dr. L. P. Alford in October, 1941, to the effect that the executive committee of the A.S.M.E. Management Division consider the standardization of the number, definitions, scope, and the symbols of pure motions, and of the activities as shown on the process charts. These techniques of motion and process analysis were originally developed by Dr. Frank B. and Dr. Lillian M. Gilbreth.
- A.S.M.E. Special committee on standardization of therbligs, process charts, and their symbols. ASME standard operation and flow process charts. The American society of mechanical engineers, 1947. p. 2: on the flow process chart
- It was pointed out that divergencies in the form of charts and symbols were beginning to appear in common practice and that a valuable service would be rendered to industrial management if standards for these charts and symbols were set, thus maintaining a common medium of expression for all works in this field. The problem was broken down into two parts: (1) Standardization of process charts and their symbols and (2) standardization of definitions of therbligs and their symbols.
After one year of activity it completed proposals for the following definitions of process charts, charting procedure, symbols and definitions of activities, criteria or symbols, principles and practices for construction of operation process charts, and principles and practices for construction of flow process charts.- A.S.M.E. ASME standard operation and flow process charts, 1947. p. 2
- Flow Process Chart and How to Use It. 15 min. Sound. Color. DeLux Lab. Rental, $4.00. The film begins with a complete analysis of the flow process chart. It then takes an example and analyses it.
- University of Michigan Official Publication, Vol. 49, (1948), p. 14
- screenculture.org (2015) wrote: "This is an educational film which points out a way to save time in our daily routine. It shows, for instance, how many waste-movements a man actually makes while shaving. Its chief purpose is to try to make one think, while going from one place to some other place to do another job of work, just how many things that can be done while they are in that are, thus saving a lot of time.” (source)

- It should be clear from the preliminary analysis of 7.1, that in planning a coded sequence the thing that one should keep primarily in mind is not the original (initial) appearance of that sequence, but rather its functioning and continued changing while the process that it controls goes through its course.
It is therefore advisable to begin the planning at this end, i.e. to plan first the course of the process and the relationship of its successive stages to their changing codes, and to extract from this the original coded sequence as a secondary operation.
Furthermore, it seems equally clear, that the basic feature of the functioning of the code in conjunction with the evolution of the process that it controls, is to be seen in the course which the control C takes through the ceded sequence, parallelling the evolution of that process. therefore' propose to begin the planning of a coded sequence by laying out a schematic of the course of C through that sequence, i.e. through the required region of the selectron memory. This schematic is the flow diagram of C Apart from the above a priori reasons, the decision to make the flow diagram of C the first step in code planning appears to be extensively justified by our ovn experience with the coding of actual problems.- Goldstine, Herman Heine, and John Von Neumann. Planning and coding of problems for an electronic computing instrument. Institute for Advanced Study, 1948. p. 4
1960s[edit]
- "Flow-charting* is a very broad term used to describe a number of charting and diagramming operations, many of them not peculiar to data processing. Decision flow charting and work flow charting and diagramming have been used in other fields for many years, although the concept seems to be a relatively new one among librarians.
- Schultheiss, Louis A., and Edward M. Heiliger. "Techniques of flow-charting." (1963).
- Flowcharting is a less general term and is applied to the analysis and construction of the various graphic aids used in programming. The actual writing of the instructions from these flowcharts is often called coding, since this is what is actually ...
- Peter D. Abrams, Walter Corvine (1966) Basic data processing. p. 262
- The FLOWTRACE system produces flowcharts of programs written in “almost any” programming language. One must describe the syntax of the control statements in his language; for this purpose a metalanguage is available. The resultant object deck is used to flowchart any programs in the language described. Several examples of FAP and SNOBOL flowcharts are given. However, it is not necessary to confine one's scope to existing languages. One may define his own language in any “well-structured” manner. This feature is particularly useful when it is desirable to chart only comments within a program. Such an approach permits the documentation of descriptive remarks and avoids the inclusion of coding details.
- Sherman, Philip M. "FLOWTRACE, a computer program for flowcharting programs." Communications of the ACM 9.12 (1966): 845–854.
- (3) Since the system is displayed in pictorial form, it is very much easier to spot weaknesses in internal control and so on.
A note of caution should be added at this point. Flowcharting is a technique which can be of great use to an accountant. But it is not a panacea for all systems' ills and indeed there are occasions when its use would be an unnecessary waste of time...- Leland Lawrence Briggs (1968) The Accountants Digest. Vol. 34–35. p. 26
- Flowcharting: Has the organization adopted a standard flowchart convention? Flowcharting is the basic component of any documentation system. To be of maximum benefit to all those who will use them, the charts should be prepared in a
- Management Controls. Vol. 16–17, (1969), p. 152
- ...
- Schriber, Thomas J. Fundamentals of flowcharting. (1969).
- Flowcharts are a means of presenting information and operations so that they are easy to visualize and follow. They show the flow of data through an information processing system, the operations performed in the system, and the sequence in which they are performed.
- While flowcharts are now widely used in the field of information processing, they are occasionally misinterpreted because of a lack of uniformity in the meaning and use of specific symbols. In order to reduce these misunderstandings, the flowchart symbols used are consistent with those developed by the X3. 6 committee on flowchart symbols for information processing. In addition, the company has assigned certain other symbols to special functions and media. These symbols are used in system and program flowcharts.
- A system flowchart describes the flow of data through all parts of a system. In addition to three basic symbols and the supplementary annotation symbol, fourteen system flowchart symbols may be used to describe this flow and the relationships among information (and its medium), equipment, equipment operations and manual operations. In a system flowchart an entire program run or phase is always represented by a single processing symbol, together with the input/output symbols.
- A program flowchart describes what takes place in a stored program. It displays specific operations and decisions, and their sequence within the program. In addition to three basic symbols, six program flowchart symbols may be used, as well as the supplementary annotation symbol.
- IBM Corporation. Flowcharting Techniques. Technical Publication C20-8152- 1, IBM Corporation, 1969
- FLOWCHARTING TEMPLATE
- In order to encourage standardization in the use of symbols, thereby simplifying the problem of exchanging information, IBM has made available the Flowcharting Template (X20-8020) shown in Figure 1. The template includes all the symbols necessary for drawing both system and program flowcharts. The heavier grids at each symbol indicate the centers of the symbols, and for those symbols which can be striped (see page 18) the recommended stripe placement is also indicated by a heavier grid.
- Along the left edge is an area in which the author can print his name. In order that all symbols be consistent, the template should be used face up. Although most manually generated flowcharts are drawn with pencil or ball-point pen, it is sometimes necessary to use ink-flowing pens. In order to prevent blotting from an ink-flowing pen, small strips of masking tape can be attached to the solid areas on the reverse side of the template to raise if off the paper.
- IBM Corporation. Flowcharting Techniques. Technical Publication C20-8152- 1, IBM Corporation, 1969
1970s[edit]
1970-74[edit]
- The ISO and ANSI X3. 5 standard flowchart symbols and their usage in reformation processing are explained and examples given. The two main categories of flowchart--the system chart or run diagram, and the flow diagram or block diagram--are stressed. For ...
- Chapin, Ned. "Flowcharting with the ANSI standard: A tutorial." ACM Computing Surveys (CSUR) 2.2 (1970): 119–146.
- Flowcharting is a procedure which depicts strategies as a simplified network of lines and symbols. Many of the flowcharts described in this manual follow the strategies used in courses developed at Penn State's CAI Laboratory, College of Education. In order to provide a variety of examples, additional strategies and flowcharts were developed by the author specifically for this manual.
- Dwyer, Carol A. Teaching Strategies and Tactics for Computer-Assisted Instruction. (1970) p. 7
- Flowcharting is a means of presenting a course description so that it is easy to visualize and follow. Simple geometric figures are used to show the flow of the course through which a student may pass. A flowchart may be used while a course is being developed to experiment with the sequence of presentation or may be used as a means of communication between the curriculum specialist or course author and a programer. Flowcharts can depict major logical steps ur any degree of detail desired and are commonly used as a means of documenting a program. An over-all course flowchart would indicate general steps without much detail; whereas a detailed program flowchart is a map of the program. A program flowchart should be labeled so that the associated instructions from the programing language are referenced; thus, understanding and modification of the course are both facilitated.
- Dwyer, Carol A. Teaching Strategies and Tactics for Computer-Assisted Instruction. (1970) p. 9
- Principles of Flowcharting : In preparing the flowcharts in this manual, several principles have been adhered to:
- Generally, the direction flow of the chart is from left to right and top to bottom.
- Arrows are placed on each line.
- Arrowed lines are as straight as possible, and in most cases, do not cross each other.
- If many arrowed lines point to one block, they are merged into one line before entering that block.
- Entry points of arrows generally are in the middle of the side of a block, except that decision blocks are entered and exited at vertices.
- Each decision block has at least two exit points.
- An explanation of the flowchart has been placed in a key with the number of each item in the key placed in a block on the chart.
- Flowcharts with a separate key are used throughout this manual since the explanations are usually too lengthy to be included within the blocks of tile diagram.
- Dwyer, Carol A. Teaching Strategies and Tactics for Computer-Assisted Instruction. (1970) p. 9
- ...
- Farina, Mario V. "Flowcharting." (1970).
- ...
- Bohl, Marilyn. "Flowcharting techniques." (1971).
- So far we have been describing methods of gathering audit evidence, but for handling this evidence, once gathered, there are two important techniques, flowcharting and statistical sampling. Flowcharting is the method whereby we accumulate...
- W. Thomas Porter, John C. Burton (1971) Auditing; a conceptual approach. p. 170
- ... is a solution recognized? f . What are the alternatives to solving the problem? 5. What are the characteristics of a good algorithm? Fliwchariifl! A language for specifying problem solutions Flowcharting is the 7 Problem Solving and Algorithms.
- Richard L. Nolan (1974) Introduction to computing through the Basic language. p. 7
- Flowcharting is the most common method of planning the logic and flow of a computer application. Two types of flowcharts are used — the system flowchart, which describes the flow of documents and major processing tasks, and the program ...
- Gordon Bitter Davis Computer data processing (1973), p. 122; Also published as: Computers and information processing. (1978). p. 112
1975-79[edit]
- Since flowcharting is a programming language and is computer independent, the retrieved information can be displayed in two forms: 1 . Program Listing 2. Flowchart Form a. Flowchart of the listing b. Flowchart of the listing that is independent ...
- Bernard B. Bycer (1975) Flowcharting: programming, software designing, and ... p. 233
- A major cause of this negative attitude toward flowcharting is the result of teaching that focuses on the flowcharting rules and symbols as opposed to flowcharting concepts.
- Business Education Forum. Vol. 30. (1975), p. 68
- Flowcharting is the easiest and most understandable way to document business office/ancillary department procedures, claims D. Corrine Doty.
- Hospital Financial Management. Vol. 29, Nr. 7-12 (1975)
- Herman H. Goldstine and John von Neumann were wrestling with the... problem... : How should algorithms be represented in a precise way, at a higher level than the machine's language? Their answer... was due in large measure to Goldstine' s analysis of the problem together with suggestions by von Neumann, Adele Goldstine, and Arthur W. Burks...: they proposed a pictorial representation involving boxes joined by arrows, and they called it a "flow diagram". During 1946 and 1947 they prepared an extensive and carefully worked out treatise on programming based on the idea of flow diagrams.., and it is interesting to compare this work to that of Zuse. There are striking differences, such as an emphasis on numerical calculation rather than on data structures; and there are also striking parallels, such as the use of the term "Plan" in the titles of both documents. Although neither work was published in contemporary journals, perhaps the most significant difference was that the treatise of Goldstine and von Neumann was beautifully "Varityped" and distributed in quantity to the vast majority of people involved with computers at that time. This fact, coupled with the high quality of presentation and von Neumann's prestige, meant that their report had an enormous impact, forming the foundation for computer programming techniques all over the world. The term "flow diagram" became shortened to "flow chart" and eventually it even became "flowchart" — a word which has entered our language as both noun and verb.
- Knuth, Donald E., and Luis Trabb Pardo. "The early development of programming languages." A history of computing in the twentieth century (1976): 197–273.
- We all know what flowcharts are; but comparatively few people have seen an authentic original flow diagram. In fact, it is very instructive to go back to the original style of Goldstine and von Neumann, since their inaugural flow diagrams represent a transition point between the mathematical "equality" notation and the computer-science "assignment" operation...
- Knuth, Donald E., and Luis Trabb Pardo. "The early development of programming languages." A history of computing in the twentieth century (1976): 197–273.
- Systems flowcharting is the method used to describe a system in diagram form and is the means of communicating the operations of the system to another person or to confirm beliefs about the system to the analyst himself.
- Jerry W. Atwood (1977) The Systems Analyst: How to Design Computer-based Systems.
- Flowcharting is the process of using graphical symbols ( Fig. 5-2 ) to represent the various steps in the solution to a problem. The process of flowcharting results in a drawing that is essentially a picture of your algorithm.
- Louis E. Frenzel (1978) Getting Acquainted with Microcomputers. p. 131
- As mentioned earlier, one disadvantage of flowcharting is the difficulty in maintaining the flowchart to reflect the true current status of a program. An alternative to flowcharting is to work with pseudocode.
- Jan Lee Mize, William W. Cotterman, H. Michael Snell (1978) Essentials of structured COBOL programming. p. 283
1980s[edit]
- ... Flowcharts aid in the understanding of the sequence and relationships of activities and documents.
- c. Working papers are not complete unless they include flowcharts as well as memoranda on internal control.
- d. Flowcharting is the most...
- Belverd E. Needles, Doyle Z. Williams, J. Owen Cherrington (1980) The CPA examination: a complete review, 1980-81.
- ... however; the circle is just a convenient symbol to represent a file of some kind. One of the weaknesses of flowcharting is the tendency of an arbitrarily selected symbol to influence future decisions. We must be careful not to let this happen.
- William S. Davis (1981) Computers and Business Information Processing. p. 200
- Flowcharting is the traditional program design method. Its advantages are that it shows the structure of the program in a pictorial form, it has a set of standard symbols (see Figure 8- 1), and it is Designing and Debugging .
- Lance A. Leventhal (1981) Microcomputer Experimentation with the Motorola MEK6800D2.
- ... shown to be completely impractical when the process has been represented in flowchart form. Flowcharting Standards. A common practice in flowcharting is the use of different symbol shapes to represent different functions (as evident by
- Wilson T. Price (1981) Introduction to computer data processing. p. 66
- Flowcharting is a process of diagramming all the components of a particular activity; the result is an easy-to-read, understandable, visual display. It replaces the cumbersome, inefficient narrative procedure, which is solely verbal, tends to be
- James Cabeciras (1982) The multimedia Library: Material Selection and Use. p. 57
- Combination Documents flowcharting is the second level in the procedural flowcharting of the functional area under study...
- William L. Harper, Robert C. Pollard (1982) Data communications desk book ; a systems analysis approach.
- Flowcharts systems flowchart, program flowchart an organization logic they are a means of communication, analytic tools, and a form of documentation vital prior to assist to assist 1 The two most commonly used types of flowcharts are the... and 2 A...
- Lawrence Orilia (1982) Study Guide to Accompany Introduction to Business Data. p. 86
- Flowcharting is the most efficient means available for summarizing internal control.
- 4-25 The auditor's study and evaluation of internal control is done for each of the following reasons except
- a. To provide a basis for constructive service ...
- Richard A. Scott, John R. Page, H. Paul Hooper (1982) Auditing: A Systems Approach. p. 138
- CHAPTER 8 Flowcharting
- OBJECTIVE
- This chapter presents the basic techniques of drawing flowcharts and presents three major examples that serve to illustrate the strengths and weaknesses of this graphical language. Flowcharting is the most popular algorithmic language used by programmers, but great discipline is required to use it effectively...
- William Mitchell (1984) Prelude to Programming: Problem Solving and Algorithms. p. 103
- ... maps, patterns, and illustrated instructions for assembly are types of flowcharts. • Flowcharting is the most popular tool for data system design. Any logical process can be flowcharted and, thus, can be flowcharting and other logic tools • 411.
- George B. Potter (1984) Data processing: an introduction. p. 411
- It would be misleading to imply that flowcharting is the only or the best method of devising a plan for the computer solution to a problem. In some situations problem solving tools such as pseudolanguage descriptions and structure charts may ...
- Lawrence S. Leff, Arlene Podos (1985) Computer Programming in Fortran the Easy Way. p. 77
- In information processing, flowcharting is the process of using graphic symbols to show the various steps used to solve a problem. A flowchart pictorially presents the flow of data through an information processing system, as well as the operations performed within the system and the sequence in which they are performed.
- The two most commonly used types of flowcharts are the program flowchart and the system flowchart (see Chapter 15). Flowcharts are generally useful at all stages during the problem-solving process. Initially, the systems flowchart is used to describe the flow of data through the system. This flowchart can be used by systems analysts, programmers, and others to graphically illustrate the entire process in a concise form. If one wishes to analyze in detail how a particular procedure within the systems flowchart is to be carried out by the computer, the program flowchart for that procedure could be examined. Thus, a program flowchart is a narrow, very specific diagram that shows what will be accomplished rather than how it is accomplished. Figure 7-1 illustrates a simple program flowchart. programmers because it forces them to think about problems in a logical, step-by-step manner. Experienced programmers often skip putting a flowchart on paper because they are able to resolve problems mentally, just as you are able to solve the problem of quenching your thirst without diagramming the steps involved. Still, good reasons for even experienced programmers to construct flowcharts include
- □ Providing a way of communicating the program logic to others
- □ Aiding the coordination of efforts of two or more programmers working on the same
- □ Refreshing the programmer's memory about the steps involved in a program
- □ Providing a common language between programmers using...
- Donald D. Spencer. Computers and information processing, C.E. Merrill Pub. Co., 1985. p. 164
- One of the most recently developed is the hierarchy chart, which along with pseudocode and flowcharting, is the fundamental tool used with structured programming. These three techniques, which work quite well, will be the design tools used...
- James Payne (1986) Structured BASIC for the IBM PC: With Business Applications.
- Flowcharting is the traditional method for program design. Its advantages are its graphic form, set of standard symbols (see Figure 8–1), and wide recognition and acceptance. Figure 8-1 Standard flowchart symbols. Input/Output...
- Lance A. Leventhal (1988) Microcomputer experimentation with the IBM PC. p. 148
- The AA refers to the field of Accounting and Auditing; the 19 refers to the category and the 06 to the learning unit within the category, in this instance flowcharting is the sixth learning unit within the category of "Study and Evaluation of Internal...
- Georgia Journal of Accounting. Vol. 10 (1989), p. 17
1990s[edit]
- ... introduction to information and data concepts, a refreshing change from the usual "history of computers" . It covers hardware and software in some detail, going on to the languages. Strangely enough, though, flowcharting is the last chapter.
- Dataquest: DQ. (1992). p. 167
- Flowcharting is the tool of choice for this step. XI COLLECT THE FACTS found by the investigation. / You need to know what happened, as well as what should have happened. Corroborate these facts with the defined work process. Locate the...
- Balance, Vol. 1-2 (1997)
- (C) - Flowcharting is the symbolic presentation of a system in a sequential order. It is designed to show what each department does as well as the creation and disposition of all documents. (1) - The advantages are that it provides an excellent ...
- Joe Ben Hoyle (1999) Wiley CPA examination review fast track study guide. p. 66
Quotes, 21th century[edit]
2000s[edit]
- Flowcharting is a journey of discovery that makes visible what is actually happening. From this awareness comes alignment, motivation, transformation, plans, and action. The purpose of flowcharting is to create a shared understanding of the...
- Ian Johnson, Karen Scraba, Christine Degrow (2000). How to Lead and Still Have a Life: A Handbook for ... p. 95
- Flowcharting is a graphic way to represent steps in a process and relationships between departments or other divisions in an organization. It can be used to illustrate how a process currently works or to design an ideal process. Sometimes ...
- Edie L. Holcomb (2001) Asking the Right Questions: Techniques for Collaboration. p. 30
- Flowcharting is amongst the first graphical modelling techniques, dating back to the 1960s (Schriber 1969). The advantages of flowcharts centre on their ability to show the overall structure of a system, to trace the flow of information and work, to depict the physical media on which data are input, output and stored, and to highlight key processing and decision points (Jones 1986).
- Flowcharting was initially intended to provide computer program logic representation, but, due to its generic nature, it has been used in many other application areas as well, including business process modelling. Despite its advantages (namely familiarity and ease of use), flowcharting is no longer a dominant modelling technique because it can provide only basic facilities in representing processes. Therefore, flowcharts are nowadays typically used as a simple, graphic means of communication, intended to support narrative descriptions of processes when the latter become complicated and difficult to follow.
- Giaglis, George M. "A taxonomy of business process modeling and information systems modeling techniques." International Journal of Flexible Manufacturing Systems 13.2 (2001): 209-228.
- Having defined for baseline purposes what a process and a system are, now let's review what we can do to better understand these processes, these basic elements or components of an organization. There are a number of different ways we can analyze a process. The most common and one of the most useful forms is a graphic tool known as a process flow chart. This chart is a series of geometric figures — rectangles, diamonds, and circles or various other shapes — arranged typically from left to right, and from top to bottom, connected by lines with arrowheads to show the flow of activity from the beginning to the end of the process.
When a process is being created or an existing process is being analyzed, it is useful to create a process flow chart so that everyone involved, that is, all the stakeholders in the process, can see exactly what is supposed to happen from beginning to end without having to try to imagine it. Each of us may have a picture in our own mind, a graphical portrayal of what the process flow looks like, but the reality may be different. The only way we can be sure we understand that we havea common perspective or outlook on the process is by graphing it as a process flowchart, a linear or one-dimensional process flow chart. I say one dimensional to distinguish it from the two-dimensional graphic that we are going to talk about shortly, known as a process map.- Jack B. ReVelle. Manufacturing Handbook of Best Practices: An Innovation, Productivity, and Quality Focus. CRC Press, 26 dec. 2001. p. 228
- Step 5: Flowchart the Entire “Macro” Process (the “Is” Chart)3 Flowcharting is a key tool in NOAC. After this step, workers who have been involved with an administrative/business process for years are often amazed at how much they did not ...
- Keki R. Bhote (2003) Power of Ultimate Six Sigma: Keki Bhote's Proven ... p. 297
- Graphical presentation of the Flowcharts makes them picturesque, strikingly expressive, and vivid. Disadvantages of the Flowcharts are as follows: :* There exists a constant threat that they will become overly detailed, makmg the ...
- By linking activities, agents, artifacts, and audiences, systemigrams visually capture the dynamics of complex processes while maintaining the semantics of natural language.
- Dragan Z. Milosevic (2003). Project Management ToolBox: Tools and Techniques for the ...
- With the increasingly large number of software frameworks available to facilitate "business modeling", it is important to understand the implications of the level of abstraction provided by the frameworks. In this paper, we discuss three levels of abstraction of framework for business modeling, including the most typical and widely accepted representatives of each level. We show that XML is an emerging standard of data interchange and integration for business modeling. We discuss these frameworks in the context of database representation, which is important for storage and retrieval of models.
- K. Grigorova; P. Hristova; G. Atanasova; J. Q. Trelewicz. "Levels of Business Structures Representation," Published in: RJ10349 in 2005.
- Flowcharting is the most widely known approach to process mapping and has probably been used by everyone working in IVF labs at some time or another.
- David Mortimer, Sharon Tracey Mortimer (2005) Quality and Risk Management in the IVF Laboratory. p. 63
- Algorithm visualization systems and techniques have been introduced in a number of curricula to increase learner engagement and improve pedagogical processes [4, 6, 7, 8, 9, 12]. At the U.S. Military Academy (USMA), we teach a core IT course that is required for all first year students. While the emphasis of the course is on IT-enabled problem-solving, much of the content is dedicated to teaching students how to design an algorithm and then implement the design in Java. In this paper, we describe how the use of automated design tools has evolved over several semesters, resulting in the selection of a flowcharting tool that helps students become better programmers.
- Giordano, John C., and Martin Carlisle. "Toward a more effective visualization tool to teach novice programmers." Proceedings of the 7th conference on Information technology education. ACM, 2006.
- Flowcharting is a useful tool as it facilitates understanding and communication. It helps teams identify dangerous loops, redundancies, and incomplete instructions in the process. It also helps teams understand what the process looks like and ..
- Khosrow-Pour, Mehdi (2006) Cases on Information Technology and Business Process. p. 198
- Particularly, the addition of visual language constructs (data-flow/ flowchart) to conceptual programming allows the ...
- So, end users might often consider the conclusion of a defeasible logic theory incomprehensible and complex and, thus, a graphical trace and an explanation mechanism ...
- There are, however, a couple of major disadvantages, not only of digraphs but of graphs in general, as described in
- Fernando Ferri (2008) Visual Languages for Interactive Computing: Definitions ... p. 282
- The SWOT technique (Strength, Weakness, Opportunities and Threats) is a simple and straightforward way of describing processes in a strategic manner. Moreover ...
- Flowcharts are the most widely used technique to describe processes, particularly, the ones related to production operations. ... (1998) is a graphical language to visualize, specify, construct and document complex software logical blocs
- Blanca Martins, Dan Remenyi (2007) Proceedings of the 8th European Conference on Knowledge ... p. 36
- ...workings of the customer billing system: flowcharting is the recommended approach. Figure 11.7 in Chap. 11 gives an example of the development of a revenue protection program to assess and address apparent losses. As shown in this
- Julian Thornton, Reinhard Sturm, George Kunkel (2008) Water Loss Control. p. 246
- Flowcharting can be done at both the summary level or the detailed level serving different user needs. Flowcharting is a first step toward the documentation of a process required for ISO 9000 and other quality awards. In this way, problems can ...
- S. Rao Vallabhaneni (2008). Corporate Management, Governance, and Ethics Best Practices.
- Flowgraph. Program flowcharting is a time-honored quasigraphic technique for the documentation of program design. The flowchart shows program actions and their sequencing (control flow) at some conceptual level of abstraction chosen by ...
- Janusz Laski, William Stanley (2009) Software Verification and Analysis: An Integrated, ... p. 104
- Flowcharting Creating a 'map' of the operations of a process can be termed flowcharting. Flowcharting is a visual way of representing the flow of information through the system. G • Gamma Testing Gamma testing is generally done where ...
- Milind G. Limaye (2009). Software Testing. p. 505
2010s[edit]
- Flowcharting is a method of graphically describing a process (existing or proposed) by simple symbols and words to display the sequence of activities in the process. (For more information on flowcharting, see Book I of Waging the ...
- H. James Harrington, Frank Voehl (2011) The Organizational Alignment Handbook, p. 87
- ... Identifying the best places to collect data • Identifying subprocesses that could be outsourced to reduce costs Process mapping, or flowcharting, is a tool to help us understand a sequence of events through which a product or service travels.
- Joseph Jacobsen (2011) Sustainable Business and Industry: Designing and Operating ...
- Flowcharting is a procedure to graphically show the sequential flow of data and/or operations. The data and operations portrayed include document preparation, authorization, storage, and decision making. The more common flowcharting ...
- Patrick R. Delaney, O. Ray Whittington (2012) Wiley CPA Examination Review, Outlines and Study Guides.
- Flowcharting is the most useful technique for determining the flow of information.
- John R. Mariano (2012) The Internet Way: A Unifying Theory and Methodology for .... p. 15
- This means having a good understanding of what you want your robot or robot team to do first and then code the instructions in Java, NXT-G, LabVIEW, or C. If you're working with others, flowcharting is a language-neutral way to describe the ...
- Cameron Hughes, Tracey Hughes, Trevor Watkins (2013) Build Your Own Teams of Robots with LEGO® Mindstorms® NXT ...
- Whether the goal is to improve quality and/or decrease cost with increased efficiency of processes, flowcharting is a powerful process improvement tool for meeting that type of goal. Flowcharting is best accomplished by bringing together ...
- Rona Levin, Rona F. Levin, Harriet R. Feldman (2013) Teaching Evidence-Based Practice in Nursing.
- Flowcharting is the most effective way to describe how a process works now, how to fix it when it does not work, and how it is going to be improved in the future.
- S. Rao Vallabhaneni (2013) Wiley CIA Exam Review 2013, Part 1, Internal Audit Basics. p. 191
- Flowcharts are increasingly the focus now due to total quality management programs. Flowcharting is the most effective way to describe how a process works now, how to fix it when it does not work, and how it is going to be improved in the ...
- S. Rao Vallabhaneni (2015) Wiley CIAexcel Exam Review 2015, Part 1: Internal Audit Basics.
See also[edit]
Wikimedia Commons has media related to Flow chart.