From Wikipedia, the free encyclopedia
This is not a Wikipedia article : This is a workpage , a collection of material and work in progress that may or may not be incorporated into an article. It should not necessarily be considered factual or authoritative.
2008 United States presidential election Turnout 58.2% pp
This workpage details the results of the 2008 United States presidential election , which was the 56th quadrennial presidential election held on November 4, 2008. Democratic nominee Barack Obama , the junior Senator from Illinois , defeated Republican nominee John McCain , the senior Senator from Arizona .
Obama won a decisive victory over McCain, winning the Electoral College and the popular vote by a sizable margin, including states that had not voted for the Democratic presidential candidate since 1976 (North Carolina) and 1964 (Indiana and Virginia). Obama received the largest share of the popular vote won by a Democrat since Lyndon B. Johnson in 1964 and was the first Democrat to win an outright majority of the popular vote since Jimmy Carter in 1976. Obama's total count of 69.5 million votes stood as the largest tally ever won by a presidential candidate until 2020 , when this was surpassed by both major party candidates in a high-turnout election. He was the first Democrat to win without Arkansas and Missouri since those states joined the Union in 1836 and 1821 and the first Democrat to win the presidency without winning West Virginia since 1916 .
Obama flipped nine states that had voted Republican in 2004 : Colorado , Florida , Indiana , Iowa , Nevada , New Mexico , North Carolina , Ohio , and Virginia , as well as Nebraska's 2nd congressional district
Overview [ edit ]
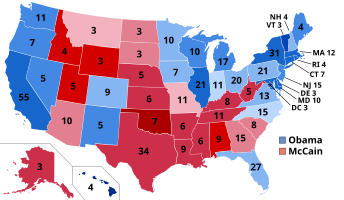
Presidential election results map. Blue denotes states won by Obama/Biden and red denotes those won by McCain/Palin. Numbers indicate electoral votes cast by each state and the District of Columbia.
Results by state, shaded according to winning candidate's margin of victory. Obama performed the best in the District of Columbia, while McCain performed the best in Oklahoma. The closest state was Missouri.
Results by county, shaded according to winning candidate's percentage of the vote.
Change in vote margins at the county level from the 2004 election to the 2008 election. Obama made dramatic gains in every region of the country except for Arizona, Appalachia, and the inner South, where McCain improved over Bush.
Results [ edit ]
↓
365
173
Barack Obama John McCain
Electoral results
Presidential candidate
Party
Home state
Popular vote
Electoral
Running mate
Count
Percentage
Vice-presidential candidate
Home state
Electoral vote
Barack Obama
Democratic
Illinois
69,498,516
52.93%
365
Joe Biden
Delaware
365
John McCain
Republican
Arizona
59,948,323
45.65%
173
Sarah Palin
Alaska
173
Ralph Nader
Independent
Connecticut
739,034
0.56%
0
Matt Gonzalez
California
0
Bob Barr
Libertarian
Georgia
523,715
0.40%
0
Wayne Allyn Root
Nevada
0
Chuck Baldwin
Constitution
Florida
199,750
0.15%
0
Darrell Castle
Tennessee
0
Cynthia McKinney
Green
Georgia
161,797
0.12%
0
Rosa Clemente
New York
0
Alan Keyes
American Independent
Maryland
47,746
0.04%
0
Wiley Drake
California
0
Ron Paul
Constitution
Texas
42,426
0.03%
0
Barry Goldwater Jr.
California
0
Gloria La Riva
Socialism and Liberation
California
6,818
0.01%
0
Eugene Puryear
District of Columbia
0
Other
145,695
0.11%
—
Other
—
Total
131,313,820
100%
538
538
Needed to win
270
270
Popular vote
Obama
52.93%
McCain
45.65%
Nader
0.56%
Others
0.86%
Electoral vote
Obama
67.84%
McCain
32.16%
Summary table [ edit ]
Barack Obama
John McCain
Ralph Nader
Bob Barr
Chuck Baldwin
Cynthia McKinney
Others
Margin
Margin
Total
Votes
%
Votes
%
Votes
%
Votes
%
Votes
%
Votes
%
Votes
%
Votes
%
%
Alabama
813,479
38.74%
–
1,266,546
60.32%
9
6,788
0.32%
–
4,991
0.24%
–
4,310
0.21%
–
–
–
–
3,705
0.18%
–
-453,067
-21.58%
4.04%
2,099,819
Alaska
123,594
37.89%
–
193,841
59.42%
3
3,783
1.16%
–
1,589
0.49%
–
1,660
0.51%
–
–
–
–
1,730
0.53%
–
-70,247
-21.53%
4.02%
326,197
Arizona
1,034,707
45.12%
–
1,230,111
53.64%
10
11,301
0.49%
–
12,555
0.55%
–
1,371
0.06%
–
3,406
0.15%
–
24
0.00%
–
-195,404
-8.52%
1.93%
2,293,475
Arkansas
422,310
38.86%
–
638,017
58.72%
6
12,882
1.19%
–
4,776
0.44%
–
4,023
0.37%
–
3,470
0.32%
–
1,139
0.10%
–
-215,707
-19.85%
-10.09%
1,086,617
California
8,274,473
61.01%
55
5,011,781
36.95%
–
108,381
0.80%
–
67,582
0.50%
–
3,145
0.02%
–
38,774
0.29%
–
57,764
0.43%
–
3,262,692
24.06%
14.11%
13,561,900
Colorado
1,288,633
53.66%
9
1,073,629
44.71%
–
13,352
0.56%
–
10,898
0.45%
–
6,233
0.26%
–
2,822
0.12%
–
5,895
0.24%
–
215,004
8.95%
13.62%
2,401,462
Connecticut
997,772
60.59%
7
629,428
38.22%
–
19,162
1.16%
–
–
–
–
311
0.02%
–
90
0.01%
–
34
0.00%
–
368,344
22.37%
12.00%
1,646,797
Delaware
255,459
61.94%
3
152,374
36.95%
–
2,401
0.58%
–
1,109
0.27%
–
626
0.15%
–
385
0.09%
–
58
0.01%
–
103,085
25.00%
17.41%
412,412
D.C.
245,800
92.46%
3
17,367
6.53%
–
958
0.36%
–
–
–
–
–
–
–
590
0.22%
–
1,138
0.43%
–
228,433
85.92%
6.08%
265,853
Florida
4,282,074
51.03%
27
4,045,624
48.22%
–
28,124
0.34%
–
17,218
0.21%
–
7,915
0.09%
–
2,887
0.03%
–
6,902
0.08%
–
236,450
2.82%
7.83%
8,390,744
Georgia
1,844,123
46.99%
–
2,048,759
52.20%
15
1,158
0.03%
–
28,731
0.73%
–
1,402
0.04%
–
250
0.01%
–
63
0.00%
–
-204,636
-5.21%
11.38%
3,924,486
Hawaii
325,871
71.85%
4
120,566
26.58%
–
3,825
0.84%
–
1,314
0.29%
–
1,013
0.22%
–
979
0.22%
–
–
–
–
205,305
45.26%
36.52%
453,568
Idaho
236,440
36.09%
–
403,012
61.52%
4
7,175
1.10%
–
3,658
0.56%
–
4,747
0.72%
–
39
0.01%
–
51
0.01%
–
-166,572
-25.43%
12.69%
655,122
Illinois
3,419,348
61.92%
21
2,031,179
36.78%
–
30,948
0.56%
–
19,642
0.36%
–
8,256
0.15%
–
11,838
0.21%
–
1,160
0.02%
–
1,388,169
25.14%
14.80%
5,522,371
Indiana
1,374,039
49.95%
11
1,345,648
48.91%
–
909
0.03%
–
29,257
1.06%
–
1,024
0.04%
–
87
0.00%
–
90
0.00%
–
28,391
1.03%
21.71%
2,751,054
Iowa
828,940
53.93%
7
682,379
44.39%
–
8,014
0.52%
–
4,590
0.30%
–
4,445
0.29%
–
1,423
0.09%
–
7,332
0.48%
–
146,561
9.53%
10.20%
1,537,123
Kansas
514,765
41.65%
–
699,655
56.61%
6
10,527
0.85%
–
6,706
0.54%
–
4,148
0.34%
–
35
0.00%
–
36
0.00%
–
-184,890
-14.96%
10.42%
1,235,872
Kentucky
751,985
41.17%
–
1,048,462
57.40%
8
15,378
0.84%
–
5,989
0.33%
–
4,694
0.26%
–
–
–
–
112
0.01%
–
-296,477
-16.23%
3.63%
1,826,620
Louisiana
782,989
39.93%
–
1,148,275
58.56%
9
6,997
0.36%
–
–
–
–
2,581
0.13%
–
9,187
0.47%
–
10,732
0.55%
–
-365,286
-18.63%
-4.12%
1,960,761
Maine
421,923
57.71%
4
295,273
40.38%
–
10,636
1.45%
–
251
0.03%
–
177
0.02%
–
2,900
0.40%
–
3
0.00%
–
126,650
17.32%
8.32%
731,163
Maryland
1,629,467
61.92%
10
959,862
36.47%
–
14,713
0.56%
–
9,842
0.37%
–
3,760
0.14%
–
4,747
0.18%
–
9,205
0.35%
–
669,605
25.44%
12.46%
2,631,596
Massachusetts
1,904,097
61.80%
12
1,108,854
35.99%
–
28,841
0.94%
–
13,189
0.43%
–
4,971
0.16%
–
6,550
0.21%
–
14,483
0.47%
–
795,243
25.81%
0.65%
3,080,985
Michigan
2,872,579
57.43%
17
2,048,639
40.96%
–
33,085
0.66%
–
23,716
0.47%
–
14,685
0.29%
–
8,892
0.18%
–
170
0.00%
–
823,940
16.47%
13.05%
5,001,766
Minnesota
1,573,354
54.06%
10
1,275,409
43.82%
–
30,152
1.04%
–
9,174
0.32%
–
6,787
0.23%
–
5,174
0.18%
–
10,319
0.35%
–
297,945
10.24%
6.76%
2,910,369
Mississippi
554,662
43.00%
–
724,597
56.18%
6
4,011
0.31%
–
2,529
0.20%
–
2,551
0.20%
–
1,034
0.08%
–
481
0.04%
–
-169,935
-13.17%
6.52%
1,289,865
Missouri
1,441,911
49.29%
–
1,445,814
49.43%
11
17,813
0.61%
–
11,386
0.39%
–
8,201
0.28%
–
80
0.00%
–
–
–
–
-3,903
-0.13%
7.07%
2,925,205
Montana
231,667
47.25%
–
242,763
49.51%
3
3,686
0.75%
–
1,355
0.28%
–
143
0.03%
–
23
0.00%
–
10,665
2.17%
–
-11,096
-2.26%
18.24%
490,302
Nebraska
333,319
41.60%
1
452,979
56.53%
4
5,406
0.67%
–
2,740
0.34%
–
2,972
0.37%
–
1,028
0.13%
–
2,837
0.35%
–
-119,660
-14.93%
18.29%
801,281
Nevada
533,736
55.15%
5
412,827
42.65%
–
6,150
0.64%
–
4,263
0.44%
–
3,194
0.33%
–
1,411
0.15%
–
6,267
0.65%
–
120,909
12.49%
15.08%
967,848
New Hampshire
384,826
54.13%
4
316,534
44.52%
–
3,503
0.49%
–
2,217
0.31%
–
226
0.03%
–
40
0.01%
–
3,624
0.51%
–
68,292
9.60%
8.23%
710,970
New Jersey
2,215,422
57.27%
15
1,613,207
41.70%
–
21,298
0.55%
–
8,441
0.22%
–
3,956
0.10%
–
3,636
0.09%
–
2,277
0.06%
–
602,215
15.57%
8.89%
3,868,237
New Mexico
472,422
56.91%
5
346,832
41.78%
–
5,327
0.64%
–
2,428
0.29%
–
1,597
0.19%
–
1,552
0.19%
–
–
–
–
125,590
15.13%
15.92%
830,158
New York
4,804,945
62.88%
31
2,752,771
36.03%
–
41,249
0.54%
–
19,596
0.26%
–
634
0.01%
–
12,801
0.17%
–
8,935
0.12%
–
2,052,174
26.86%
8.57%
7,640,931
North Carolina
2,142,651
49.70%
15
2,128,474
49.38%
–
1,448
0.03%
–
25,722
0.60%
–
–
–
–
158
0.00%
–
12,336
0.29%
–
14,177
0.33%
12.76%
4,310,789
North Dakota
141,278
44.62%
–
168,601
53.25%
3
4,189
1.32%
–
1,354
0.43%
–
1,199
0.38%
–
–
–
–
–
–
–
-27,323
-8.63%
18.73%
316,621
Ohio
2,940,044
51.50%
20
2,677,820
46.91%
–
42,337
0.74%
–
19,917
0.35%
–
12,565
0.22%
–
8,518
0.15%
–
7,149
0.12%
–
262,224
4.59%
6.70%
5,708,350
Oklahoma
502,496
34.35%
–
960,165
65.65%
7
–
–
–
–
–
–
–
–
–
–
–
–
–
–
–
-457,669
-31.29%
-0.15%
1,462,661
Oregon
1,037,291
56.75%
7
738,475
40.40%
–
18,614
1.02%
–
7,635
0.42%
–
7,693
0.42%
–
4,543
0.25%
–
13,613
0.74%
–
298,816
16.35%
12.19%
1,827,864
Pennsylvania
3,276,363
54.49%
21
2,655,885
44.17%
–
42,977
0.71%
–
19,912
0.33%
–
1,092
0.02%
–
–
–
–
17,043
0.28%
–
620,478
10.32%
7.82%
6,013,272
Rhode Island
296,571
62.86%
4
165,391
35.06%
–
4,829
1.02%
–
1,382
0.29%
–
675
0.14%
–
797
0.17%
–
2,121
0.45%
–
131,180
27.81%
7.06%
471,766
South Carolina
862,449
44.90%
–
1,034,896
53.87%
8
5,053
0.26%
–
7,283
0.38%
–
6,827
0.36%
–
4,461
0.23%
–
–
–
–
-172,447
-8.98%
8.10%
1,920,969
South Dakota
170,924
44.75%
–
203,054
53.16%
3
4,267
1.12%
–
1,835
0.48%
–
1,895
0.50%
–
–
–
–
–
–
–
-32,130
-8.41%
13.06%
381,975
Tennessee
1,087,437
41.83%
–
1,479,178
56.90%
11
11,560
0.44%
–
8,547
0.33%
–
8,191
0.32%
–
2,499
0.10%
–
2,337
0.09%
–
-391,741
-15.07%
-0.77%
2,599,749
Texas
3,528,633
43.68%
–
4,479,328
55.45%
34
5,751
0.07%
–
56,116
0.69%
–
5,708
0.07%
–
909
0.01%
–
1,350
0.02%
–
-950,695
-11.77%
11.09%
8,077,795
Utah
327,670
34.41%
–
596,030
62.58%
5
8,416
0.88%
–
6,966
0.73%
–
12,012
1.26%
–
982
0.10%
–
294
0.03%
–
-268,360
-28.18%
17.36%
952,370
Vermont
219,262
67.46%
3
98,974
30.45%
–
3,339
1.03%
–
1,067
0.33%
–
500
0.15%
–
66
0.02%
–
1,838
0.56%
–
120,288
37.01%
16.87%
325,046
Virginia
1,959,532
52.63%
13
1,725,005
46.33%
–
11,483
0.31%
–
11,067
0.30%
–
7,474
0.20%
–
2,344
0.06%
–
6,355
0.17%
–
234,527
6.30%
14.50%
3,723,260
Washington
1,750,848
57.65%
11
1,229,216
40.48%
–
29,489
0.97%
–
12,728
0.42%
–
9,432
0.31%
–
3,819
0.13%
–
1,346
0.04%
–
521,632
17.18%
10.01%
3,036,878
West Virginia
303,857
42.59%
–
397,466
55.71%
5
7,219
1.01%
–
–
–
–
2,465
0.35%
–
2,355
0.33%
–
89
0.01%
–
-93,609
-13.12%
-0.26%
713,451
Wisconsin
1,677,211
56.22%
10
1,262,393
42.31%
–
17,605
0.59%
–
8,858
0.30%
–
5,072
0.17%
–
4,216
0.14%
–
8,062
0.27%
–
414,818
13.90%
13.52%
2,983,417
Wyoming
82,868
32.54%
–
164,958
64.78%
3
2,525
0.99%
–
1,594
0.63%
–
1,192
0.47%
–
–
–
–
1,521
0.60%
–
-82,090
-32.23%
7.56%
254,658
Total
69,498,516
52.93%
365
59,948,323
45.65%
173
739,034
0.56%
–
523,715
0.40%
–
199,750
0.15%
–
161,797
0.12%
–
242,685
0.18%
–
9,550,193
7.27%
9.73%
131,313,820
Barack Obama
John McCain
Ralph Nader
Bob Barr
Chuck Baldwin
Cynthia McKinney
Others
Margin
Margin
Total
Close states [ edit ] States where the margin of victory was under 1% (26 electoral votes):
Missouri, 0.13% (3,903 votes) North Carolina, 0.33% (14,177 votes) States where the margin of victory was under 5% (61 electoral votes):
Indiana, 1.03% (28,391 votes) Montana, 2.26% (11,096 votes) Florida, 2.82% (236,450 votes) Ohio, 4.59% (262,224 votes) States where the margin of victory was under 10% (72 electoral votes):
Georgia, 5.21% (204,636 votes) Virginia, 6.30% (234,527 votes) South Dakota, 8.41% (32,130 votes) Arizona, 8.52% (195,404 votes) North Dakota, 8.63% (27,323 votes) Colorado, 8.95% (215,004 votes) South Carolina, 8.98% (172,447 votes) Iowa, 9.53% (146,561 votes) New Hampshire, 9.60% (68,292 votes) Results by state [ edit ] Alabama [ edit ] State results by county McCain: 40–50% 50–60% 60–70% 70–80% 80–90% Obama: 50–60% 60–70% 70–80% 80–90% Alaska results by borough and census area McCain: 40–50% 50–60% 60–70% 70–80% Obama: 40–50% 50–60% Flipped boroughs and census areas
Arizona [ edit ] Arizona results by county McCain: 50–60% 60–70% Obama: 50–60% 60–70% Arkansas [ edit ] Arkansas results by county McCain: 40–50% 50–60% 60–70% 70–80% Obama: 50–60% 60–70% Republican: Bradley , Clark , Clay , Hempstead , Jackson , Lawrence , Lincoln , Little River , Mississippi , Monroe , Poinsett , Randolph California [ edit ] California results by county Obama: 40–50% 50–60% 60–70% 70–80% 80–90% McCain: 50–60% 60–70% Democratic: Butte , Fresno , Merced , Nevada , Riverside , San Bernardino , San Diego , San Joaquin , San Luis Obispo , Stanislaus , Trinity , Ventura Colorado [ edit ] Colorado results by county Obama: 50–60% 60–70% 70–80% McCain: 40–50% 50–60% 60–70% 70–80% 80–90% Connecticut [ edit ] State results by county Delaware [ edit ] Delaware results by county Obama: 50–60% 60–70% McCain: 50–60% District of Columbia [ edit ] District of Columbia results by ward Florida [ edit ] Florida results by county Obama: 50–60% 60–70% McCain: 40–50% 50–60% 60–70% 70–80% 80–90% Georgia [ edit ] Georgia results by county McCain: 50–60% 60–70% 70–80% 80–90% Obama: 50–60% 60–70% 70–80% 80–90% Hawaii results by county Idaho results by county McCain: 50–60% 60–70% 70–80% 80–90% Obama: 40–50% 50–60% 60–70% Illinois [ edit ] Illinois results by county Obama: 40–50% 50–60% 60–70% 70–80% McCain: 40–50% 50–60% 60–70% Democratic: Boone , Bureau , Carroll , Cass , DeKalb , DuPage , Gallatin , Grundy , Henry , Jo Daviess , Kane , Kankakee , Kendall , La Salle , Lake , Macon , Macoupin , Mason , Montgomery , McDonough , McHenry , McLean , Sangamon , Schuyler , Stephenson , Vermilion , Warren , Will , Winnebago Indiana [ edit ] Indiana results by county Obama: 40–50% 50–60% 60–70% McCain: 40–50% 50–60% 60–70% Democratic: Delaware , Madison , Perry , Porter , Spencer , St. Joseph , Starke , Tippecanoe , Vanderburgh , Vermillion , Vigo Iowa results by county Obama: 40–50% 50–60% 60–70% McCain: 40–50% 50–60% 60–70% 70–80% 80–90% Democratic: Adams , Allamakee , Audubon , Bremer , Carroll , Cedar , Crawford , Delaware , Emmet , Franklin , Greene , Hamilton , Hardin , Iowa , Kossuth , Louisa , Marshall , Palo Alto , Union , Warren , Winnebago Kansas results by county McCain: 40–50% 50–60% 60–70% 70–80% 80–90% Obama: 40–50% 60–70% Kentucky [ edit ] Kentucky results by county McCain: 40–50% 50–60% 60–70% 70–80% 80–90% Obama: 40–50% 50–60% 60–70% Louisiana [ edit ] Louisiana results by parish McCain: 50–60% 60–70% 70–80% 80–90% Obama: 50–60% 60–70% 70–80% Maine results by county Obama: 40–50% 50–60% 60–70% McCain: 50–60% Maryland [ edit ] Maryland results by county Obama: 40–50% 50–60% 60–70% 70–80% 80–90% McCain: 40–50% 50–60% 60–70% Massachusetts [ edit ] Massachusetts results by county Obama: 50–60% 60–70% 70–80% Michigan [ edit ] Michigan results by county Obama: 40–50% 50–60% 60–70% 70–80% McCain: 40–50% 50–60% 60–70% Democratic: Alpena , Benzie , Berrien , Calhoun , Cass , Clare , Clinton , Delta , Eaton , Gladwin , Gratiot , Iosco , Iron , Jackson , Kent , Leelanau , Lenawee , Macomb , Manistee , Mason , Menominee , Monroe , Oceana , Ogemaw , Ontonagon , Presque Isle , Roscommon , Schoolcraft , Shiawassee , St. Clair , Van Buren Minnesota [ edit ] Minnesota results by county Obama: 40–50% 50–60% 60–70% McCain: 40–50% 50–60% Mississippi [ edit ] Mississippi results by county McCain: 50–60% 60–70% 70–80% 80–90% Obama: 40–50% 50–60% 60–70% 70–80% 80–90% Missouri [ edit ] Missouri results by county McCain: 40–50% 50–60% 60–70% 70–80% Obama: 40–50% 50–60% 60–70% 80–90% Montana [ edit ] Montana results by county McCain: 40–50% 50–60% 60–70% 70–80% 80–90% Obama: 40–50% 50–60% 60–70% Nebraska [ edit ] Nebraska results by county McCain: 50–60% 60–70% 70–80% 80–90% Obama: 50–60% Nevada results by county Obama: 40–50% 50–60% McCain: 40–50% 50–60% 60–70% 70–80% New Hampshire [ edit ] New Hampshire results by county Obama: 40–50% 50–60% 60–70% New Jersey [ edit ] New Jersey results by county Obama: 50–60% 60–70% 70–80% McCain: 50–60% New Mexico [ edit ] State results by county Obama: 50–60% 60–70% 70–80% 80–90% McCain: 50-60% 60-70% 70-80% New York [ edit ] New York results by county Obama: 40–50% 50–60% 60–70% 70–80% 80–90% McCain: 40–50% 50–60% 60–70% Democratic: Cayuga , Cortland , Dutchess , Essex , Madison , Orange , Oswego , Otsego , Rockland , Saratoga , Seneca , Sullivan , Warren , Washington North Carolina [ edit ] North Carolina results by county Obama: 50–60% 60–70% 70–80% McCain: 40–50% 50–60% 60–70% 70–80% Democratic: Bladen , Buncombe , Caswell , Cumberland , Forsyth , Granville , Hyde , Jackson , Martin , Pitt , Wake , Watauga , Wilson North Dakota [ edit ] Oklahoma [ edit ] Oklahoma results by county McCain: 50–60% 60–70% 70–80% 80–90% Pennsylvania [ edit ] Rhode Island [ edit ] Rhode Island results by county South Carolina [ edit ] South Dakota [ edit ] Tennessee [ edit ] Vermont [ edit ] Vermont results by county Obama: 50–60% 60–70% 70–80% Virginia [ edit ] Washington [ edit ] West Virginia [ edit ] Wisconsin [ edit ] Wyoming [ edit ]
See also [ edit ] References [ edit ]
U.S. U.S. Senate U.S. House (election ) Governors Attorneys State State officials Mayors
Augusta, GA Bakersfield, CA Baton Rouge, LA Fresno, CA Honolulu, HI Irvine, CA Mesa, AZ Milwaukee, WI Orlando, FL Portland, OR Sacramento, CA San Diego, CA San Juan, PR Santa Ana, CA Scottsdale, AZ Stockton, CA Virginia Beach, VA States


 Results by state, shaded according to winning candidate's margin of victory. Obama performed the best in the District of Columbia, while McCain performed the best in Oklahoma. The closest state was Missouri.
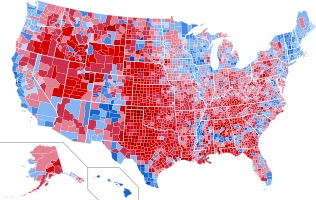 Results by county, shaded according to winning candidate's percentage of the vote.
 Change in vote margins at the county level from the 2004 election to the 2008 election. Obama made dramatic gains in every region of the country except for Arizona, Appalachia, and the inner South, where McCain improved over Bush.


