User:Bimbopoldo305/sandbox
| |||||||||||||||||||||||||||||||||||||||||||||||||||||||||||||||||||||||||||||
All 630 seats in the Chamber of Deputies · 315 seats in the Senate | |||||||||||||||||||||||||||||||||||||||||||||||||||||||||||||||||||||||||||||
|---|---|---|---|---|---|---|---|---|---|---|---|---|---|---|---|---|---|---|---|---|---|---|---|---|---|---|---|---|---|---|---|---|---|---|---|---|---|---|---|---|---|---|---|---|---|---|---|---|---|---|---|---|---|---|---|---|---|---|---|---|---|---|---|---|---|---|---|---|---|---|---|---|---|---|---|---|---|
| Registered | 48,744,846 (C) · 42,889,825 (S) | ||||||||||||||||||||||||||||||||||||||||||||||||||||||||||||||||||||||||||||
| Turnout | 40,401,774 (C) · 82.9% ( 35,260,803 (S) · 82.2% ( | ||||||||||||||||||||||||||||||||||||||||||||||||||||||||||||||||||||||||||||
| |||||||||||||||||||||||||||||||||||||||||||||||||||||||||||||||||||||||||||||
| |||||||||||||||||||||||||||||||||||||||||||||||||||||||||||||||||||||||||||||
i
The Times They Are A-Changin' 1-Italy[edit]
| |||||||||||||||||||||||||||||||||||||||||||||||||||||||||||||||||||||||||||||||||||||
All 630 seats in the Chamber of Deputies 316 seats needed for a majority | |||||||||||||||||||||||||||||||||||||||||||||||||||||||||||||||||||||||||||||||||||||
|---|---|---|---|---|---|---|---|---|---|---|---|---|---|---|---|---|---|---|---|---|---|---|---|---|---|---|---|---|---|---|---|---|---|---|---|---|---|---|---|---|---|---|---|---|---|---|---|---|---|---|---|---|---|---|---|---|---|---|---|---|---|---|---|---|---|---|---|---|---|---|---|---|---|---|---|---|---|---|---|---|---|---|---|---|---|
| Registered | 40,426,658 (C) | ||||||||||||||||||||||||||||||||||||||||||||||||||||||||||||||||||||||||||||||||||||
| Turnout | 37,022,882 (C) · 91.6% ( | ||||||||||||||||||||||||||||||||||||||||||||||||||||||||||||||||||||||||||||||||||||
| |||||||||||||||||||||||||||||||||||||||||||||||||||||||||||||||||||||||||||||||||||||
 Results of the election in the Chamber and Senate. | |||||||||||||||||||||||||||||||||||||||||||||||||||||||||||||||||||||||||||||||||||||
| |||||||||||||||||||||||||||||||||||||||||||||||||||||||||||||||||||||||||||||||||||||
a
a
a
a
a
a
a
a
a
a
a
a
a
a
a
a
a
a
a
a
a
a
a
a
aa
a
a
a
a
a
a
aaa
a
a
a
a
a
a
a
a
a
a
a
a
a
a
a
a
a
a
a
a
a
a
aa
a
a
a
a
a
a
a
a
a
aaaaa
a
a
a
a
a
Chamber of Deputies[edit]
 | |||||
|---|---|---|---|---|---|
| Party | Votes | % | Seats | +/– | |
| Christian Democracy | 13,129,750 | 36.50 | 249 | −17 | |
| Italian Communist Party | 12,317,205 | 34.24 | 225 | +46 | |
| Italian Socialist Party | 4,071,016 | 11.32 | 68 | +7 | |
| Italian Social Movement | 2,241,871 | 6.23 | 36 | −20 | |
| Italian Democratic Socialist Party | 1,230,937 | 3.42 | 16 | −13 | |
| Italian Republican Party | 1,136,291 | 3.16 | 15 | 0 | |
| Italian Liberal Party | 598,814 | 1.66 | 7 | −13 | |
| Proletarian Democracy | 553,584 | 1.54 | 6 | New | |
| Radical Party | 398,763 | 1.11 | 4 | New | |
| South Tyrolean People's Party | 184,375 | 0.51 | 3 | 0 | |
| PCI–PSI–PdUP | 26,748 | 0.07 | 1 | +1 | |
| Others | 86,014 | 0.24 | 0 | -1 | |
| Total | 35,975,368 | 100.00 | 630 | 0 | |
| Valid votes | 35,975,368 | 97.17 | |||
| Invalid/blank votes | 1,047,512 | 2.83 | |||
| Total votes | 37,022,880 | 100.00 | |||
| Registered voters/turnout | 40,426,658 | 91.58 | |||
| Source: Ministry of the Interior | |||||
Composition[edit]
The Times They Are A-Changin' 2-France[edit]
| ||||||||||||||||
| ||||||||||||||||
| ||||||||||||||||
a a
a
a
a
a
a
a
a
a
a
a
a
a a a
a a
a
a
a
a
a a a a a
a
a
| Candidate | Party | First round | Second round | |||
|---|---|---|---|---|---|---|
| Votes | % | Votes | % | |||
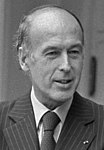
| François Mitterrand | Socialist Party | 11,497,356 | 45.00 | 13,221,604 | 50.14 | |
| Valéry Giscard d'Estaing | National Federation of the Independent Republicans | 8,016,427 | 31.38 | 13,146,203 | 49.86 | |
| Jacques Chaban-Delmas | Union of Democrats for the Republic | 3,745,578 | 14.66 | |||
| Jean Royer | Independent right-wing conservative | 809,540 | 3.17 | |||
| Arlette Laguiller | Workers' Struggle | 592,317 | 2.32 | |||
| René Dumont | Independent environmentalist | 334,824 | 1.31 | |||
| Jean-Marie Le Pen | National Front | 190,921 | 0.75 | |||
| Émile Muller | Democratic Socialist Movement | 162,079 | 0.63 | |||
| Alain Krivine | Revolutionary Communist Front | 93,990 | 0.37 | |||
| Bertrand Renouvin | New French Action | 43,722 | 0.17 | |||
| Jean-Claude Sebag | European Federalist Movement | 42,007 | 0.16 | |||
| Guy Héraud | European federalist | 19,255 | 0.08 | |||
| Total | 25,548,016 | 100.00 | 26,367,807 | 100.00 | ||
| Valid votes | 25,548,016 | 99.16 | 26,367,807 | 98.70 | ||
| Invalid/blank votes | 217,107 | 0.84 | 346,788 | 1.30 | ||
| Total votes | 25,765,123 | 100.00 | 26,714,595 | 100.00 | ||
| Registered voters/turnout | 30,602,953 | 84.19 | 30,600,775 | 87.30 | ||
| Source: Constitutional Court, Constitutional Court | ||||||
Results[edit]
| |||||||||||||||||||||||||||||||||||||||||||||||||||||||||||
All 491 seats to the French National Assembly 246 seats were needed for a majority | |||||||||||||||||||||||||||||||||||||||||||||||||||||||||||
|---|---|---|---|---|---|---|---|---|---|---|---|---|---|---|---|---|---|---|---|---|---|---|---|---|---|---|---|---|---|---|---|---|---|---|---|---|---|---|---|---|---|---|---|---|---|---|---|---|---|---|---|---|---|---|---|---|---|---|---|
| Turnout | 80.9% ( 85.9% ( | ||||||||||||||||||||||||||||||||||||||||||||||||||||||||||
| |||||||||||||||||||||||||||||||||||||||||||||||||||||||||||
* Including Miscellaneous Right | |||||||||||||||||||||||||||||||||||||||||||||||||||||||||||
| |||||||||||||||||||||||||||||||||||||||||||||||||||||||||||

| Parties and coalitions | 1st round | 2nd round | Total seats | ||||
|---|---|---|---|---|---|---|---|
| Votes | % | Votes | % | ||||
| French Communist Party (Parti communiste français) | PCF | 5,878,378 | 23.76 | 5,051,384 | 20.57 | 103 | |
| Socialist Party (Parti socialiste) | PS | 5,225,748 | 21.12 | 7,132,947 | 29.05 | 141 | |
| Movement of Left Radicals (Mouvement des radicaux de gauche) | MRG | 574,631 | 2.32 | 322,538 | 1.31 | 10 | |
| Unified Socialist Party (Parti socialiste unifié) | PSU | 550,873 | 2.23 | 191,389 | 0.78 | 5 | |
| Miscellaneous Left | DVG | 239,761 | 0.97 | 157,156 | 0.64 | 3 | |
| Total "Union of The Left" | 12,469,391 | 50.39 | 12,855,414 | 52.35 | 262 | ||
| Union of Democrats for the Republic (Union des démocrates pour la République) | UDR | 6,141,066 | 24.82 | 4,985,412 | 20.30 | 98 | |
| Democratic Coalition of Independent Republicans (Coalition démocratique des républicains indépendants) - Miscellaneous Right | CDRI-DVD | 5,671,682 | 22.92 | 6,697,483 | 27.27 | 126 CDRI 4 DVD | |
| Far-Left | EXG | 283,697 | 1.15 | - | - | - | |
| Far-right | EXD | 117,283 | 0.47 | - | - | - | |
| Miscellaneous | DIV | 62,453 | 0.25 | 17,824 | 0.07 | 1 | |
| Total | 24,745,572 | 100.00 | 24,556,133 | 100.00 | 491 | ||
| Abstention: 19.15% (1st round); 14.07% (2nd round) | |||||||
Results[edit]
| |||||||||||||||||||||||||||||||||||||||||||||||||||||||||||||||||||||||||||||||||||||
All 511 seats in the House of Representatives 256 seats needed for a majority | |||||||||||||||||||||||||||||||||||||||||||||||||||||||||||||||||||||||||||||||||||||
|---|---|---|---|---|---|---|---|---|---|---|---|---|---|---|---|---|---|---|---|---|---|---|---|---|---|---|---|---|---|---|---|---|---|---|---|---|---|---|---|---|---|---|---|---|---|---|---|---|---|---|---|---|---|---|---|---|---|---|---|---|---|---|---|---|---|---|---|---|---|---|---|---|---|---|---|---|---|---|---|---|---|---|---|---|---|
| Turnout | 76.32% ( | ||||||||||||||||||||||||||||||||||||||||||||||||||||||||||||||||||||||||||||||||||||
| |||||||||||||||||||||||||||||||||||||||||||||||||||||||||||||||||||||||||||||||||||||
* As candidate for Premiership | |||||||||||||||||||||||||||||||||||||||||||||||||||||||||||||||||||||||||||||||||||||
| |||||||||||||||||||||||||||||||||||||||||||||||||||||||||||||||||||||||||||||||||||||
 | |||||
|---|---|---|---|---|---|
| Party | Votes | % | Seats | +/– | |
| Liberal Democratic Party | 21,799,683 | 37.04 | 202 | –69 | |
| Japan Socialist Party | 16,178,620 | 27.49 | 161 | +43 | |
| Komeitō | 6,172,342 | 10.49 | 56 | +27 | |
| Japanese Communist Party | 6,012,472 | 10.22 | 28 | –10 | |
| Democratic Socialist Party | 3,288,189 | 5.59 | 30 | +11 | |
| New Liberal Club | 2,133,915 | 3.63 | 15 | New | |
| Other parties | 45,019 | 0.08 | 0 | –2 | |
| Independents | 3,219,238 | 5.47 | 19 | +5 | |
| Total | 58,849,478 | 100.00 | 511 | +20 | |
| Valid votes | 58,849,478 | 98.95 | |||
| Invalid/blank votes | 622,174 | 1.05 | |||
| Total votes | 59,471,652 | 100.00 | |||
| Registered voters/turnout | 77,926,588 | 76.32 | |||
| Source: Statistics Bureau of Japan | |||||
Results[edit]
| ||||||||||||||||||||||||||||||||||||||||||||||||||||||||||||
All 150 seats in the House of Representatives 76 seats needed for a majority | ||||||||||||||||||||||||||||||||||||||||||||||||||||||||||||
| Turnout | 89.5% ( | |||||||||||||||||||||||||||||||||||||||||||||||||||||||||||
|---|---|---|---|---|---|---|---|---|---|---|---|---|---|---|---|---|---|---|---|---|---|---|---|---|---|---|---|---|---|---|---|---|---|---|---|---|---|---|---|---|---|---|---|---|---|---|---|---|---|---|---|---|---|---|---|---|---|---|---|---|
This lists parties that won seats. See the complete results below.
| ||||||||||||||||||||||||||||||||||||||||||||||||||||||||||||
 | |||||
|---|---|---|---|---|---|
| Party | Votes | % | Seats | +/– | |
| Christian Democratic Appeal | 2,916,316 | 34.51 | 54 | +6 | |
| Labour Party | 1,712,900 | 20.27 | 31 | -12 | |
| Communist Party of the Netherlands | 1,568,382 | 18.56 | 29 | +22 | |
| Free People's Democratic Union | 998,118 | 11.81 | 18 | -10 | |
| Democrats 66 | 445,379 | 5.27 | 8 | +2 | |
| Reformed Political Party | 229,434 | 2.71 | 4 | +1 | |
| Political Party of Radicals | 140,910 | 1.67 | 2 | –5 | |
| Pacifist Socialist Party | 120,507 | 1.43 | 2 | 0 | |
| Farmers' Party | 98,492 | 1.17 | 1 | –2 | |
| Reformed Political League | 68,155 | 0.81 | 1 | –1 | |
| Reformatory Political Federation | 53,752 | 0.64 | 0 | New | |
| Dutch People's Union | 34,132 | 0.40 | 0 | New | |
| Roman Catholic Party of the Netherlands | 32,927 | 0.39 | 0 | –1 | |
| Socialist Party | 18,426 | 0.22 | 0 | New | |
| Federation of Elderly Parties of the Netherlands | 4,379 | 0.05 | 0 | New | |
| Union Against Arbitrariness of Civil Servants | 4,110 | 0.05 | 0 | New | |
| Communist Unity Movement of the Netherlands | 2,649 | 0.03 | 0 | New | |
| Democratic Action Centre | 2,150 | 0.03 | 0 | New | |
| Party of the Taxpayers | 201 | 0.00 | 0 | New | |
| European Conservative Union | 197 | 0.00 | 0 | New | |
| Jusia List | 91 | 0.00 | 0 | New | |
| Dutch Middle Class Party | 89 | 0.00 | 0 | 0 | |
| Griek List | 67 | 0.00 | 0 | New | |
| Total | 8,451,763 | 100.00 | 150 | 0 | |
| Valid votes | 8,451,763 | 99.43 | |||
| Invalid/blank votes | 48,376 | 0.57 | |||
| Total votes | 8,500,139 | 100.00 | |||
| Registered voters/turnout | 9,497,999 | 89.49 | |||
| Source: Kiesraad | |||||
Russia - the good ending?[edit]
| ||||||||||||||||||||
| Opinion polls | ||||||||||||||||||||
| Turnout | 76.49% | |||||||||||||||||||
|---|---|---|---|---|---|---|---|---|---|---|---|---|---|---|---|---|---|---|---|---|
| ||||||||||||||||||||
* Second round only | ||||||||||||||||||||
| ||||||||||||||||||||
| Candidate | Party | First round | Second round | |||
|---|---|---|---|---|---|---|
| Votes | % | Votes | % | |||
| Vladimir Putin | Independent | 32,306,222 | 43.44 | 39,989,879 | 48.23 | |
| Yevgeny Primakov | Independent | 24,162,734 | 32.49 | 40,470,785 | 48.81 | |
| Aman Tuleyev | Independent | 8,165,799 | 10.98 | |||
| Grigory Yavlinsky | Yabloko | 3,606,933 | 4.85 | |||
| Vladimir Zhirinovsky | Liberal Democratic Party | 2,022,857 | 2.72 | |||
| Konstantin Titov[a] | Independent | 1,104,109 | 1.48 | |||
| Ella Pamfilova | For Civic Dignity | 757,571 | 1.02 | |||
| Stanislav Govorukhin | Independent | 329,254 | 0.44 | |||
| Yury Skuratov | Independent | 319,593 | 0.43 | |||
| Alexey Podberezkin | Spiritual Heritage | 98,156 | 0.13 | |||
| Umar Dzhabrailov | Power of Reason | 78,501 | 0.11 | |||
| Against all | 1,413,025 | 1.90 | 2,454,282 | 2.96 | ||
| Total | 74,364,754 | 100.00 | 82,914,946 | 100.00 | ||
| Valid votes | 74,364,754 | 99.07 | 82,914,946 | 99.06 | ||
| Invalid/blank votes | 699,976 | 0.93 | 783,912 | 0.94 | ||
| Total votes | 75,064,730 | 100.00 | 83,698,858 | 100.00 | ||
| Registered voters/turnout | 109,372,043 | 68.63 | 109,426,147 | 76.49 | ||
| Source: Nohlen & Stöver,[2] Colton,[3] CEC | ||||||
- ^ 2000 Presidential elections Archived 2013-07-04 at the Wayback Machine University of Essex
- ^ Nohlen, D; Stöver, P (2010). Elections in Europe: A data handbook. p. 1642. ISBN 978-3-8329-5609-7.
- ^ Timothy J. Colton (2000). Transitional Citizens: Voters and What Influences Them in the New Russia. pp. 234–5. ISBN 9780674029804.
{{cite book}}:|work=ignored (help)
Cite error: There are <ref group=lower-alpha> tags or {{efn}} templates on this page, but the references will not show without a {{reflist|group=lower-alpha}} template or {{notelist}} template (see the help page).


