
Talk:Multibrot set
| This article is rated Start-class on Wikipedia's content assessment scale. It is of interest to the following WikiProjects: | |||||||||||
| |||||||||||

The following discussion was originally at Talk:Mandelbrot_set
Image of a mandelbrot generalization[edit]
Hi there Cuddlyable3, I would appreciate it if you would check this out a bit before revoking the edit, although it may not look like your standard mandelbrot fractal, this is a quite standard image of a generalized mandelbrot fractal. I have placed it in the generalizations section for good reason - this is a mandelbrot with power = (-1.0,0).

Please give a better reason for removing it other than 'this appears to be'. Danwills (talk) 14:55, 9 June 2008 (UTC)
- This image is not notable in any way. It is not a useful illustration of anything in the article. Why was this function and this location and this magnification chosen ? What colouring algorithm has been used ? What exactly is the reader meant to learn by looking at this image ? We could fill pages with such random pretty pictures. I agree with User:Cuddlyable3 - it should be removed. Gandalf61 (talk) 15:13, 9 June 2008 (UTC)
- I have added this image as a basic example of the types of things you see when you explore the generalized mandelbrot formula, the video in this section only shows the positive powers, and only colors the points outside the lake, I added this image because it uses a negative exponent, and colors the inside of the lake, there were no other examples of this in the article.
- The image is not a composite, and the coloring method is standard "exponential smoothing", if you try it yourself you'll easily be able to reproduce it.
- I didn't upload it just to add another pretty picture, (I have plenty of more complicated renderings of things like this) but to show how the generalized mandelbrot formula is capable of generating images that are very different to the standard mandelbrot image, that is what makes it notable. Danwills (talk) 22:56, 9 June 2008 (UTC)
- It's still a random pretty picture. It tells the reader nothing, and it has probably been massaged in various ways to make it look interesting. For example, can you explain exactly how z(-1.5) is calculated when producing this image ? Since zq is a multivalued function for non-integer q, there must be some choice of one root rather than another going on somewhere in this process. This arbitary choice is probably what leads to the straight lines and angles that we see in the image. I imagine these patterns change if you change your bailout value. If so, then they are an artefact of the processing, not a natural part of the fractal. Gandalf61 (talk) 08:48, 10 June 2008 (UTC)
- Gandalf61, thanks again your rigor! I assure you that I haven't massaged any settings or done anything tricky here. I initially thought as you do - that this may have been a rendering artifact - but I am now quite sure that that is not the case. Changing the bailout in fact does not alter the structure, it is quite stable, and is still apparent even when using different coloring methods. Changing the number of iterations of course has a significant effect, but even then the structure does not vary wildly, but rather changes in the same way that a (2.0, 0) power setting varies as iteration number is varied: more iterations resolves finer details, and vice versa. What this image tells the reader, is that there is more to the dynamics of the mandelbrot formula than what is apparent for power=(2.0, 0), that in fact the dynamics are quite well behaved for the standard setting, compared to the dynamics that result from using negative (real) exponent settings. Danwills (talk) 12:30, 10 June 2008 (UTC)
- Danwills thank you for bringing your image to Talk. I don't doubt that we could obtain the image that you obtained, using your software and your settings. While I don't call (-1.5,0) a complex power the subject of extending Mandelbrot's set to complex or negative powers is interesting, and I think it is worth some SOURCED explanation possibly supported by truly explanatory images. One might show the whole lake, and there is no good reason to quote coordinates with a precision quite incomensurate with the magnification. As you see, there is no consensus to add your image to the Mandelbrot Set page, which is already well loaded with images that Benoit Mandelbrot himself could be expected to endorse. Do look at Fractal art and WP:OR.Cuddlyable3 (talk) 09:52, 10 June 2008 (UTC)
- Hi Cuddlyable3, I agree that this image is perhaps not the best way to illustrate the generalization of the Mandelbrot fractal formula, I will take it over to the Fractal art article. I also agree that a whole-lake rendering would be better, so I have swapped the image for a zoom out (of the same settings) that shows the entire fractal. Would you accept this as a valid example instead? You have a point about the power not being complex, since there is no imaginary part the power may really only be said to be negative, but isn't it still relevant that the value for the imaginary part of the power is zero? I'm ok with either way of describing it. Thanks for your comments! Danwills (talk) 12:30, 10 June 2008 (UTC)
- Danwills your latest image is indeed interesting and I shall let it stand for now. Well done!
- Can you help explain the math behind the image i.e. what are the axes (as we show in the "mathematician's depiction" of the basic MS) ? Is this a case of iterating
- for d < 0 ?
- (I hope you will excuse my previous reverts and my qualification "for now". This is because I don't yet see a clearly defined Mandelbrot set or how far a "generalisation" (negative? complex?) may take us. A new page may evolve for this subject, if we pin down exactly what we are describing Cuddlyable3 (talk) 18:50, 10 June 2008 (UTC)

- This [1] implies 0>d>(-2) does not give a fractal. Cuddlyable3 (talk) 18:36, 11 June 2008 (UTC)
- I think I can understand a bit about why the formula might be thought not to be a fractal under these settings, for one, all the orbits appear to be convergent, and even despite that fact, the boundary of the 'pseudo-lake' that forms is not very complex for 0>d>(-2) - it's mostly a fairly smooth triangular shape. However, the dynamics inside the lake are certainly interesting, and rather self-similar (upon closer inspection) for these power settings. There is an exception to this for d=(-1), which seems to be a discontinuity that makes the formula break down completely. I'm sure there's an obvious mathematical reason for that, but I have not looked into exactly why it would be.
 | There is a striking similarity between these images submitted by Danwills. Cuddlyable3 (talk) 11:42, 14 June 2008 (UTC) |  |
Wow, that is quite interesting Cuddlyable3, I had not even compared those two images myself! The similarity is certainly striking! This is particularly strange because one is a modified Newton (the Nova fractal, with real relaxation increased) and the other is a negative-power Mandelbrot (I'll send you the UPR's if you want to verify this for yourself?). I looked into stretching out the negMandel to better fit the shape of the nova, but it didn't seem to elucidate very much really :\. I think that perhaps some of the similarity is partially coming from the fact that they both have stripes from the gradient repeating, and that this happens in the same areas of the plane, minus a contraction in the mandelbrot case, but I am a bit out of depth in terms of actually analyzing how the orbit dynamics could be similar, I might look into it a bit and let you know what I see :).

I noticed that the image has been taken off the main article again, is this because you would like to resolve this discussion first? I am happy with that, I'd just like to know what's happening. Can you think of any other images that would make valid additions to the page? I would be happy to run any renders you would like to see.
I asked about the multivalued issue that Gandalf61 raised (which I agree is an interesting side problem to whether this image is notable), on the UltraFractal mailing list, and the author of the Nova formula, Damien M Jones, gave me a good non-technical response:
my question was:
- I wonder if anyone can help to answer the question that gandalf61 asked here, of whether the discontinuities in a neg-mandel like this are coming from sensitive selection of one root over another by the formula?
the response from Damien:
- It's a valid question, because as gandalf61 pointed out, the log function for complex values is multivalued. If you think about complex numbers in polar coordinates rather than rectangular coordinates, it's easier to see. Most implementations I've seen (including the one in UF) take the "simplest" log. The actual full multi-valued log function is like a crazy piece of spiral pasta centered at the origin, sticking straight out of the plane; we cut a small section of that pasta so that when we look straight down at the plane, none of the pasta overlaps itself. We choose the piece that's actually touching the origin and has equal amounts above and below it. Choosing any other part of the pasta is "valid" and will produce different fractals; Jim Muth over on the FractInt list has done some exploring with formulas that adjust the "cut" and found some interesting results.
- In a sense UF's choice is "arbitrary" but it's arbitrary in the same way that we restrict the range of the arcsine function to the "simple" -pi/2 <= asin(n) <= pi/2 even though there are other "valid" results. And since this is the "most natural" place to make the cut, most implementations make it in the same place. Arguing that it's an artifact is incorrect because similar details exist regardless of where the actual cut is.
I understand what Damien is saying here and I think it makes it clear that the negMandel image is not just a rendering artifact. You have to resolve the multivalued problem somehow, and this is the most common way of doing it. I could imagine a rendering solution that takes the other solutions into account, but I have never seen anything like that in fractal rendering software yet.
- Our interpretation of WP:V policy must be to provide definitive information that enables any suitably skilled person to understand and duplicate these plots. Danwills if you are using software that you did not write then it may be difficult to meet those criteria using hearsay. Please inspect the plots and pseudocode that I have added to the article for positive and negative real integer powers of the complex variable, which do not seem problematic.
- Difficulty arises with fractional i.e. non-integral real powers, such as -1.5 that you have presented, because of the discontinuity of roots of a complex number. Does your superposition of the classic Mandelbrot set (rotated so the imaginary axis points sideways ! ) mean that your triangular figure is plotted on identical axes ? I must ask because you use the word "adjusted". Your correspondent Damien has, I think, illustrated the problem more than the implementation of a solution.Cuddlyable3 (talk) 15:48, 20 June 2008 (UTC)
Generalising to complex power[edit]
If we are to generalise Mandelbrot's iteration to powers that are complex numbers, which I don't see done yet, then can someone please clarify the actual coding ? I suppose one defines, for complex a and b, the general complex power ab of a nonzero complex number a as
- .

I see that a can be in polar form () so


and thus

If b is decomposed as c + di, then it seems the formula for ab can be written more explicitly as
![{\displaystyle \left(r^{c}e^{-d\theta }\right)e^{i(d\log r+c\theta )}=\left(r^{c}e^{-d\theta }\right)\left[\cos(d\log r+c\theta )+i\sin(d\log r+c\theta )\right].}](https://wikimedia.org/api/rest_v1/media/math/render/svg/e82ef3ebfb202936422ac0011f1d31ec904279c5)
Is there an expert reading this who can put the above into practical software code? Cuddlyable3 (talk) 11:42, 11 June 2008 (UTC)
- Problem here is that the complex logarithm "function" is not single valued; log(a) is a set of complex numbers that differ by multiples of 2πi. If b is an integer power then this does not matter because blog(a) is another set of values that differ by multiples of 2πi, and so exp(b log(a)) has a single value, which we define to be ab. But if b is not an integer then ab is not single valued (simple example is 1½ has two values; +1 or −1). If we select one value rather than another then we are introducing an arbitrary branch cut into the function, and ab then takes on very different values for values of a that are close to one another but on different sides of the branch cut. This creates an arbitary discontinuity in the function - I believe this discontinuity is the source of the straight line artefacts that we see in the −1.5 power image in the section above. Take a different branch cut in your iterations process and you get a different image.Gandalf61 (talk) 13:08, 11 June 2008 (UTC)
- Indeed. Example (1 + i)½ is even worse (and there are 3 more quadrants in the complex plane to handle. Seeking a complex power of a complex variable may lead us to rush into quarternions where I fear to tread. Cuddlyable3 (talk) 15:59, 20 June 2008 (UTC)
- One can visualise the problem with fractional powers this way. Note that positive (negative) integer valus of d in the iteration yields plots that have (d-1) ((d+1)) fold rotational symmetries. A plot for a non-integer value of d would therefore need to have a non-integer fold rotational symmetry which is AFAIK impossible.Cuddlyable3 (talk) 09:30, 17 July 2008 (UTC)
- Hey guys, I went ahead and put one in: z^n+c = |z|^n * cis(n*θ) + c, where cis(θ) = cos(θ) + i*sin(θ), |z| is the magnitude of z, sqrt(x^2 + y^2) for z = (x,y), and θ is the angle made with the positive x axis, atan2(y,x). It works in my code. Minime12358 (talk) 23:56, 15 November 2012 (UTC)
Generalizations: Positive powers illustrations wrong?[edit]
Am I mistaken or do the illustrations for the positive powers go a little wrong from z<-- z5 + c onwards? Playing with some of my own code, based on what's in this page, I get something akin to this [3] for z<-- z5 + c. davep (talk) 16:41, 2 July 2008 (UTC)
- It is. I left a plea to the author of the images on his talk page for recreating correct images in the same style (http://en.wikipedia.org/wiki/User_talk:Cuddlyable3#Mandelbrot_set_Z.5En_pictures_set). Otherwise we could just fix the descriptions, or redo all the images. BTW, same error is with negative powers. --89.113.78.50 (talk) 15:38, 15 July 2008 (UTC)
- Well caught. You are right.
Do go ahead and change the picture captions for now. I can provide correct pictures for d = 5, 6, -5 and -6 later.These will be fixed on the new page Multibrot sets. Cuddlyable3 (talk) 16:33, 28 September 2008 (UTC)
- Well caught. You are right.
Negative power illustrations are wrong.[edit]
The illustrations are wrong. If one increases the bailout, the images change. This is because the negative-integer-power sets are actually the complements of "dusts" of points that, at some point in their orbit, reach 0, at which point they then instantly explode to infinity (or becomes undefined if we do not define division by 0). (Note we should start iterating with z = c, not z = 0, as then points go to infinity on the very first loop.) These dust sets are much more detailed and do not look "blobby". That one "Nova Fractal" image in the thread a little ways above this one (the big one that has the funny 3-pointed thingy on it) shows approximately what it looks like, although the "Nova Fractal"-specific features of it make it ungood for the article. mike4ty4 (talk) 08:02, 29 July 2008 (UTC)
- Yes, they are wrong (out of the reasons you mentioned ;-). "Correct" pictures may be created by using the Lyapunov-exponent. Ken Shirriff describes how to do it at http://www.righto.com/papers/frac3.ps . An example of a picture may be found at http://www.righto.com/fractals/neg.html (left side). I can provide such pictures (http://lostindiversity.junetz.de/mintwo.png) but I'm not quite sure if the iteration z->z^-d + c even fits into the topic. Maybe better leave it out or create a new topic "generalized mandelbrot sets". Enyaw ecurb (talk) 21:10, 30 July 2008 (UTC)
- This is right. But I'm not sure whether or not it should be left out or simply have the pictures replaced with more accurate ones. 70.101.147.16 (talk) 08:25, 31 July 2008 (UTC)
- I am not convinced that the negative power illustrations are wrong or inaccurate. They do however reflect the (arbitrary) bailout threshold chosen which for consistency is the same (=4) for all the examples. It may be more correct to state When d is negative the perimeter of the set is not fractal and tends towards a circle whose radius squared is the chosen threshold ( =4 ).
- mike4ty4 I believe you when you point out that there is more detail to be found in the area within the set. (That has been called the lake.) At present the article just calls the behaviour there "interesting complicated".
- Enyaw ecurb the
d=-3d=-2 example looks similar to Ken Shirriff's example picture (also "blobby") so I don't see a problem. I agree that we should consider collecting these generalised-power examples into a new topic, not least because they overload the present article. I suggest as a title "Multibrot sets". Cuddlyable3 (talk) 12:30, 31 July 2008 (UTC)
- Enyaw ecurb the
- Shiriffs picture is d=-2 (I think you mean that ;-). However you are correct when you say that the pictures aren't too wrong because with increasing treshold they will tend too look more and more like the ones generated with lyapunov-techniques. I'm saying they are wrong because of "my" definition of the sets. If you define M by the points which don't go over a certain threshold the pictures are "correct" but you will get problems because infinty itself is the critical point of a set (in fact a fixed point). Rather define M by the connectedness or by the points going to a stable cycle. Then the perimeter of the set is not the threshold but infinity (and the pictures are (rather bad) approximations of the "real" set). Enyaw ecurb (talk) 14:25, 31 July 2008 (UTC)
- Enyaw thank you for the correction d=-2 :-) . I agree that thresholding is the source of the "artificial" perimeter. Changing that approach needs more changes to the basic escape time algorithm than just a substitution in its inner loop, so I think you have provided here more incentive for extracting these cases to use in building a new article. Cuddlyable3 (talk) 19:08, 1 August 2008 (UTC)
- And because they are so bad -- much worse than the pictures of the "vanilla" M-set, I propose they be replaced with better ones generated using, say, the Lyapunov technique or other technique (practically any algorithm coloring based on the z-values attained during the iteration will show the underlying shape in some way or another. Although Lyapunov methods seem to provide the clearest pictures.). mike4ty4 (talk) 07:43, 1 August 2008 (UTC)
- Mike4ty4 better pictures are always welcome. Are you able to provide any? If so, it's a good idea to bring the picture first to this Talk page. We might need to ask you to explain a Lyapunov method, and whether the result fits best here, at Lyapunov fractal or at Fractal art. Cuddlyable3 (talk) 19:08, 1 August 2008 (UTC)
-
 z->z^-2+c
 -
 z->z^-3+c
 -
z->z^-3+c


- Here are some (hopefully better) examples. The use of the Lyapunov-Exponent for the generation of Mandelbrot sets is described in the paper I linked above but in short the Lyapunov-Exponent is the error growth-rate of a given sequence. You calculate the iteration sequence with N iterations, then calculate the Exponent with 1/N * sum(ln(|f'(Z)|)) and if the Exponent is negative the sequence is stable. The white pixels in the pictures are the parameters c for which the Exponent is positive aka unstable. The pictures are additionally colored after the periods of the cycles which the orbits are attracted to. All points colored dark-blue (outside) are attracted by a fixedpoint, all points in the middle (lighter blue) are attracted by a period 2 cycle and so on. The pictures have not much to do with Lyapunov fractals (except the calculation of the exponent somewhere in the routine) and are not really beautiful enough to fit into Fractal art. Enyaw ecurb (talk) 12:58, 2 August 2008 (UTC)
- Using an on-line postcript viewer I did not find the figures for Shirriff's article at http://www.righto.com/papers/frac3.ps. Enyaw your images are an improvement, thanks. It's a revelation to see at very high magnification the multitude of micro Mandelbrots ( self-similarity par excellence!). I might quibble that bounded (in set) pixels could be coloured black rather than dark blue.Cuddlyable3 (talk) 13:48, 2 August 2008 (UTC)
- Not only the dark blue part is in the set, every colored pixel is part of the set as they go to a stable cycle (white = not in the set). I just like to color this periodicity cause it shows the relation between the geometry of the set and its dynamics. However I can color the set black and try to give the white (=outer) part some kind of coloring to resemble the other pictures (d=3,4,5). On the other hand I can make pictures like above for d=3,4,5. If we put them in the article the pictures used should look alike.Enyaw ecurb (talk) 18:32, 2 August 2008 (UTC)
- Using an on-line postcript viewer I did not find the figures for Shirriff's article at http://www.righto.com/papers/frac3.ps. Enyaw your images are an improvement, thanks. It's a revelation to see at very high magnification the multitude of micro Mandelbrots ( self-similarity par excellence!). I might quibble that bounded (in set) pixels could be coloured black rather than dark blue.Cuddlyable3 (talk) 13:48, 2 August 2008 (UTC)
- Here are some (hopefully better) examples. The use of the Lyapunov-Exponent for the generation of Mandelbrot sets is described in the paper I linked above but in short the Lyapunov-Exponent is the error growth-rate of a given sequence. You calculate the iteration sequence with N iterations, then calculate the Exponent with 1/N * sum(ln(|f'(Z)|)) and if the Exponent is negative the sequence is stable. The white pixels in the pictures are the parameters c for which the Exponent is positive aka unstable. The pictures are additionally colored after the periods of the cycles which the orbits are attracted to. All points colored dark-blue (outside) are attracted by a fixedpoint, all points in the middle (lighter blue) are attracted by a period 2 cycle and so on. The pictures have not much to do with Lyapunov fractals (except the calculation of the exponent somewhere in the routine) and are not really beautiful enough to fit into Fractal art. Enyaw ecurb (talk) 12:58, 2 August 2008 (UTC)
Pseudocode[edit]
Hi. What do you think about moving pseudocode to wikibooks ? --Adam majewski (talk) 20:49, 30 September 2008 (UTC)
- The Escape Time Algorithm pseudocode can be the same for Mandelbrot set and Multibrot sets. Provided it is clearly linked from both these articles, I don't think it matters whether it is located in Wikipedia or in the Wikibook on fractals. Cuddlyable3 (talk) 20:27, 1 October 2008 (UTC)
- Wikipedia is not a manual, guidebook or textbook --Adam majewski (talk) 21:28, 1 October 2008 (UTC)
There is a page for multibrot sets diffrent then a page for Mandelbrot set for complex quadratic polynomials --Adam majewski (talk) 21:32, 1 October 2008 (UTC)
These sets are defined by a recursion performed on each value in the complex plane i.e. at each pixel of an image. We have to explain what that recursion is. That is why the article shows a simple pseudocode. I hope the Wikibook on fractals will be developed in the form of a tutorial textbook, ideally with examples in a common coding language that the student can compile and run. The pseudocode does not work that way since for transparency it is oblivious to language, variable type, hardware and image size.Cuddlyable3 (talk) 16:29, 3 October 2008 (UTC) You are right. OK. --Adam majewski (talk) 15:39, 6 October 2008 (UTC)
Is Multibrot set really a Wikipedia article ?[edit]


It seems to me that this article is of no interest to any Wikipedia reader - it ought to be reduced to a few lines and moved back to Mandelbrot set. It contains unverifiable (and wrong) personal observations like "the sets appears ...", an obscure formula (what is Z'?) and all the references are to Internet sites. On this talkpage is advertised for a correct picture of the Mandelbrot set for , and here you have such a picture (drawn by distance estimation). Anybody is welcome to include it in the article, but I will not do that for the following reason: some days ago I made this contribution to the Multibrot article:
The Mandelbrot set for has lots of beautiful localities, but the Mandelbrot set for has none. The reason is, that a Mandelbrot set must be constructed from two different critical points of the function, and has two critical points, namely 0 and ∞, but has only ∞ as critical point (see the definition in Julia set). We can as well draw a Mandelbrot set from only one critical point, but then it will have empty interior: we see only a colouring and the boundary. And the picture for has no aesthetic value. However, if we replace by , there will be two different critical points, namely 0 and ∞, and we can draw a Mandelbrot set having just as many interesting localities as the usual Mandelbrot set.


But instantly my text and image were deleted (by Cuddlyable3), for the reason that "the section is not the subject of the article". (Gertbuschmann (talk) 19:16, 25 April 2010 (UTC))
- The term Mandelbrot set must be reserved for set(s) actually introduced by Benoit Mandelbrot. It is incorrect to call other iterated sets "mandelbrot sets" without reputable sources. Your monochrome figure here for has a misleading file name Juliasetsdkpict55.jpg and is described as "Mandelbrot set". It would add nothing to the figures already in the Multibrot set article. Its calculation by distance estimation could reveal finer detail than the basic Escape Time algorithm but not in such a small image.
- The first sentence of the article shows that z is a "value in the complex plane". You are wrong to call this text "the sets appears[sic]..." an "unverifiable" and "wrong personal observation" because the circular perimeter is objectively visible and must be explained as being a product of the Escape Time algorithm and not of the set itself.
- Your quest is to seek images with "interesting localities" and reject others you think have "no aesthetic value". Your image here that enlarges a part of is pretty. The section Mandelbrot set#Other non-analytic mappings could easily be overloaded with such beautiful examples. Your image may be acceptable at Fractal art and/or Wikimedia Commons. There is a Wikibook on fractals that needs more how-to contribution.
- The 4th Reference in the article is I believe Ken Shirriff's published paper and not just a website. Cuddlyable3 (talk) 17:01, 26 April 2010 (UTC)
- For the use of the name Mandelbrot set, see my comment on the page Talk:Mandelbrot set.
- My remark about the difference between and is interesting, because in the same way as the usual Mandelbrot set is the prototype of the Mandelbrot sets where the iterations are towards ∞, the Mandelbrot sets for (a <> 0) are the prototype of the Mandelbrot sets where the iterations are towards finite cycles, and I propose this family of Mandelbrot sets studied more closely.
- My pictures are nothing, they are produced in a minute and have nothing to do with fractal art, but possibly this picture is the first ever made of these Mandelbrot sets.
- Yes, z is a value in the complex plane, but what is Z'? - the derivative of z in the sequence with respect to c? It is not true that the sets for d negative "actually extend in all directions to infinity". The names of my uploaded pictures start with the name of my Internet site (on aesthetics). (Gertbuschmann (talk) 15:46, 28 April 2010 (UTC))
- I believe by "critical points" you mean the same as what are usually called attractor and repeller points, but please correct me if I am wrong.
- You say your pictures are nothing, they are produced in a minute and have nothing to do with fractal art. I disagree with all 3 statements! (or with 2 of them if you really have such a fast computer).
- what is Z'?. It was a misprint for z, no differentiation intended. I have fixed it though the font is not quite right.
- You say It is not true that the sets for d negative "actually extend in all directions to infinity" but I find I can enlarge indefinitely the apparent outer boundary of the sets by increasing the bail-out value shown in this part of the pseudocode:
x*x + y*y <= (2*2)
Cuddlyable3 (talk) 07:54, 29 April 2010 (UTC)
- The concept of critical point is defined in Julia set, and its significance lies in that each Fatou domain contains a critical point. A Mandelbrot set is constructed from two critical points, and if the family of iterations is of the form for rational, then the Mandelbrot set is of bounded extent (easy to prove). A Julia set can reach out to infinity (as the Julia set for a Newton iteration, for instance). (Gertbuschmann (talk) 15:45, 30 April 2010 (UTC))


- I don't want to stir up a big discussion here but my two cents: ∞ is a critical point of the iteration z → 1/z^2+c. It also maps to itself. Therefore it is part of the set which is indeed not a "Mandelbrot-set" but I would rather have defined as the set of all points c with stable orbit. Of course the set is bounded but not towards ∞. It contains ∞ and extends to ∞ on an riemannian metric. Btw: I still think my pictures posted above are a quite correct representation ;-) But back to topic: In my opinion half of the article should be moved to wikibooks: pictures and code. Just keep a few notes here: Who coined the name, what it is, etc. Enyaw ecurb 84.177.59.107 (talk) 11:52, 1 May 2010 (UTC)
- The Mandelbrot sets for are empty (degenerated), because they are constructed from only one critical point. But you can still colour the plane. In the (correct) pictures above, drawn by the Lyapunov-Exponent method, the plane is coloured after the periods of the attracting cycles. The white is the boundary of the degenerated Mandelbrot set. You could as well have coloured the plane by choosing a small number , and colour after the (real) number of iterations needed to bring the sequence into distance from the attracting cycle. The radius of the Mandelbrot set is 2 for p = 2, and I think that this radius converges to 1 for p converging to infinity. (Gertbuschmann (talk) 03:02, 3 May 2010 (UTC))


- Gertbuschmann you persist in calling these sets Mandelbrot sets and disregard the title of the article which is properly sourced. I don't see any consensus arising for your indiscriminate usage of "Mandelbrot set" nor of "degenerated Mandelbrot". When the exponent is negative the set of values whose iterations are bounded is empty about the origin. The border of the set is simply star-like and not fractal, and the set extends to (a singularity at) infinity. Inside the set border the colour contours in the article are made as you describe. Bail-out radius (your ) was arbitrarily made 2 in the code snippet above for convenient computation. I don't know whether you are now convinced that the green outer parts of all the grouped images are only an artifact of that choice and not a characteristic of the actual set, but that is demonstrably true. I understand your last statement, where you choose to change to different symbol p from the article (so p = -d), as referring to the maximum inner radii of the empty part of the set i.e. the star tips. You may be right. Cuddlyable3 (talk) 16:45, 3 May 2010 (UTC)
- The word "Mandelbrot set" is so frequently used for a construction with another family than , that there is agreement on this use of the word, and Wikipedia must be in accordance with the world. I cannot see any reason for giving the constructions other names than "the Julia set for f(z) = ..." or "the Mandelbrot set for f(z) = ..." (besides I find the name Multibrot ridiculous). Here I will (like Mandelbrot himself) use the letter M for the construction, and say the following:
- For the family (and critical points 0 and ∞), the set M is non-empty, and it looks like my black-and-white picture above. For (and critical point ∞ two times), the set M is empty, but we can colour a point c in the plane by the real iteration number, which is calculated in this way: starting in ∞ we iterate a large number of times (by ), and if the terminus is an attracting cycle, we perform the same iteration again, but now stopping when the point is within distance (= 0.00000001, for instance) from the cycle. The number of iterations needed to this is divided by the order of the cycle, and a number in the interval [0, 1[ is subtracted (as described in Julia set). The result is the real iteration number, which is connected with the potential function. If we want a picture in black-and white, we must use the formula for the distance estimation (derived from the potential function), because the sets M are without interior points.


- These sets M (for d = 2, 3, 4, ...) are all lying inside a circle of radius 2, and I assert that the radii of the (outer) perimeter-circles of the sets converge to 1 for d converging to ∞.
- I understand that you define the Multibrot sets for negative powers as the complement of my sets M, and then of course the Multibrot sets for negative powers (contrary to the case of positive powers) contain the point ∞.
- The bail-out radius 2 is without sense in the constructions for negative powers.
(Gertbuschmann (talk) 02:47, 4 May 2010 (UTC))
- The term M-set might mean Menshov set and I don't see your usage of it to mean Mandelbrot set noted in any article, though maybe it should be, with its source. Yes indeed, we define the set as comprising those values whose continual iteration remains bounded and that is not your sets M. Yet I see no reason to disagree with your assertion about the radii of the sets for d = 2, 3, 4, ... because we are talking about the same sets for positive d. (I think I was confused by your change to the symbol p. I am further confused now you substitute d for p. Please stick to the sign of d used in the article.).
- The names Multibrot and recently Mandelbulb have both arisen in reliable sources so this is where Wikipedia must follow the world, even if it sounds ridiculous. WP:AfD is worth reading if you believe there would be consensus to delete the article; there was a proposal to delete another fractal article but the decision was keep. Your black-and-white picture is for d= -2 but I see that you use a different algorithm to generate it than the Escape Time algorithm described in the pseudocode in the article. That algorithm does not involve arbitrary tiny offsets.
- A bail-out radius is essential for operation of the Escape Time algorithm. In constructing the maps for negative exponents one can, in principle, set the bail-out radius as large as one likes with no benefit other than slower computation (or putting the outer border artifact somewhere out of sight). For positive exponents, increasing the bail-out threshold gains greater detail in the fractal border of the set. Cuddlyable3 (talk) 11:48, 4 May 2010 (UTC)
- My set M for the family (coloured black) is precisely the same set as the set coloured white in the corresponding picture by Enyaw ecurb. When c is numerically large, the equation has one and only one solution, namely a w very near c. Therefore, for such a c, the sequence generated by and starting in ∞, converges to this solution w. That is, all the points c outside a circle of sufficiently large radius are contained in the domain coloured dark-blue in the picture. Now I have proved, that the sets in question are lying within a circle (apparently of radius 2), that is, that they do not grow towards infinity for increasing bail-out radius. (Gertbuschmann (talk) 09:32, 5 May 2010 (UTC))

- Ah, I think I get it. Your M is contained exactly in the points not converging to infinity, which is why you state the need of a second critical point (which is quite correct as Julia-Sets are defined over this kind of dichotomy). Silly me, I did define (as I pointed out above) the set M' as the set of points with a stable orbit on a riemannian metric (containing ∞), which seems to be in the case of z^2 M=M' (but not proven). As far as I'm concerned I think this is a valid extension of the normal definition (which again is not published and citable knowledge as far as I know). Your "M", the white part in my pictures, black in yours are the points that do not enter a stable orbit and in lack of another critical point _never enter a stable orbit_. It follows that this set C \ M' contains exactly the parameters c for which the "Julia-Set" z->z^-2+c is the entire complex plane and all periodic orbits are repelling... (try it, nice random noise images) Enyaw ecurb 84.177.114.192 (talk) 21:14, 6 May 2010 (UTC)
But well, back to topic... z^d with d<0 are not "Multibrot-Sets" anyway (which by the way is maybe a ridiculous name, but a correct one) and seem to be of low mathematical interest (Shiriffs "paper", two from Wang, thats it). They can not be defined over the connectedness locus of these families (which is afaik "the definition" of Multibrot sets, e.g. [4]). Move them to wikibooks or wherever and stick to the basics: If someone stumbles over the name "Multibrot" he should be able to find out _what it is_. Not what we assume, discuss or fight about it to be. Enyaw ecurb 84.177.114.192 (talk) 21:14, 6 May 2010 (UTC)
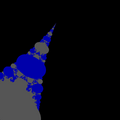
The gallery below shows details of the first quadrant of the multibrot set for the iteration z ↦ z−2 + c, all rendered with the Escape Time algorithm. Black is the set defined in the article.
-
 The coloured contours show the number of iterations to bail-out radius 2.
 -
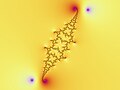
 Bail-out radius is increased to √8 to place the outer ring artifact out of sight beyond the top right corner. Blue/grey show odd/even number of iterations to bail-out. More self-similar structure is visible.
 -
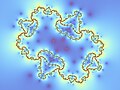
 Bail-out radius is √8. The coloured contours show values of log(2) of the iteration overshoot at bail-out.


Cuddlyable3 (talk) 23:19, 6 May 2010 (UTC)
- That the function has only one critical point is not the essential. Mandelbrot had to use two critical points because he had no other colour than black, and it is best to use two points because you then (usually) get a black domain and more details, but if you use distance estimation or a rich colour scale, you can be content with only one critical point. The first picture below shows the Mandelbrot set constructed from the critical point 0 (in the same way as my set M above - this set (without interior points) is the closure of the set of points c such that the sequence does not converges towards an attracting cycle).
- The two pictures show Julia sets for iterations of the form . And as you see, these families (Multibrot's for negative powers) are not of "low mathematical interest". Outside the star-like figures, the Julia sets are disconnected, but inside they are connected, and (as it is the case for the Julia sets for positive powers) they divide up the plan in just as many parts as the order of the attracting cycle (in the pictures, the orders are 3 and 4). A Julia set for a rational complex function is always without inner points, and can thus never be the entire plane (for a transcendental function, such as sin(z), a Julia set can be dense in the plane).

-
 The Mandelbrot set constructed from only one critical point
 -
 Julia set for
 -
 Julia set for


(Gertbuschmann (talk) 15:53, 7 May 2010 (UTC))
- The pictures of the Julia-Sets are good! However, I suspect the respective parameter c is from "my M'". Try one out of "my white area". For J=C, I will not answer directly, just cite "The beauty of fractals", p. 55: "Let R(x) = ((x-2)/x)^2, then J=C." The discussion follows. If you do not own the book, I refer to Milnors' "Dynamics in one complex variable", where I faintly remember it being an example. May be wrong on that though. With "low mathematical interest" I meant that there is not much published matter on this family of iterations. As far as I know. You may prove me wrong on that. Enyaw...
- The Mandelbrot set image above looks like it is made by colouring internal distance estimates and is not for use in this article. The two continuously coloured Julia set images are beautiful. There is no suitable neologism for them like "multijulias". They could illustrate a new section here or as the article Julia set is non specific about the function iterated it might also be a home for them. Cuddlyable3 (talk) 12:46, 8 May 2010 (UTC)
- The domain inside the Mandelbrot set is coloured in the way explained above, that is, first an iteration a large number of times, and then the same iteration again, but now set to stop when the distance from the cycle is smaller than . My first Julia set above (for ) is for the cusp of one of the largest cardioids, that is, one of your white points. For points farther inside the white, the Julia sets become more dense, but they will not expand. It is true that you can construct a rational function such that the Julia set is the entire plane (namely if all the critical points are iterated into repelling points). I have drawn Julia sets for , for c near 0, and the Julia sets grow in size and complexity when c converges to 0. (Gertbuschmann (talk) 14:28, 8 May 2010 (UTC)) —Preceding unsigned comment added by Gertbuschmann (talk • contribs) 14:27, 8 May 2010 (UTC)

Questionable escape conditions[edit]
The generalizations of the Mandelbrot set used throughout this article use same escape condition as the z->z^2+z_0 case. I am not sure this is appropriate. For exponents >= 2, this works as large numbers will be dominated by the exponent and the added constant will have little effect on the orbit. However, for negative exponents, the sequence may very well enter into a repeating sequence that causes it's magnitude to alternately exceed the threshold and then become small again. Consider the sequence z-> z^-2+z_0 starting at 0.1. we find z_1 = 100.1, z_2 = 0.1001, z_3 = 99.9007, z_4 = 0.1001, and so on. The sequence continues alternating between numbers on the order of the starting value, and numbers that are much larger. It can't be said that the number ever really escapes, that is, becomes dominated by the exponent. All these techniques do is naively apply an incorrect escape condition that is appropriate only to the n>=2 case. If the escape conditions are modified to be more appropriate, you will find that many of these fractals do not really have any significance. —Preceding unsigned comment added by Willyshop (talk • contribs) 16:25, 13 October 2010 (UTC)
More about negative exponents[edit]
I found this talk page while debugging a program I've written to draw these fractal images in a web browser. I have verified that as stated above, the "negative Multibrot" fractals change as the "bailout" number is increased. My image for bailout=2 is exactly the same as the one given, but with different colors. My program allows for the iterating function to raise arbitrary complex numbers to arbitrary complex powers. Willyshop is correct to point out that when z_n becomes very large, the negative exponent will cause it to become very small, then very large, very small, and then very large again.
Recall that the definition of a Mandelbrot set is that the sequence defined by the iterating function has magnitude that is bounded for all points in the set. Having small very small numbers included in between very big ones does not preclude the iterating function from being unbounded; just because the value after a very large number is very small doesn't mean that another value in the sequence may be even bigger.
My program runs on the following URL: http://danielsadventure.info/html5fractal/index.html#-1,-2,2,-2,2,2,341,true,z%5E-2%20%2B%20c,-2,2,-2,2 Please note that the Javascript engine in IE runs this program very slowly; it is optimized for Firefox, but runs fine in Chrome.
Please not that I do not guarantee that this link will work forever; I may change the syntax of the hash URL, but the URL provided will draw a Multibrot (-2) set with a bailout of 2. Click [Options] and increase the bailout number to show that there is a problem.
Integer values not included: d=1, d=0, d=−1[edit]
What happens when d is equal to 1, 0 and −1 ? Probably it's trivial and I can do the maths by myself, but why they are not described in the article ? --Little bishop (talk) 00:17, 3 August 2020 (UTC)
- Little bishop For d=1, the sequence simply adds c every time, and tends to infinity for any nonzero c; this "monobrot set" is the point (0,0). For d=0, the sequence is constant at c+1 because for all n, and can never escape to infinity; the zerobrot is the set of all complex numbers. For d=-1, it's a little more...complex. Just remember that for any complex number c, |1/c| = 1/|c|. On the set of real numbers, you can easily satisfy yourself that is bounded by the finite value 1/c + c, i.e., can never have a greater magnitude than that and cannot escape to infinity. Because this holds for the magnitude of complex numbers as well, the -1-brot is also the set of all complex numbers. So there's just nothing interesting to look at here. That said, if there is any scholarly work describing the mundane behavior of the generating function for such values of d, it would be great to add that to the article. --DavidK93 (talk) 17:57, 20 November 2020 (UTC)
- Thanks very much DavidK93. Yes, I think these 3 special values should be described in the article. Little bishop (talk) 21:55, 24 November 2021 (UTC)


What about Multibrot?[edit]
D = Infinity in a Multibrot is a Circle, Right? 12.171.25.60 (talk) 19:43, 27 November 2023 (UTC)