This is an archive of past discussions. Do not edit the contents of this page. If you wish to start a new discussion or revive an old one, please do so on the current talk page.
An editor removed the diagram and the associated caption stating:
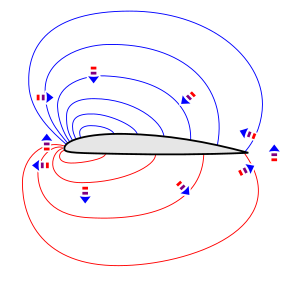
"Deleted unsourced (original research) and incorrect diagram. The pressure distribution around a wing has two maxima (at the leading edge and sharp trailing edge, according to the Kutta condition referenced elsewhere on the page) and two minima. The diagram in question showed one maximum and one minimum, both in incorrect locations.)"
My view is that the diagram simply depicts what's stated in words in the accompanying section, which is clearly sourced to McLean, although I have to admit that I had to stare at it for a bit to understand that the arrows indicate force, not velocity (which is what I'd assume and would presume that most readers would too). So, I'm not wedded to keeping the diagram, but I don't think it qualifies as original research. My recollection is that Douglas McLean himself added it but since it's based on published material it doesn't violate WP:OR.
I also think the picture is schematic (i.e. something one would draw on the back of an envelope) and not 100% accurate as if it were plotted from actual experimental data, so perhaps we could do with a better picture.
So, keep the diagram or no? Perhaps find better sourcing or a better diagram? Comments appreciated.
BTW, the Kutta condition states that the stagnation points are at the leading and trailing edges, not that the pressure is maximum there; I do not think it says anything about the location of maxima or minima. The streamline curvature theorem states that the pressure gradient is maximal where the radius of curvature of the flow is minimal, which leads me to believe that the diagram does not precisely place the maxima/minima, but that may not be a reason to eliminate the diagram.
So, keep the diagram or no? Perhaps find better sourcing or a better diagram? Comments appreciated. Mr. Swordfish (talk) 15:19, 13 August 2020 (UTC)
To be blunt, I did find the diagram crude, inaccurate and unhelpful. I had to know what it was meant to depict before I could decipher it, which is back to front for its purpose. I agree with the IP editor that it did not adequately depict the information in the sources. A better replacement would be good, but I am glad to see this one go. — Cheers, Steelpillow (Talk) 17:58, 13 August 2020 (UTC)
I agree that the diagram was ripe for deletion. I particularly challenge the notion of trying to represent the fluid pressure at a point using a vector. Firstly, pressure is a scalar quantity - Pascal's law tells us it acts equally in all directions. We can use a vector to show the force exerted by a fluid on an element of a solid surface (and also it’s reciprocal - the force on the fluid exerted by the solid surface; Newton’s Third Law.) If we identify a cube of fluid we can draw six vectors to represent each of the six forces acting on the six faces of the cube (plus one vector for weight.)
In a figure representing an airfoil with a cusped trailing edge (trailing-edge angle of zero) there is no stagnation point at the trailing edge. However, in the case of a more feasible airfoil with a non-zero trailing edge angle there must be a stagnation point at the trailing edge.
The Kutta condition says nothing about points of minimum pressure. It doesn’t even confirm that there is a stagnation point near the leading edge. Dolphin(t) 07:15, 14 August 2020 (UTC)
Mr Swordfish asked for a better diagram. I’m not aware of a diagram exactly like this one, showing the isobars around an airfoil. There is a diagram used to show the distribution of pressure coefficient around the perimeter of an airfoil. A good illustration is at Figure 34 (in section 3.7) of Abbott and Von Doenhoff’s Theory of Wing Sections (1949). In John D. Anderson’s Fundamentals of Aerodynamics a similar illustration is at Figure 4.25 (in section 4.9) Dolphin(t) 13:12, 14 August 2020 (UTC)
I made the diagram in question and installed it in the "A more comprehensive physical explanation" section of the article. The diagram is referred to in the text in both the "The wider flow around the airfoil" and "Mutual interaction of pressure differences and changes in flow velocity" subsections. I also drafted the text in something close to its current form, and I'm the author of the source on which actual explanation in the section is based. So I'm responsible for any deficiency in the material.
I also made the corresponding diagram in the cited source (McLean, 2012, fig 7.3.13). That diagram is also far from elegant, but I think it does its intended job. It's a schematic diagram to illustrate the general nature of the pressure field around a lifting airfoil, dominated by a region of reduced pressure diffusely spread out above the airfoil and a corresponding region of increased pressure below. It also uses arrows to illustrate the directions of the forces exerted on the air by this non-uniform pressure field. I deliberately simplified the rendering of the pressure field, using a low-resolution graphic convention (clouds of little minus and plus signs) to represent reduced and increased pressure. This deliberate simplification included omitting the pressure signature of the leading edge (LE) stagnation point, which is generally limited to a small region near the LE and contributes only a tiny fraction of the integrated lift force. The stagnation point is extraneous to the explanation that the diagram illustrates and is thus a detail best omitted to avoid distracting from the message of the diagram. I also omitted other near-field details of the pressure field that can differ greatly depending on the particular airfoil shape and angle of attack. What's left is a very generic and simplified version of a lifting pressure field.
The contested diagram is a close equivalent to fig 7.3.13 of the cited source, simplifying the rendering of the pressure field to about the same degree. The only real difference is that it uses sketched isobar contours instead of the little minus and plus signs. I don't think changing from one graphic convention to another rises to the level of OR. I think both versions succeed in getting the message across, even if some viewers have to study them a bit before they understand the message. The physical interaction the diagram is illustrating is, after all, a subtle one. The contested diagram is closely equivalent to one in the cited source, and is referred to in the text that does the citing, so the accusation that the diagram is "unsourced" doesn't make sense to me.
The quoted editor judged the diagram "incorrect" because it doesn't show two pressure "maxima", which I think is also intended to refer to two stagnation points, one near the LE and one at the TE. The two stagnation points are supposed to be there "according to the Kutta condition". I think this is wrong on three counts:
1) The Kutta condition isn't really about pressure maxima or stagnation points. Strictly speaking, it's a mathematical fix for the fundamental indeterminacy of the circulation in potential-flow theory for airfoil flows, allowing the theory to predict roughly the right lift for an airfoil with a sharp trailing edge. It requires the circulation to be chosen so that the flow leaves the TE smoothly, thus avoiding the formation of a singularity with infinite flow velocity. When the Kutta condition is applied to the potential flow around an airfoil with a wedge TE (non-zero TE angle), the TE will also happen to be a stagnation point. The Kutta condition is sometimes described as requiring a stagnation point to be positioned at the TE. Actually, it doesn't always require it. As Dolphin correctly pointed out, the Kutta condition, properly understood, also applies to an airfoil with a cusped TE, which has no TE stagnation point in potential flow. I suspect some of the confusion on this point started with descriptions of the classical conformal-mapping theories in which the lifting flow around a circular cylinder is mapped into the flow around a practical-looking airfoil shape (Milne-Thomson, 1966, ch. 7, for example). The point at which the flow leaves the surface in the circular-cylinder flow must always be a stagnation point (M-T, sec 7.11), but the corresponding TE point on the airfoil doesn't always have to be. A fact that's easy to forget because cusped airfoils aren't that common in practice.
2) There's nothing wrong with omitting stagnation points from the diagram. The LE stagnation point is extraneous to the explanation being given, and I deliberately omitted it for the reasons discussed above.
3) A real airfoil doesn't have a TE stagnation point. A 2D airfoil with a non-zero TE angle has a TE stagnation point pressure signature only in the theoretical inviscid world. In the real world, the viscous boundary layer approaching the TE carries enough low-total-pressure fluid adjacent to the surface that it effectively washes out any hint of a stagnation point there. In real viscous flow the pressure distributions on the surface and in the field never look anything like a stagnation-point pressure distribution at the TE, even when the TE has a substantial wedge angle.
So in my opinion the rendering of the pressure field in the contested diagram is not "incorrect".
Dolphin questioned the use of arrows to represent effects of pressure. I don't see anything incorrect here either. The text clearly states that the arrows represent local forces exerted by the non-uniform pressure field. It's true that at a single point the pressure acts uniformly in all directions, even if the pressure is non-uniform in the neighborhood of the point in question. But that doesn't rule out a net force on a fluid parcel, exerted by non-uniform pressure. Here I'm referring to the net force on the parcel, exerted by the pressure acting inward on all its surfaces. For the cubic parcel mentioned by Dolphin, it's the net force represented by the sum of the force vectors on the six sides of the cube. In the limit as the parcel size goes to zero this net force goes to zero as the volume goes to zero, but the force per unit volume converges to minus grad(p). The parcel doesn't have to be a cube. The result holds regardless of the shape or orientation of the parcel. This is the origin of the grad(p) term in the momentum equations, through which the pressure exerts forces that affect the flow through Newton's second law in Euler, NS, or RANS calculations. And it's the force that the arrows in the diagram represent. In the article text and in the book I tried to describe this situation (a net force in the direction from higher pressure toward lower pressure) without appealing to vector calculus.
So I don't see anything incorrect or unsupported about the diagram, either with regard to the rendering of stagnation points or the meaning of the arrows. It's crude, but it's technically correct as a schematic diagram, and it's supported by the source cited. The text explanation in its current form refers to the deleted diagram and is thus seriously degraded by its omission. My vote is to reinstate the old one until someone comes up with a better one. Perhaps a more informative caption would make things clearer and help to avoid some of the misunderstandings that the diagram seems to have evoked.
A better diagram is probably not just a few mouse clicks away. As Dolphin pointed out, plots of surface-pressure distributions are more common than pressure-field plots. But surface-pressure plots are no help here because the purpose is to illustrate the interaction between the pressure field and the velocity field off the surface. The pressure-field plots I found in a quick internet search were all in copyrighted papers or on commercial sites advertising software packages.
In this context I should point out that in the several years since I drafted the text and made the diagram in question, a new source has become available, which should perhaps be taken into account in the article. I've written a two part paper on lift, and it's been peer reviewed and published in "The Physics Teacher", in the November 2018 issue, pp. 516-524. The explanation in this new paper preserves the key elements of the one in the book and in the Wikipedia section in question but also adds a new way of looking at the cause-and-effect relationships involved in the formation of the pressure field, which, for completeness, should probably be added to the "more comprehensive physical explanation" in the Wikipedia article. The isobar diagram in the new paper isn't just schematic. It's based on a high-fidelity viscous-flow CFD solution for a NACA 4412 airfoil, computed by a friend with access to a RANS code, and plotted with quantitative accuracy. It shows the pressure signature of the LE stagnation point and no hint of a TE stagnation point, as one should expect. It's definitely more accurate and detailed than the contested diagram, but probably no more effective in illustrating the explanation of lift. It shows the LE stagnation point but doesn't contradict any of the claims I made above about the extraneousness of the stagnation point to the explanation of lift. Whatever its virtues, however, this new diagram isn't eligible for use in Wikipedia. J Doug McLean (talk) 01:12, 8 September 2020 (UTC)
@J Doug McLean: Thank you for such a full explanation, Doug. Having studied the text I think that it is not wholly correct, which was part of why I found an inconsistency between it and the drawing (but the text is another issue). I do still think that the diagram could be significantly improved, so that it would be worth reinstating. I'd like to have a go at that. If I draft something, would you prefer me to create a new drawing file on the Commons so that the two versions can coexist, or to update yours straight away? Obviously, if you didn't like what I did to your drawing, one of us could revert my changes. — Cheers, Steelpillow (Talk) 09:02, 8 September 2020 (UTC)
Hi Doug. Welcome back!
Are you able to suggest a “more informative caption” to make things clearer? Dolphin(t) 13:37, 9 September 2020 (UTC)
Thank you, Steelpillow and Dolphin for your prompt responses.
I've been thinking about this whole process in light of Wikipedia's BOLD/REVERT policy. The quoted editor, who doesn't seem to be a participant in this talk page, bolded the change that removed the diagram. I strongly disagree with the editor's stated reasons for the removal, for reasons I detailed above. So we don't at this point have a consensus for removal. I think that in this situation the policy calls for reversion followed by a quest for consensus. So I'm reverting the change, leaving the article in its previous state until we reach a consensus on what the change, if any, should be. The discussion on this page has raised other possible reasons to replace or improve the contested diagram, and we should continue to discuss those. But removing the diagram again before we have a consensus would constitute edit-warring, so please don't do it, whoever you are.
The removal of the diagram left the article in a degraded state in which the text referred to the diagram that was missing. My reversion fixes this problem in the interim.
Dolphin asks if I would suggest a "more informative caption”. Well, looking at it again after a long while, I see that the caption was already better than I remembered it. It already described the arrows as indicating "directions of net forces on fluid parcels in different parts of the flowfield". Still, after I reverted the removal, I took a stab at making the caption more informative. Of course that also made it longer. I'm sure it could still benefit from some further work.
The contested diagram is inextricably tied to the text. So I'd say questions about the text are properly part of this discussion and not "another issue".
Steelpillow, you say you think the text is "not wholly correct". Does that mean it's not consistent with the source, or does it mean that the source is also "not wholly correct"? You also say you found an inconsistency between the text and the diagram. What is that inconsistency, specifically? If we're going to have an open discussion of these issues, we need to hear your reasons. This really is relevant to our making an informed decision about the diagram.
Yes, by all means have go at making a better diagram, preferably as a new file. As you say, if I don't like it I can always revert the change. At least now the article in its baseline state will have a diagram in place, as it should. J Doug McLean (talk) 22:52, 10 September 2020 (UTC)
Thanks again Doug. I have no objection to the diagram being restored to the article while we seek clarification and consensus. Dolphin(t) 07:01, 11 September 2020 (UTC)
OK, I have tried to take that all on board.
Pressure field around an airfoil. The lines are isobars of equal pressure along their length. The arrows show the pressure differential from high (red) to low (blue) and hence the direction in which the air is accelerating. Here is my first tentative stab at a new diagram. I could not find a handy source for the shape of the isobars so I had a bit of a semi-educated guess. Are they anywhere near the mark? I have tried to highlight the pressure variations using color, do folks think it works? I have also given a much shortened caption, is there really any need to say more that is not better explained in the text? And looking at it now, I have shrunk the arrows too much. (The image offset appears to be a bug in the rendering, it is not present in the original file. Should be easy to do a workaround)
This text is not quite right; "To produce this downward turning, the airfoil must have a positive angle of attack or have its rear portion curved downward as on an airfoil with camber. " A reflex aerofoil such as RAF34 still generates lift at zero AoA. I'd suggest rephrasing along the lines of "... or have sufficient positive camber."
Nor is this; "the arrows behind the airfoil indicate that the flow behind is deflected upward again, after being deflected downward over the airfoil." The arrows show no such time sequence and both appear to show air passing over the trailing edge rather than anything further behind. Indeed, if the air behind is to be further deflected downwards (which I believe to be the case, or am I mistaken?) then the pressure back there must be higher above than below, and this is not depicted.
Thanks Steelpillow. After a quick glance I can only make one comment. In the region with the blue isobars there are 4 vectors showing pressure gradient. Three of them are directed inwards towards the airfoil as is to be expected; but one of them is directed outwards contrary to expectations. I think that one is pointing in the wrong direction. Dolphin(t) 13:12, 11 September 2020 (UTC)
Three quick comments:
1)The gradient is a vector that points in the direction of increasing scalar quantity (here, pressure). You have the arrow pointing opposite to the gradient vector. I'd suggest reversing them to follow convention, i.e. having the arrow point in the direction of increasing pressure.
2)The current diagram shows force vectors, the proposed new one shows pressure gradient vectors. Is this intentional? Should we include text relating the two?
3)Agree with Doug that restoring the diagram pending consensus is the right approach, especially since the text refers to a (until recently) missing diagram. Mr. Swordfish (talk) 18:03, 12 September 2020 (UTC)
Steelpillow, this looks quite promising. Here are some changes I'd suggest:
You correctly show the regions of low and high pressure protruding forward of the LE. But the regions actually should protrude behind the TE as well. In your drawing this protrusion behind the TE should show up only in the isobars closest to ambient pressure (the outermost ones, above and below). These outermost isobars should leave the upper and lower surfaces slightly forward of the TE (not from the TE itself, because that implies double-valued pressure at the TE) and slope rearward, and then protrude behind the TE by about half the amount that the outermost red contour currently protrudes ahead of the LE. With this change, the force arrows near the TE will indicate vertical components that are upward. This has to be the case to be consistent with actual pressure fields and with the upward flow curvature near and aft of the TE that's described in the text. The flow for some distance aft of the TE is of course sloping downward, but it begins curving upward even slightly before it passes the TE, and continues to curve upward until the downwash angle goes to zero in the farfield (in 2D). This upward acceleration of the flow behind the TE was noted by Lanchester in his 1907 book. Adjusting the contours to be consistent with this will require the right boundary of the drawing to be pushed out a bit.
You show the innermost contours well forward on the chord, which is notionally consistent with most ordinary airfoils. But the outermost blue contour should protrude as far forward of the LE as does the outermost red one. Starting with the innermost contours positioned well forward, as you move outward through the contours, the high points (blue) and low points (red) should gradually shift aft, approaching about 35% chord. The outermost red contour should extend almost as far below the airfoil as the outermost blue one extends above, which would require pushing the lower boundary of the drawing downward.
Regarding the text, I agree that "To produce this downward turning, the airfoil must have a positive angle of attack or have its rear portion curved downward as on an airfoil with camber. " states the requirement too strongly, even with the "or". Your suggested rephrasing in terms of "sufficient positive camber" is good.
In the second sentence you questioned, "the arrows behind the airfoil indicate that the flow behind is deflected upward again, after being deflected downward over the airfoil.", I used "is deflected" to denote the change in flow direction that's taking place, not the direction itself. That is, I was referring to streamline curvature, not streamline slope. I think that usage is defensible, but one of the reviewers for "The Physics Teacher" had the same problem with it that I think you're having. So for the paper I recast that passage in terms of "flow turning" and "upward curvature of the streamlines". Perhaps a similar terminology change would help here. Anyway, the flow behind the TE continues to move along on a downward slope, but it's just coasting downward due to inertia. It's not being "further deflected downward". The pressure-force vectors slope upward, producing upward acceleration of the air, and the flow turning or deflection that's taking place is upward, as it is in the region ahead of the LE. These leading and following regions of upward curvature stand out pretty clearly in the animation.
Mr. Swordfish raises a couple of valid points about the pressure gradient. Actually, I think the current version does okay without ever mentioning the word "gradient": "The non-uniform pressure exerts forces on the air in the direction from higher pressure to lower pressure. The direction of the force is different at different locations around the airfoil, as indicated by the block arrows in the pressure distribution with isobars figure." The force per unit volume is just minus grad(p), as I pointed out above. The force is a focus of the explanation, so I'd prefer to keep the arrows in the force direction. And I'd prefer to keep the text as is and not mention "gradient". J Doug McLean (talk) 00:51, 13 September 2020 (UTC)
The diagram is now updated accordingly. I was wrong to imply that the arrows show the pressure gradient vector in the usual way, so I have edited the caption accordingly to use the term "differential" instead. But I do think they are better this way round. I also added an extra arrow to show the upward acceleration behind. Is it about right now?
I have corrected the text to meet the first concern. But I am a bit confused over the trailing flow. I seem to recall from previous discussions that about half the "downturning" of air occurs behind the trailing edge. But here it is all occurring adjacent to the airfoil and the trailing airflow is all upturning. Can somebody clarify the "half of it happens behind the airfoil" principle?
@Steelpillow: I think comments about "half the downwash occurs immediately behind the wing, but 100% of the downwash is only observed at a significant distance behind the wing" etc. are alluding to the fact that immediately behind the wing the downwash is due to the almost-semi-infinite trailing vortices stretching backwards from the wing; whereas at a significant distance behind the wing the downwash is due to the almost-infinite trailing vortices stretching forwards and backwards. The Biot-Savart Law#Aerodynamics applications is relevant. Dolphin(t) 12:14, 14 September 2020 (UTC)
Clearly there is a difference between a downwash (velocity) per se and a downturning (acceleration) of that wash. Are you suggesting that the rearwards doubling occurs only in the downwash but not in the downturning? That would make sense; the trailing downwash must be a consequence of an initial leading downturning. — Cheers, Steelpillow (Talk) 14:03, 14 September 2020 (UTC)
Downwash w is the vertical component of a velocity vector. If w is divided by the free stream velocity it yields a small angle which John Anderson calls the “induced angle of attack”. (The induced angle is negative and serves to reduce the geometric angle of attack, yielding the “effective angle of attack”. See Anderson’s Fundamentals of Aerodynamics, Section 5.1 titled Introduction:Downwash and Induced Drag.
In Aerodynamics, Clancy says “Thus the total downwash far downstream of the wing is twice that in the vicinity of the wing itself.” See Section 8.10 titled The Horseshoe Vortex.
Neither Anderson nor Clancy appear to talk about acceleration or turning of the wash. Dolphin(t) 01:16, 15 September 2020 (UTC)
Thank you both, I understand now where that half memory (pun intended) was coming from. No "downturning". — Cheers, Steelpillow (Talk) 10:38, 15 September 2020 (UTC)
Dolphin, you may be right that the "half of it happens behind the airfoil" principle that Steelpillow was trying to remember has to do with the doubling (roughly) of the 3D downwash over a long distance behind a wing with a trailing-vortex system. It's an interesting thought, and it may help jog Steelpillow's memory, but I don't think this fact helps us with the task at hand. The purpose of this section of the article is to explain lift in qualitative physical terms. The processes of interest to us happen largely in response to airfoil shape and angle of attack, in the relative near field of the airfoil, the area roughly circumscribed by the diagram we've been working on. The pressure field and the physical mechanisms we're explaining are qualitatively the same in this region regardless of whether it's a 2D airfoil or a 3D wing, as long as the aspect ratio isn't abnormally low.
We were specifically discussing the flow around and immediately downstream of the TE. Even in 3D, that flow is dominated by local sectional effects, with 3D effects being secondary. The flow leaves the TE at a downwash angle, but that downwash angle initially decreases in the near field behind the TE, in response to the upward pressure forces indicated by the arrows in the diagram. The decreasing downwash constitutes upward turning and is consistent with the decreasing "influence" of the bound vorticity with distance aft. This upward turning is noticeable as upward curvature of the streamlines aft of the TE in the streamline animation (a 2D case, of course, but it represents an actual solution to the potential-flow equation). The 3D effect described by Dolphin and Clancy produces an increase in downwash angle over a longer streamwise distance and involves downward turning that is relatively weak and takes place relatively far from the airfoil. It's not a mechanism that has much effect on near-field streamlines or that plays a significant role in the physics of lift generation.
An alternative candidate for Steelpillow's "half of it happens behind the airfoil" principle is the fact that along any vertical/transverse plane behind the TE there is an integrated flux of downward momentum equal to half the lift, regardless of the distance behind the TE. There is a corresponding integrated flux of upward momentum across any vertical/transverse plane ahead of the LE, equal to the other half. The change in integrated flux from ahead to behind, with signs appropriately assigned, is a downward change that accounts for all of the lift. This candidate also has the "half-and-half" character we're looking for, and it has the virtue of applying in 3D as well as 2D (reckoned in per-unit-span terms in 2D).
Steelpillow, the revised contours and arrows look good to me, and I would now support replacing the old diagram. This new one is definitely more professional looking.
Regarding the caption, I don't think "pressure differential" quite captures the idea. You're really talking about the pressure gradient, but to avoid having to go into technical details like the definition and proper sign convention of a gradient, you substitute a different word that I don't think quite works. I'd prefer to skirt even further from the gradient idea and concentrate on the forces, as the first paragraph in the "Mutual interaction ---" section does: "The non-uniform pressure exerts forces on the air in the direction from higher pressure to lower pressure. The direction of the force is different at different locations around the airfoil, as indicated by the block arrows in the pressure distribution with isobars figure." For the caption sentence that describes the arrows, I'd suggest something like "The arrows indicate the directions of net forces exerted on the air by the non-uniform pressure in different parts of the field and thus the directions in which the air is accelerating." J Doug McLean (talk) 05:42, 15 September 2020 (UTC)
I am not clear why it would "really" be talking about the pressure gradient or about forces and not pressure differentials; the subsection is titled "Mutual interaction of pressure differences and changes in flow velocity" (my italics) and the "pressure difference" is mentioned again in the main body. As far as gradient goes, the subsection does not mention it at all. If there were reason to avoid pressure differential in the caption, that would surely be reason to avoid it in the text as well. So I'd prefer to see that as a new discussion, if it needs to be followed up. Forces are indeed discussed, but I talked about the pressure differential rather than forces because it is a pressure diagram, which is to say force per unit area, and referring to it as "force" per se is not really correct. Also, I think it important to explain about "high (red) to low (blue)" and that intrinsically entails the concept of pressure. Nevertheless I can see the sense in mentioning forces, so how about; "The arrows show the pressure differential from high (red) to low (blue) and hence also the net force which causes the air to accelerate in that direction." — Cheers, Steelpillow (Talk) 10:38, 15 September 2020 (UTC)
Anyway, I have added an extra isobar per the comment in the next subtopic. I'll change the article next and also update the caption along the above lines. — Cheers, Steelpillow (Talk) 20:46, 17 September 2020 (UTC) (after forgetting to log in)
I still don't think the words "pressure differential" are the right ones to say what we're trying to say. But I can live with it, and maybe we're done with the diagram and the caption.
Regarding the text, I'd just like to defend some of the wording, starting with referring to "force" in connection with the pressure field. What it refers to is the net pressure force on a fluid parcel, given by the pressure multiplied by the unit inward surface normal, integrated over the parcel's bounding surface. Because it's an integral of the pressure over a surface, it is really correct to refer to it as a "force", not a force per unit area. For sufficiently small parcels the net force is equal to minus grad(p) times the parcel volume. I bring these details up not because I want to add them to the article, but just to set the record straight that referring to this "force on the air" as a "force" and representing it as a vector is technically correct.
So the arrows in the diagram and the forces they represent are in the direction of minus grad(p). But the text deliberately doesn't mention the pressure gradient per se and instead casts the discussion in terms of "pressure differences" and "forces in the direction from higher pressure toward lower pressure", to make it more understandable to a non-technical audience. The cited source uses the same terminology. I think this terminology suffices to get the ideas across.
I suggest we leave the text as it is except for the change I suggested on 16 September under the next subheading, substituting for the word "opposite". I'll make that change and hope that we're done with the text for now. J Doug McLean (talk) 01:42, 18 September 2020 (UTC)
Airflow velocity
@Steelpillow: I have a minor criticism of the article’s suggestion that the airspeed increases above the airfoil and decreases an equal amount below the airfoil. Your diagram tends to reinforce this view of the flow field around the airfoil. In fact, the change in airspeed above the airfoil is much more significant than the change below the airfoil.
The flow above the upper surface is sped up, while the flow below the airfoil is slowed down.
When an airfoil produces lift, there is a diffuse region of low pressure above the airfoil, and usually a diffuse region of high pressure below, as illustrated by the isobars (curves of constant pressure) in the drawing.
The arrows ahead of the airfoil and behind also indicate that air passing through the low-pressure region above the airfoil is sped up as it enters, and slowed back down as it leaves. Air passing through the high-pressure region below the airfoil sees the opposite - it is slowed down and then sped up.
It is my understanding of thin-airfoil theory that the increase in airspeed above the airfoil is equal in magnitude to the decrease in airspeed below the airfoil. However, with airfoils that have significant thickness (compared with the chord) the increase in airspeed above the airfoil is much more pronounced than any decrease below the airfoil, particularly at high lift coefficients. With a real wing on a real airplane the speed of the air below the wing is not much different to the speed of the air in the free stream.
Refining the text will be relatively easy to more accurately describe this aspect of the flow field around the airfoil. It would be ideal if your diagram more clearly illustrated that the pressure gradients existing above the airfoil are more significant than those below the airfoil. Dolphin(t) 12:26, 14 September 2020 (UTC)
I understand your point. However the diagram does not show speed, it shows pressure distributions and, by implication, accelerations. A higher acceleration only corresponds to a higher speed if it is kept up through enough isobars, and that is not what this diagram is trying to show. Trying to make acceleration vectors double as velocity vectors would not go well. I think the issue with the text is similarly about explaining one thing at a time. It is consistent with varying speeds above and below, but is the middle of this quite complex discussion the right place to introduce that? Indeed, a separate drawing showing airflow velocity vectors, alongside an accompanying discussion of that aspect, might be a more useful way to make/maintain the distinction. — Cheers, Steelpillow (Talk) 13:45, 14 September 2020 (UTC)
I would support adding a description of the unequal-differences aspect of the flow field brought up by Dolphin, but I don't think this section of the article is the right place for it. This section is intended as a qualitative physical explanation of lift. The effect that Dolphin describes isn't an essential part of the mechanism of lift generation. So I don't think it fits well in this section.
I don't think the quoted text really implies that the speed changes above and below are equal-and-opposite, though the word "opposite" under the third bullet might imply that to some readers. Perhaps the last sentence there should be changed to "Air passing through the high-pressure region below the airfoil is slowed down as it enters and then sped back up as it leaves". I'd support "refining the text" to this limited degree.
The isobar diagram in question already implies larger differences on the upper surface than the lower surface by showing three contours below and four above, though it would give a more accurate impression if we skewed those numbers further (three and six?). Showing the outermost contours reaching comparable distances above and below the airfoil, as Steelpillow's diagram does, is realistic. Small-disturbance theory tells us that in the far-field limit corresponding contours above and below the airfoil (representing equal-and-opposite increments from ambient pressure) are mirror images of each other and thus extend to the same heights above and below.
Otherwise, I think the explanation is okay as is. A region of increased pressure below the airfoil is always part of the picture no matter how thick the airfoil is, and the explanation treats this feature at the appropriate level of detail. I don't think it's relevant to the explanation that the changes in pressure below the airfoil are smaller in magnitude than the changes above. So I think our explanation and isobar diagram represent reality well enough for purposes of our explanation. They're also consistent with the cited source.
I think the explanation section is okay as is, with a small change to the text and possibly a few more contours added above the airfoil in the isobar diagram. I don't support adding a description of the unequal-differences effect to the explanation section. If we want to add one, I think it would fit best in the "Pressure differences" subsection. J Doug McLean (talk) 20:37, 16 September 2020 (UTC)
How is lift generated
It seems to me that some of the text in this article is misleading and too complex for a layman to understand. The simplest explanation I can give is that a wing is like a venturi tube with one side missing, as the air flows over and under the wing, the greater camber on top causes the airflow to speed up so it can meet the same molecule of air flowing under the wing when they both arrive at the trailing edge. This increase in speed drops the pressure over the top of the wing and the wing is virtually sucked up. The greater the camber the greater the pressure drop and the greater the lift. This is why large aircraft have leading and trailing edge devises to increase the camber and generate more lift at slower speeds when the clean wing would require a greater speed to generate the same lift. The horizontal stabilizer on most aircraft is actually an upside down wing, it generates lift downward to provide stability, the camber on the horizontal stabilizer is on the lower surface. Avi8tor (talk) 07:15, 6 November 2020 (UTC)
I do agree that the article has grown overly technical and pedantic to be a good first introduction and it is probably time to fork such an introduction off as a separate article. Witness the fact that you missed or misread the various sections dedicated to explaining why your "simplest explanation" is both inadequate and contains a classic myth. (The Venturi explanation misses both Newtonian and circulatory contributions. Your mistake is to assume equal transit time; circulation theory is explicit that this is false and the upper air transits faster than the lower. The downforce on the tail is off-topic, being about stability and not lift, and is also another classic myth.) — Cheers, Steelpillow (Talk) 09:50, 6 November 2020 (UTC)
I agree with Steelpillow.
Avi8tor appears to believe our article should focus on the simplest explanation available. Wikipedia's objective is to present the explanation(s) that are given by reliable published sources so that those explanations can be independently verified - see WP:VERIFY. Wikipedia's objectives do not include the simplest explanation.
The statement "the greater camber on top causes the airflow to speed up so it can meet the same molecule of air flowing under the wing when they both arrive at the trailing edge" is the universally discredited equal transit time theory - see Lift (force)#False explanation based on equal transit-time. Dolphin(t) 11:18, 6 November 2020 (UTC)
I agree that some of this article is too complex for a layman to understand. My sense is that most readers' eyes will glaze over after a section or two. Perhaps some trimming is in order - we're not building a time-capsule of all extant human knowledge, so it's not necessary to include everything that can be said about the subject.
Looking at the article as it stands, I see that circulation theory has been moved out to the provinces. Clancy sees fit to introduce circulation in Chapter 4 on Fundamentals of Air Flow, Page 34; "it is intended here to set out a physical outline of [circulation] theory in order to provide a convincing account of the mechanism whereby lift is created." Amen to that. It comes immediately after Bernoulli. Lacking such a preamble, no wonder our current treatment is unconvincing. Yet when I moved our discussion of it up to the equivalent position a while ago, it was reverted back to the sticks. Why? Should we not learn from such sources and follow their example? — Cheers, Steelpillow (Talk) 18:11, 6 November 2020 (UTC)
Presently, circulation is treated under "Mathematical theories of lift" which is where I think it belongs. Attempts to explain lift via circulation in non-mathematical terms are rarely successful, and K-J theorem really only applies in limited circumstances.
As Anderson puts it in "Introduction to Flight" :
A third argument, called the circulation theory of lift, is sometimes given for the source of lift. However, this turns out to be not so much an explanation of lift but rather more of a mathematical formulation for the calculation of lift for an airfoil of given shape. Moreover, it is mainly applicable to incompressible flow.
Our placement seems to be in accord with this view. Mr. Swordfish (talk) 19:33, 6 November 2020 (UTC)
I entirely agree with Anderson that a mathematical approach is necessary to full understanding; that is true of most aerodynamic theory. But his remark on incompressible flow also applies to Bernoulli; give a supersonic wing camber and you may find that you reduce its lift. I agree with you that down in the mathematical jungle is where such mathematics belongs - Clancy slips some down to Chapter 7 and avoids the full treatment altogether. But introductory concepts are customarily low on mathematics and I find Clancy's introductory treatment eminently clear and useful. Your suggestion that "Attempts to explain lift via circulation in non-mathematical terms are rarely successful" clearly does not apply to him. Nor need it apply to us. Your codicil that "K-J theorem really only applies in limited circumstances" is in conflict with Clancy's treatment of it (Chapter 7) as a very general principle. It also misses the point that the Kutta condition applies more or less universally. All in all, your arguments are just not supported by the sources. Even if you consequently feel unable to provide an introductory-level explanation, why obstruct others from doing so? — Cheers, Steelpillow (Talk) 20:40, 6 November 2020 (UTC)
A very good discussion. I agree lift generation is a mix of a number of complex interactions, the angle of attack being one of them. Symmetrical wings also generate lift, mainly from the angle of attack which is also how lift is generated upside down. Supersonic lift is another subject, but from my recollection Concorde generated lift at low speed from vortex generation on the upper surface, this did not disappear until about 400 knots indicated airspeed. Concorde also could not land without autothrottle, if the speed got below a critical point no amount of power would accelerate the aircraft. Most people reading this article need the simple explanation first, followed by the other complexities and laws. You can see the analogy of lift in a sailboat, originally sailboats needed the wind from behind, then someone realized that trimming the sails like a wing relative to the wind direction, generated a force (lift) that propelled the boat along, counteracted by the keel. On all aircraft winglets are now common, primarily because they reduce drag, they also allow for a greater theoretical wingspan with the wing camber washed out, preventing flow from the higher pressure area under the wing flowing around the wingtip to the top of the wing, leading to vortex generation and consequently drag due to airplane movement. Avi8tor (talk) 07:50, 7 November 2020 (UTC)
Steelpillow, my understanding is that while circulation can be defined for any vector field and any closed path, it is only in certain circumstances such as 2D potential flow where circulation is (basically) independent of the integration path. i.e. for 2D potential flow, as long as the path encloses the foil, the value for circulation will be the same. This is not necessarily true for arbitrary vector fields. That is to say, the idea of a general circulation value applicable to the entire flow field (as opposed to a value based on a particular integration path) is not realistic for arbitrary vector fields. So, I'm not sure if it is possible to apply the K-J theorem to those flow fields.
That said, you say that Clancy treats it as a "very general principle". I have not read Clancy, so I can't say one way or another. However, I have just ordered a copy and will have more to say once I've had a chance to read the referenced material. It may be a week or two. Meanwhile, there's some interesting discussion over at the Circulation_(physics) talk page that may be germane to our treatment of it here. Mr. Swordfish (talk) 19:57, 7 November 2020 (UTC)
Why do the streamtubes narrow?
An editor has placed a [why?] tag after the sentence "The upper streamtubes constrict as they flow up and around the airfoil."
This is understandable, since the usual "conservation of mass" explanation does not explain why the streamtubes narrow (although sometimes they include a nonsensical non-reason related to obstruction). This is treated in the following section "Limitations of the simplified explanations", although the article doesn't supply a neat tidy reason because, as stated in the source material, there isn't one.
In previous discussions here on the Talk page I have advocated placing the material on limitations immediately after each simplified explanation instead of collecting them together later. Perhaps that's something to reconsider.
In the meantime, I'm inclined to simply say something along the lines of "Experimental results show that the upper streamtubes constrict as they flow around the airfoil." Granted, this doesn't explain why, but it does explain why the article says so and perhaps is an improvement over simply stating the fact without giving a reason. This should allow us to remove the [why?] tag. Other opinions cheerfully considered. Mr. Swordfish (talk) 13:36, 31 January 2021 (UTC)
@Mr swordfish: I think your insertion of the words "Experimental results show that the upper streamtubes constrict as they flow around the airfoil" is entirely satisfactory, and about as good as we can get for use in this kind of article. I have been thinking about this for a few months and I have a more advanced explanation that is unnecessarily esoteric for this article but it should demonstrate that your words are accurate and reasonable.
An abundance of experimental evidence shows that the steady flow of incompressible fluids about solid bodies, including airfoils, is similar to lines of magnetic force in the vicinity of a magnet, and lines of electrostatic force around a charged body; and when described mathematically these fields are solutions to Laplace’s equation. Consequently the steady flow of an incompressible fluid in the vicinity of an airfoil can be accurately modeled using Laplace’s equation for irrotational flow.
Laplace’s equation demands that any model for the irrotational flow of a fluid is based on velocity profiles that are smooth – a velocity profile that contains a discontinuity would immediately be rejected because it cannot be a solution to Laplace’s equation. I think this is also a consequence of the definition of irrotational flow - that the curl of the velocity is zero everywhere. (The no-slip condition is a qualitative way of saying the same thing – there can be no discontinuity in velocity profiles.)
It is possible to draw a diagram of an airfoil surrounded by a flow field in which streamtubes don’t narrow where the flow speed increases. (However, such a flow field would not satisfy Laplace’s equation so we must reject it.) Imagine a bundle of pipes, all of the same diameter, bound tightly together. Fluid is flowing through these pipes, but the speed of flow in each pipe is unique. The speed of flow in each pipe would be different to the speed in neighbouring pipes. The velocity profile across this bundle of pipes would look like a bar chart. Looking at the bar chart it would immediately be obvious that the velocity profile contains many discontinuities – if there are n pipes there would be n-1 discontinuities. Such discontinuities cannot be part of any solution to Laplace’s equation. (Also they defy the no-slip condition.)
To be a solution to Laplace’s equation, and to conform to the no-slip condition, all velocity profiles must be smooth – no discontinuities. The fluid is incompressible so where the fluid velocity is increasing the streamtube must be narrowing, and where the velocity is decreasing the tube must be expanding. This is the only model that will satisfy Laplace’s equation so we must continue to assume that it is the only model that will reflect the reality of steady flow of an incompressible fluid. Therefore I think your choice of words is reasonable. Dolphin(t) 13:18, 14 June 2021 (UTC)
Pressure gradient coexistent with curved flow explained in addition to Bernoulli related factors
I'm wondering why this hasn't been brought up yet. From a wings frame of reference the airflow is curved (diverted), coexistent with a pressure gradient where pressure decreases perpendicular to the flow towards the center of curvature. In a typical case, above a wing, the pressure gradient is from ambient to lower pressure, and below the wing, from higher pressure to ambient. At the same time, there is a coexistent Bernoulli relationship between pressure and speed of the flow, corresponding to the pressure related to the pressure gradient along the streamlines. The article can go into details about how a wing curves the flow (such as why flow tends to remain mostly attached to convex surfaces within reason (without significant separation of flow)), but it seems enough to just note that a wing curves (diverts) the air flow. Rcgldr (talk) 16:00, 13 July 2021 (UTC)
You are describing the explanation of lift presented so well by Holger Babinsky. Reference No 61 is a citation of Babinsky’s work. See under Lift (force)#Pressure differences. Dolphin(t) 22:24, 13 July 2021 (UTC)