
Talk:Climate change/Archive 81
| This is an archive of past discussions. Do not edit the contents of this page. If you wish to start a new discussion or revive an old one, please do so on the current talk page. |
| Archive 75 | ← | Archive 79 | Archive 80 | Archive 81 | Archive 82 | Archive 83 | → | Archive 85 |
Which figures can go?
I know that multiple people here have worked their asses off to get good quality figures in this article. Unfortunatly, we now have too many according to one of the TFA coordinators. Specifically, we're not complying with the manual of style: MOS:SANDWICH. I will be deleting some figures boldly, and that may hurt. If you disagree with any of my choices, please put forward other figures that should be deleted instead. Femke Nijsse (talk) 12:59, 27 March 2020 (UTC)
- The article was getting ~choppy in appearance, I appreciate the wise selections you've made this morning. Efbrazil, especially, has provided both substantive content, format standardization and SVG adaptation.
- Separately, I'm worried that non-scientists visiting during any review process will exalt form over substance. This science-intensive article needs to visually project the abundance of solid scientific support—while presenting it in a way that is immediately absorbed by laymen.
- My first impulse was to delete some of the "heart-tugging" pictures (e.g., polar bear), but those images are further down, in less crowded locations in the article. I doubt deleting them would affect any reviewer's opinion.
- As far as specifics:
- - I think that File:CO2 Emissions by Source Since 1880.svg and File:Carbon Sources and Sinks.svg don't add much to the much-needed File:Carbon Dioxide 800kyr.svg that precedes them in the important "Ghg" section. I think that only the 800kyr graph should remain, since the other two can be readily expressed in text.
- - I plan to right-justify some images where possible to reduce zig-zags.
- - Using the multiple image template to arrange images horizontally (preferably right-justifying) avoids text-chopping. Is there a problem using this template?
- ——RCraig09 (talk) 16:15, 27 March 2020 (UTC)
- There is still bad sandwiching in the Physical drivers of recent climate change section. Also, a MOS review is needed. Check WP:NBSPs, and also there are missing convert templates. SandyGeorgia (Talk) 16:35, 27 March 2020 (UTC)
- @Efbrazil: Sorry for semi-undoing your edit. If you add any graph back, please suggest another graph to remove instead, to make sure that images aren't all pushed down to the wrong section. Femke Nijsse (talk) 19:12, 27 March 2020 (UTC)
- The current effects section is horribly full and overflows into the next section at quite a few higher resolution settings. Efbrazil, which figure would you be okay with deleting? Femke Nijsse (talk) 19:35, 27 March 2020 (UTC)
- @Efbrazil: Sorry for semi-undoing your edit. If you add any graph back, please suggest another graph to remove instead, to make sure that images aren't all pushed down to the wrong section. Femke Nijsse (talk) 19:12, 27 March 2020 (UTC)
- @Femkemilene: I'm fine with cuts and moves, but when I checked in this morning the article was really a total mess- distorted graphics, key graphics cut, and so on. Part of how things appear is related to your screen resolution and device. Having a more clear definition of the problem here would help. Please don't stack graphics in a block unless it's essential.
- Cuts I'm OK with: The flowchart at the top about causes and effects- for now, I just moved it down and moved the greenhouse effect graphic up to make more room in the physical drivers section and because I think Craig's graphic is better presented after we lay out more hard data. My apologies to Craig. I cut the sad polar bear, I think it was both biasing and ineffective, I'm glad it's gone. The unclear ship tracks picture can also go, although I left it for now. I'm also OK with the cuts already made to remove the latitude chart and the animation of planetary temperature changes. Finally, I'm fine moving the remaining graphics around to different areas.
- Cuts I'm not OK with: The chart of carbon sources and destinations is key for understanding the full picture of carbon in the atmosphere. Just talking about where CO2 is coming from and ignoring where it is going is telling only half the story, particularly when it comes to the issues of feedbacks and mitigation and offsets. If you want that graphic moved I'm fine with that, but please don't cut it. I also reverted the cut to see CO2 emissions by industry, land use, buildings, etc. It's an important way to break the problem down, but I moved the graphic way down in the article, so hopefully it's not conflicting anymore.--Efbrazil (talk) 19:50, 27 March 2020 (UTC)
Overview re recent changes:
- The bar charts are less valuable, to the extent they can be readily expressed in text.
- The carbon cycle graphic shows internal mechanisms of GW rather than the causes and effects that readers likely seek, but what was subordinated to the 'Effects' subsection without response to my repeated arguments above and before Femke even expressed her opinion above.
- Instead of being in the lede—which is supposed to be summary—the carbon cycle graph is properly placed in the now-full 'Models' section, but the 'Models' section can be streamlined by choosing either the RCP line graph or the dual heat map, the latter being more illustrative of essentially the same information. —RCraig09 (talk) 20:03, 27 March 2020 (UTC)
- Yeah, I didn't want to move the causes and effects chart, but after seeing the massive changes this morning I figured it was open season to try and move things around in a way to make more space. I do think femke needs to express an opinion on the causes and effects graphic. We also need real clarity on the problem here before we make more cuts and moves- I don't want to just wildly cut stuff in the hopes of fixing a hypothetical problem. On both my desktop and smartphone everything looked great yesterday, then all these edits happened, and this morning it was a mess. What exactly was the problem and how do we know we've been successful addressing it? I have to go offline for an hour or two, will then check back in. Efbrazil (talk) 20:15, 27 March 2020 (UTC)
- I think we've build up enough trust with each other that very bold edits are okay.
- Yesterday, we had four WP:SANDWICHES. I'm usually looking at the page from my desktop, but on a smaller screen sandwiches are really ugly (even though less common). There was barely any space left on the right, so the only logical conclusion is that we need to cut figures.
-
- There were a lot of figures about CO2 emissions. I don't have that strong of an opinion about which ones should stay or not, as long as we have them in logical places, which is in the GHG subsection, in mitigation and maybe in political response. I'm against putting one of these figures (about GHG emissions per sector) in the controversy subsection.
-
- Considering the causes and effects graph is big, many of these problems could be solved if we decide not to use the graph in this figure. I'm not a massive fan of the figure, because of its size, and because it's a lot of text. To some extent and saying it crudely, the figure is a flow diagram of a part of the table of content.
-
- I'm okay with the polar bear to go, but I think it's extremely important to have a good balance between photos (normal public) and diagrams (more geeky public). ~
- P.S. Also, I've been repairing a lot of cites lately. Could you try guys try to stick to the cite var? Femke Nijsse (talk) 21:23, 27 March 2020 (UTC)
- > I agree about the CO2 (and other) bar charts; but the carbon cycle picture is very illustrative, in a proper place.
- > I still think that File:CO2 Emissions by Source Since 1880.svg and File:Carbon Sources and Sinks.svg (~expressible in text) don't add much to the eye-opening File:Carbon Dioxide 800kyr.svg.
- > Please consider: The cause/effect diagram shows more content than the Table of Contents, shows causal paths as no ToC could, and constitutes a concisely crafted detailed summary of what readers are seeking (causes and effects)—all in plain language. Do you not agree: it has more pertinent content per cm2 than anything else in the entire article? This is why the diagram is so uniquely valuable. If attached to the lede, it would appear beside the Table of Contents and not "push other content down" as it would if positioned lower in the body. —RCraig09 (talk) 22:29, 27 March 2020 (UTC)
- I moved the one graphic on carbon destinations down towards the bottom and tried to clarify why the other graphic on carbon sources is important. Suggestion on the cause-effect graphic: We take some time making it even better than it is now, then look at bumping it back to the top when that work is done. I'm happy to do the additional work on the graphic or to critique the graphic and have you do the additional work. Efbrazil (talk) 00:03, 28 March 2020 (UTC)
- Shout out to the graphics wizards! Just wanted to express my admiration and appreciation to Efbrazil, as well as Femke Nijsse, and RCraig09 for the fantastic work you all have done in creating so many wonderful graphics for this article.Dtetta (talk) 03:48, 28 March 2020 (UTC)
- I've removed the RCP figure per suggestion RCraig (nobody objected (yet)). There are still two major problems remaining, with (1) three GHG figures not being in the right location and (2) figures still being pushed down into different sections on common resolutions. I propose
- We delete the global energy consumption graph, as the information is similar to carbon dioxide per source. I think the latter is better suited for the necessary small depiction of a Wikipedia article.
- We either delete (preferred) or move the emissions per industry. The scientific discussion is tangibly related, so they could be placed there. Of the two figures RCraig propose we delete, I mostly agree with Carbon Sources and Sinks. The carbon cycle is important, but this graph does not communicate one of the essentials: how the fraction of CO2 between these three reservoirs (ocean, sea, vegetatation) might change over time.
- If we keep the big overview graph, the most logical place is indeed the lede. I'm a bit concerned that the lede then would have too many images. The MOS is not clear about it I think, but uses the singular (image, not images) when describing the lede: MOS:LEADIMAGE. Before we start more work on it, we'd need some clarification. Femke Nijsse (talk) 09:25, 28 March 2020 (UTC)
- > Femke, I'm having trouble understanding exactly which images you're talking about in the first and second ● paragraphs (09:25). Can you change your description to recite literal titles? (if they're still in the article)
- > Re the "big overview" (cause/effect?) graphic: MOS:LEADIMAGE concerns style, and I think substance should trump style, especially in this important article that is properly rich in content about causes/attribution/drivers, degree-of-warming, and effects etc. Specifically: I think the (highly instructive)
carbon cycle graph ("Greenhouse effect schematic" is too specific for the lede and, conceptually, fits best in the "Models..." section. —RCraig09 (talk) 16:20, 28 March 2020 (UTC)- Femke, please specify the "common resolution" you are having problems with so I can trouble shoot. Everything looks good at 1024 by 768 and at higher resolutions and on smartphone. I'm just not seeing the problem you are trying to solve, and I can't fix things or agree to graphic removals until I see the problem. There may be ways to change graphics sizes or otherwise fix things here. The RCP graphic needs to stay, and I don't support the removal of any graphics until I see the problem we need to solve. Efbrazil (talk) 17:00, 28 March 2020 (UTC)
- I'll reiterate with proper links:
- We delete File:Global_Energy_Consumption.svg, as the information is similar to File:CO2_Emissions_by_Source_Since_1880.svg. I think the latter is better suited for the necessary small depiction of a Wikipedia article.
- We either delete or move: File:Greenhouse_Gas_Emissions_by_Economic_Sector.svg
-
- My screen res on my desktop is 2144 X 1340. I often compare that to my laptop with 1408 X 792. Which means I have to zoom out to like 60-70% on my laptop to simulate my desktop resolution. We've done quite a lot already with summarizing captions to make space, which was probably necessary anyway. I'm not keen on making graphics much smaller, but we can try. As long as there easily readible still.
- I don't think the GHG schematic fits best in models really.. It was fine where it was originally, explaining the cause of GW.
- Style is there to support substance and one of my philosophies is 'less is more'.
- Bit of terminology. The carbon cycle is how carbon/CO2 moves between soils, vegetation, air and ocean. The greenhouse gas effect schematic shows how energy in the form of radiation moves between the surface and outer space. Femke Nijsse (talk) 17:26, 28 March 2020 (UTC)
- The thing I was not checking was ultra high definition monitors. I'll look to make edits in that direction today. File:Global_Energy_Consumption.svg is essential for understanding how renewables are performing relative to other energy sources, and to understanding performance in recent times relative to Paris. It should not be deleted. I already moved File:Greenhouse_Gas_Emissions_by_Economic_Sector.svg once, I'll double check appearance. When you say "I don't think the GHG schematic fits best in models really" I think you mean the opposite, right? What do you suggest for the third graphic at the top? I'm concerned about putting in the flowchart in its current state. I suggested the country performance chart, but Craig thought we should keep the focus on the problem in the intro, not the mitigation. Efbrazil (talk) 17:58, 28 March 2020 (UTC)
- > I actually prefer File:Global Energy Consumption.svg over "Emissions by source..." since, even on iPhone the general shape of the column charts is clear. Meanwhile, File:CO2_Emissions_by_Source_Since_1880.svg doesn't really present much more information than its text caption, is less demonstrative than the 800,000 year chart above it; removing "Emissions by source..." would make a good home for the excellent GH Effect diagram.
- > It's the Physical drivers (causes?) section that is crowded, which is why I suggested the excellent "GH Effect" graphic could also go to the "Models..." section. GH Effect should stay, somewhere, as I don't think the public truly understands the GH Effect.
- > If "GH effect" goes to "Models..." then "Models..." becomes crowded, which brings up how the RCP line graph overlaps with the "CMIP5 projected changes" heat map. I actually favor the heat map because the line graph's "output" (dependent variable) is CO2 Equivalent, which is an intermediate mechanism causing the final, important effect—which is the heat map.
- > Femke, I am just afraid that style could conflict with substance here.
- > Efbrazil, I'm not sure what you mean by "the problem"... I think that in a "GW" article, GW's causes and effects should be in the lede—not coincidentally, that's what's in the lede text—rather than drilling down to different countries' "Responses" which is a step beyond effects.—RCraig09 (talk) 18:11, 28 March 2020 (UTC)
- A good 20% of desktop users have a high res (1080 X 1920) (upon double-checking, mine is 1200 X 1920).[1], and >10% of all users, so we should definitely take that as one of the reference cases.
- The reason I prefer File:CO2_Emissions_by_Source_Since_1880.svg over File:Global Energy Consumption.svg is that it's a bit less busy to the eyes. {{u|Efbrazil, would you consider cutting the words 'for oil' from the latter, to make it less busy. I don't think they are necessary. I'm okay with either though.
- @Efbrazil, I meant the GH schematic, which doesn't fit the model section as good as the other two candidates. Femke Nijsse (talk) 18:53, 28 March 2020 (UTC)
- I'll reiterate with proper links:
- Femke, please specify the "common resolution" you are having problems with so I can trouble shoot. Everything looks good at 1024 by 768 and at higher resolutions and on smartphone. I'm just not seeing the problem you are trying to solve, and I can't fix things or agree to graphic removals until I see the problem. There may be ways to change graphics sizes or otherwise fix things here. The RCP graphic needs to stay, and I don't support the removal of any graphics until I see the problem we need to solve. Efbrazil (talk) 17:00, 28 March 2020 (UTC)
- I've removed the RCP figure per suggestion RCraig (nobody objected (yet)). There are still two major problems remaining, with (1) three GHG figures not being in the right location and (2) figures still being pushed down into different sections on common resolutions. I propose
Efbrazil: the reason we had to start this whole discussion was because people at WP:TFAR made clear we don't comply with WP:MOS' WP:SANDWICH; having text sandwiched between a figure on the left and on the right. We started with four sandwiches, and have now increased that to 6 on my screen (adjusted to 1920 X 1080 to be a reference case). Femke Nijsse (talk) 20:09, 28 March 2020 (UTC)
- When in doubt, default everything to the right. If an article is too crowed with pictures, you can't frequently shift alignments, because you can't account for every monitor size no matter how well you try. GMGtalk 20:33, 28 March 2020 (UTC)
Edit pass and standards for images
I took a pass based on the discussion above, please let me know if you think it's acceptable. These were my goals:
- We shouldn't sandwich text when there's only a few words between images and it looks stupid. This generally means having about 3 paragraphs between images. Sandwiching on laptops should be minimal or none at all.
- On a high definition desktop monitor where the width of the screen means there's plenty of space between images for text then it is fine for the text to be sandwiched, but we don't want graphics to be stacked out of scope into the next section.
- On smartphone, which is most users, we want to make sure the images appear in contextually appropriate locations and with good frequency (no wading through a sea of text). Smartphones are how the majority of users view the content so we need to prioritize that view.
These are the general changes I made:
- I reduced size on all graphics from upright=1.5 to upright=1.35, which guidance says is the max recommended size for graphics in the lead. It looks great on high definition screens and solves some of the stacking and sandwiching. The down side is pixelated text on low resolution screens that really requires clicking through to read. It doesn't impact smartphone rendering.
- I tightened up the captions on several images, moving some text to image summaries.
- A lot of moving images left and right, a little up and down.
I would rather not see further cuts to images, but if more cuts are made let's please have a discussion first. I think you know my preferred cut is the causes and effects flowchart, as per the long discussion in the other section. Efbrazil (talk) 21:57, 28 March 2020 (UTC)
- Wow, that looks professional all of a sudden, thanks. We're technically allowed to have the figures a bit larger in the body if necessary. I didn't expect this to work for most figures, but it did. However, we can still make some further improvements: (ignore if you don't agree)
- File:Greenhouse_Effect.svg. Will be difficult to up the fontsize, but might be worth a try
 Done I upped the font a little bit and changed the font style to match other graphics. Doing more would require changing the image content, which would be difficult--Efbrazil (talk) 17:40, 30 March 2020 (UTC)
 - File:Common_Era_Temperature.svg. We already had a discussion whether the confidence interval should go. I'm now even more in favour of putting this in the image description @Femkemilene: Should I just rebuild the graphic without the confidence intervals? Please point me to the data if so. I think leaving them in the image but then not saying what they are is a mistake.--Efbrazil (talk) 17:40, 30 March 2020 (UTC)
- It's done quite often in scicomm, for instance in Ed Hawkins' communication: https://www.climate-lab-book.ac.uk/2020/2019-years/. The data wasn't in the easiest format if I recall correctly and the code I used to make it seems to be corrupted now :(. Femke Nijsse (talk) 18:28, 30 March 2020 (UTC)
- I can rebuild from this data set using "31-year filtered full ensemble median" and ignore the error range info in the graph, plus switch to nasa 5 year mean data in 1880 (like the graph does now). Good?--Efbrazil (talk) 21:03, 30 March 2020 (UTC)
- @Femkemilene: I rebuilt the graphic using that data, let me know if you see a problem. Getting way into the weeds, one issue that took a while was figuring out how to adjust data so that it is baselined to the 1850-1900 average as per the IPCC, to match all the other graphics. The 2000 year data set says it is normalized to the 1961 to 1990 average, so you can make an adjustment based on NASA's estimated average temp for that time. Another way to do it is to adjust the data set so that the data points from 1860 to 1890 are an average of zero (since it's a 30 year moving average, I figure that narrower range best approximates 1850 to 1900). Unfortunately, the numbers through the 2 methods are about 0.09 degrees apart. I went with the NASA adjustment as it seems to line up with the NASA data better where the lines overlap and is also a crisp definition. End result being that the 2000 year line moved down by about 0.1 degree from the prior graphic. Efbrazil (talk) 23:52, 30 March 2020 (UTC)
- I can rebuild from this data set using "31-year filtered full ensemble median" and ignore the error range info in the graph, plus switch to nasa 5 year mean data in 1880 (like the graph does now). Good?--Efbrazil (talk) 21:03, 30 March 2020 (UTC)
- It's done quite often in scicomm, for instance in Ed Hawkins' communication: https://www.climate-lab-book.ac.uk/2020/2019-years/. The data wasn't in the easiest format if I recall correctly and the code I used to make it seems to be corrupted now :(. Femke Nijsse (talk) 18:28, 30 March 2020 (UTC)
- I'm not sure if it would help at this point, but I've posted links to five different datasets (with non-adjusted and adjusted data listings) on the Wikimedia file page of a graph I did recently: File:20200324 Global average temperature - NASA-GISS HadCrut NOAA Japan BerkeleyE.svg. —RCraig09 (talk) 03:19, 31 March 2020 (UTC)
- Looking further at the graph, I'm getting somewhat unconfortable that the confidnece interval isn't in it. The uncertainties are significant, and I feel like cheating for not making them known. Can we do a single confidence interval (say 90% of 95%?). And then putting the info in the image description. Femke Nijsse (talk) 14:54, 5 April 2020 (UTC)
- I'm not sure if it would help at this point, but I've posted links to five different datasets (with non-adjusted and adjusted data listings) on the Wikimedia file page of a graph I did recently: File:20200324 Global average temperature - NASA-GISS HadCrut NOAA Japan BerkeleyE.svg. —RCraig09 (talk) 03:19, 31 March 2020 (UTC)
- File:Greenhouse_Effect.svg. Will be difficult to up the fontsize, but might be worth a try
- File:Carbon_Dioxide_800kyr.svg. I could try to up the font size the tiniest bit and choice a better colour for the orange bit. Done Femke Nijsse (talk) 16:32, 29 March 2020 (UTC)
- File:Projected_Change_in_Temperatures_by_2090.svg drop the space between RCP and number? Done Also done to the RCP graphic next to it. --Efbrazil (talk) 17:40, 30 March 2020 (UTC)
- File:20200118_Global_warming_and_climate_change_-_vertical_block_diagram_-_causes_effects_feedback.png unreadable unfortunately. I fear it has to be upped in size (not allowed in lede), redesigned or removed.
- File:Total_CO2_by_Region.svg and similar. Remove the 'for oil' in the text, and up the font a bit? Done "for oil" and also "for russia" both gone, but I couldn't up the font size without changing layout for all the bar charts, and I didn't think the change was worth all the work to do that. --Efbrazil (talk) 17:40, 30 March 2020 (UTC)
- File:Mitigation_pathways.svg I could move the <1.5 and <2.0 into the graph and make them bit bigger. Done. I also tried to make the text editable. --Efbrazil (talk) 17:40, 30 March 2020 (UTC)
- File:Greenhouse_Gas_Emissions_by_Economic_Sector.svg the agriculture & forestry Femke Nijsse (talk) 12:35, 29 March 2020 (UTC) Done I assume you mean cut that text, which I did--Efbrazil (talk) 17:40, 30 March 2020 (UTC)
- Thanks Femkemilene! I'll take a crack at those image tweaks over the next few days.
- @Craig: How do you suggest we address the issue with the block diagram readability in thumbnail view? That was one of the major things I was struggling with when I was trying to compress it for SVG. There's really not enough room to show 3 columns of text, which is how the current diagram is structured. That's the main reason I went to the table view- if the focus here is on text then it makes sense to use a view that is built for text, not for images. Other thoughts? Efbrazil (talk) 15:30, 29 March 2020 (UTC)
- Sorry, I added my 15:37 comment before seeing your 15:30 comment. I will think about it (big change). —RCraig09 (talk) 15:38, 29 March 2020 (UTC)
- On first impression, I ~could re-arrange the cause/effect flow diagram's content to be in only two columns, but given the efficient packing of the blocks now, such a change would make the graphic about 50% taller, and make causal paths less immediately evident. Substantively I abhor oversimplifying the effects, as the graphic now contains what sources disclose at a high level. As I explain above (diff), the red/green/blue regions' large labels themselves immediately impress that GWs effects have a wide range, and I think it's reasonable to expect those readers who have high-pixel-count screens to simply click to enlarge if needed. —RCraig09 (talk) 16:58, 29 March 2020 (UTC)
- File:Carbon_Dioxide_800kyr.svg. I could try to up the font size the tiniest bit and choice a better colour for the orange bit.
- Thank you both for massive amounts of coordination work done here. I've added an "issues" table, above, re the cause/effect flow diagram.
- Efbrazil, can you point me to the source that tracks viewing, to know that smartphones are main readers of WP articles? —RCraig09 (talk) 15:37, 29 March 2020 (UTC)
- Here's a good usage breakdown Efbrazil (talk) 15:49, 29 March 2020 (UTC)
Replacing Greenhouse Effect Schematic


I've been working on replacing the existing (old) greenhouse effect schematic (third graphic in the article). As you'd expect, there's some very good content out there on the Web trying to describe the greenhouse effect, but none of it seemed to hit the goals I had for the graphic, which were to:
- Create a graphic legible at thumbnail / smartphone size
- Show how the greenhouse effect works
- Show fossil fuel combustion as a primary driver for the greenhouse effect
- Showcase the most convincing evidence, including:
- Show radiative imbalance- it's a simple equation between how much energy the Earth takes in vs how much it emits
- Show how fossil fuels make the upper atmosphere colder and the lower atmosphere warmer
- Make it all as simple as possible, stripping out stuff like reflected light or land use that aren't primary drivers
That's how I ended up with the graphic. Thoughts on goals?
I thought about going in the direction of this graphic first: https://miro.medium.com/max/1400/1*58aKfoSmb_hj4zFz0Egt6g.jpeg. I backed off of that as it's kind of inaccurate, as IR doesn't "bounce" like that, it's absorbed and then re-emitted. Other graphics show that, but then they kind of turn into a muddle as they show particles emitting heat rays in every which direction. The graphic also fails to show key evidence or the contribution of fossil fuels.
I also looked at more complete graphics like this one which I really like: File:The-NASA-Earth's-Energy-Budget-Poster-Radiant-Energy-System-satellite-infrared-radiation-fluxes.jpg. Those are great for understanding the climate system more completely, but much of it doesn't apply to climate change directly, and of course they are more powerpoint graphics than smartphone / thumbnail graphics.
Anyhow, thoughts on replacing the existing graphic with the new one? I'm not sure if it's as good as it can be, but I convinced myself it's better given the goals than other graphics.
References
- ^ Kevin E. Trenberth and John T. Fasullo (5 October 2016). "Insights into Earth's Energy Imbalance from Multiple Sources".
{{cite web}}: Invalid|ref=harv(help)CS1 maint: url-status (link)
- A noble effort at a difficult task!
- I agree: the two 'alternative' graphics you reference, are either too simple or too complex.
- It took me a while to figure out what the "jagged gray thing" is, even after reading your description above.
- In terms of flow, maybe the gray arrow could point directly up to GHGs in the atmosphere, which in turn could point directly to the hot thermometer to indicate, well, global warming. :-)
- (The GHG text had two inputs and no outputs! You'll freak out coders and engineers!)
- Tech details (watts/m2) aren't helpful to an average reader (about 4.7 million views in the last year).
- I'm not sure if it's feasible, but the width of arrows can represent the quantity of the entity passing through the arrow, in our case, light or heat energy. That's one feature I liked about the upper right portion of the first graphic File:Greenhouse Effect.svg. Here, the yellow sunlight arrow would be broader than the departing heat arrow.
- It may be corny, but some kind of "shield" above the GHG text could show the blocking of heat rather than text telling about it. Admittedly, probably impossible to show. The "shield" can't be a puff of smokestack smoke, since that would wrongly imply that smoke causes global warming.
- You don't need to respond to each of my thoughts, but I think my comment about "the flow" of arrows is the most important one.
- —RCraig09 (talk) 02:06, 5 April 2020 (UTC)
- I had similar thoughts as RCraig. I'm impressed by how fast you do good work :).
- I especially agree that we shouldn't quantify radiative imbalance, which changes every couple of years and is too technical.
- If there is a way to reduce text (with a shield that I wouldn't trust myself in designing, or something else), that would be great.
- The factory could be improved if there was a bit of space between the pipe and the arrow I think, so that it's clear it's two different things. Maybe the windows could be make [ https://www.google.com/search?q=factory+icon&tbm=isch&ved=2ahUKEwiJosWjvdHoAhXr4IUKHRTSDEwQ2-cCegQIABAA&oq=factory+icon&gs_lcp=CgNpbWcQAzICCAAyAggAMgIIADICCAAyAggAMgIIADICCAAyAggAMgIIADICCAA6BAgAEENQwCFYnCRgrCVoAHAAeACAAbABiAHrApIBAzMuMZgBAKABAaoBC2d3cy13aXotaW1n&sclient=img&ei=y-iJXsmQN-vBlwSUpLPgBA&bih=1054&biw=2144&client=firefox-b-d#imgrc=G5fbimkRIjmKNM like this]:
- Femke Nijsse (talk) 14:21, 5 April 2020 (UTC)
- I had similar thoughts as RCraig. I'm impressed by how fast you do good work :).
- —RCraig09 (talk) 02:06, 5 April 2020 (UTC)
Thanks for the great feedback! I made changes and swapped out the graphic.
- I replaced the factory icon with a more detailed version and added a space to the arrow. More recognizable now?
- I removed the W/m squared thing from the picture, and changed it to more clearly just say "causing global warming". I kept the number in the caption, because I find it persuasive in discussions- it's hard to argue with math and the sourcing is solid. OK to keep in the caption?
- Different sized arrows make things trickier to communicate I found. Sizing the arrows means explaining why Earth emits far more infrared energy than absorbed sunlight, it means explaining missing components of Earth's energy budget like convection and atmospheric absorption, it means assigning some value to human-emitted fossil fuels, and it means having a teeny tiny arrow for radiative imbalance (which is the main point here). Note that the old graphic I replaced didn't even show an energy imbalance- it's just kind of showing how the greenhouse effect works when things are in balance.
- I fiddled with the layout for a while. I cut the giant thermometer on the right and I pointed the fossil fuel arrow at the lower atmosphere thermometer. Hopefully better?
- How to visually convey greenhouse gases is tricky- I want it to be clear they are visually transparent and not in a cloud. I added individual atoms of CO2 and CH4 to try and show how infrared radiation is redirected- hopefully that helps and is not too technical. I also made the atoms and the greenhouse gas arrow transparent to convey that fact that the gases are invisible. Better? This visual is good and I tried adapting it but it doesn't fit with the rest of the graphic: https://commons.wikimedia.org/wiki/File:Greenhouse-effect-t2.svg
- Yeah, the diagram is wordy, but I don't see how to trim things down more. I struggled to compress it to what it is. Suggestions welcome.
Efbrazil (talk) 21:42, 5 April 2020 (UTC)
- I think things are improving, and appreciate the difficulties. Specific observations & suggestions:
- — I'm confused by the red path: Earth-->CO2-->Thermometer-->NH4-->Earth. I think the particular gases CO2 and NH4 can be omitted as too technical, leaving Greenhouse gases in the text.
- — Maybe replace the red path with: a red upward arrow from Earth to red thermometer, and a red downward arrow from "3. GHGs..." down to red thermometer. The red thermometer is trapped (as it should be)!
- — The affiliation of the "3. __" text isn't visually clear to me (ambiguous). Maybe the blue arrow can be omitted altogether, and the cool blue thermometer centered. At the same time, the "3. ___" text can moved to the right to be associated with the clear arrow, which(to save space) could go from the factory to the right side of the "2. __" text.
- — In "4. __" I think that "resulting in global warming" is more accurate than "causing". Causation occurs at lower altitudes.
- — I'm thinking that the "radiative imbalance" and watts/m2 phrase is a distraction to 90% of our readers. I perceive this as a "concept" diagram, especially in this high-level article.
- Onward! —RCraig09 (talk) 22:17, 5 April 2020 (UTC)
Thanks again Craig! I took another crack at it.
- The red path was meant to show radiation reflected back to Earth- I think it's more clear now that it's attached to temperature and feeds in from fossil fuels.
- I'd like to keep the atomic outlines of CO2 and methane as I think it's a rather cunning way to show an invisible cloud. Maybe too clever and technical, but I still like it, and I hope some viewers will appreciate it. We need to make material accessible to everyone, but the best graphics have something to offer even advanced readers.
- Yeah, the arrows were a mess, much thanks for the prodding on this! I reorganized in a way that I think is much cleaner, with less arrows going all over the place.
- Good point on "Causing" vs "Resulting in"- I changed it like you said but it's an interesting question. Radiative imbalance is caused by Earth emitting less heat to space, not by Earth absorbing more sunlight (aerosols mean we absorb less on balance). If the upper atmosphere didn't get colder, wouldn't heat exchange with space remain the same, meaning no radiative imbalance? If you think of Earth as a system, then climate change is "caused" by the upper atmosphere cooling off. On the flip side, greenhouse gases act as insulation, and the insulation is thickest in the lower atmosphere, so that's what is mostly "causing" climate change. It depends on how you think of things. "Resulting in" covers all bases, so I like it.
- I'll look to move the watts/m2 bit out of the caption and into the text somewhere. I think it's important to capture, but it doesn't need to be attached to this picture.
Efbrazil (talk) 18:21, 6 April 2020 (UTC)
- I like that it's less convoluted.
- a. One way it can be further simplified is by replacing the red arrow pointing downward from the red thermometer, with more of a 'starburst' symbol (something like File:Greenhouse-effect-t2.svg or one of these. As it stands, it looks like the entire purpose of the (heated) red thermometer is to heat the dirt rather than the atmosphere in general. A starburst better indicates spreading of heat through the atmosphere.
- b. Alternative to "a.": I miss the rounded-rectangular circuitous-arrow designation in the lower right of our old friend File:Greenhouse Effect.svg. It brilliantly captures the concept of a greenhouse trapping energy here on earth. So now, alternatively, consider a red arrow going down from red thermometer, then left, then joining the existing red up-arrow near the sunbeam.
- c. I also miss File:Greenhouse Effect.svg's diverging arrows on the right side. The different-thickness arrows brilliantly capture energy flows−without words. If the left red arrow could sprout a thinner branch upward, it would convey the reduced amount of energy sent to space.
- d. It's counter-intuitive to me that a blue thermometer would "radiate cold into space" as the blue arrow suggests. Maybe the blue arrow in the upper right could be eliminated and people will simply get that it's colder up there, and, alongside a thin upward arrow from "c.", would convey energy paths.
- Bottomline: File:Greenhouse Effect.svg is a tough act to follow. Incorporating the best features from File:Greenhouse Effect.svg (and eliminating its numbers and some textual commentary) would make this a formidable addition. —RCraig09 (talk) 03:22, 7 April 2020 (UTC)
Thanks for working with me on this Craig! All good points again. I updated the graphic again, several changes:
- Combined steps 2 and 3 into one point
- Reduced the amount of text, added in the greenhouse effect swirl
- Upped the font on the text to improve visibility
- Eliminated the blue arrow off the blue thermostat
Regarding your points: a/b. Yeah b is a good idea, done c. The graphic is good for describing Earth's energy budget, but not for describing climate change. For instance, the size of the little arrow directly to space has very little relation to climate change. The real issue is how many times heat energy is absorbed / re-emitted on its way to space, not the percentage that goes directly to space from the surface. The graphic also skips over the key issue that adding greenhouse gases causes the upper atmosphere to cool off, which is critical for understanding radiative imbalance. It also shows the system in balance, omitting fossil fuels / human impacts entirely. Finally, it generates questions it doesn't answer, like if the 350 of the 452 in the giant arrow is greenhouse gases, what's the other 102? I think it's convection / phase change, but the graphic just raises those questions without answering them. d. done Efbrazil (talk) 17:59, 7 April 2020 (UTC)
- Great! I see the Sun improved somewhere along as well. Femke Nijsse (talk) 18:41, 7 April 2020 (UTC)
- Aaaah! A much cleaner presentation! I assume your long paragraph refers to the earlier graphic File:Greenhouse Effect.svg. It lives on, in spirit!
- Microsuggestions:
- > Changing "Greenhouse effect" text color to red (to color-code it with the surrounding arrows).
- > Moving the blue thermometer vertically above the red thermometer but immediately below top text. This juxtaposition emphasizes the above-and-below nature of cooler and warmer atmospheric layers. (consider light blue text up there?).
- > Consider central text:
"Greenhouse gases from fossil fuels <newline> absorb radiation, capturing heat below". 'Trapping'-->'Capturing' seems more eloquent. 'Below' distinguishes from upper atmosphere. - > Wild idea: portray NH4 and CO2 as mirrors at 45° that reflect upward vertical arrows, horizontally toward the center red thermometer. (Factory can move down a bit.) Avoids the puff-of-smoke representation of GH gases that in fact pervade the atmosphere, not just in 'clouds'.
- —RCraig09 (talk) 18:55, 7 April 2020 (UTC)
Thanks again for the great ideas! I took yet another crack at things.
- Done. I also moved the thermometer down next to where the sun hits, which I like as that's the hottest place, everything else is feedback. I know you wanted to directly connect the fossil fuel output to increased temperatures, but it's not really accurate as it implies that the heat from smokestacks is the problem, instead of the gas trapping solar energy.
- I'd like that, I still miss the thermometer on the right in the original graphic. It doesn't really work with the current layout though, especially after I moved the other red thermometer, and I don't want the blue thermometer right next to the sun (for obvious reasons). I tweaked the text at the top to include "space", which I think is important and got dropped along the way. I don't want to go overboard on text coloring- having greenhouse effect color coded is enough I think.
- Good thought and much easier to read, but I don't want to suggest that all greenhouse gases come from fossil fuels. I tried to split the difference by saying "Greenhouse gases boosted by fossil fuels absorb radiation, trapping heat". There's no room to swap out "trapping heat" given that wording, and I don't think "trapping heat" is so bad.
- I thought about the deflector thing but it's also inaccurate- it implies that the gases "bounce" thermal rays, but in fact they absorb and re-emit them; if they only bounced then the air wouldn't heat up. The good thing about my original cut of the graphic is that it didn't try any graphical representation, which avoided all these issues, but it had other weaknesses like not showing the greenhouse gas "cycle" and not clearly connecting the hot thermostat to the greenhouse effect / sun. I made a marginal improvement by reducing the font on the gas names and made the atomic outline fill transparent. More importantly, I made the arrow from the fossil fuel addition transparent, which is better as it's not showing thermal energy (red arrow = thermal energy now).
- Good idea, done!
Efbrazil (talk) 21:03, 7 April 2020 (UTC)
Is it really just me, but I think this is a horrible change. The File:Greenhouse_Effect.svg is actually helpful is explaining the physics of what is happening. In my opinion the new version is much, much worse. I find it not at all clear what the energy flows or gases are actually doing in the new version. Is there really some reason for making a change here, because right now my vote would be for a straight revert. Dragons flight (talk) 21:35, 7 April 2020 (UTC)
- Hello, Robert. I think/hope that it's possible to synthesize the best ideas from both graphics. The biggest issue I now have is the expanded use of 'clouds' of specific-chemical-formula-named greenhouse gases, and their connection with wide red paths to ~imply that one GHG 'causes' another GHG. Some general representation of GHGs is better, even if only in text. Also, the new placement of the red thermometer 'inside' Earth is not as good as a red thermometer centrally located in the center of the pink lower atmosphere where GHGs' heat capture occurs. Less importantly, I think there's room in the horizontal center for the blue thermometer to be vertically above a centrally located red thermometer, for juxtaposition. I like the energy flows also, though it may be complicated to reconcile them with the new approach. Probably File:Greenhouse_Effect.svg should be replaced until issues are ironed out here. —RCraig09 (talk) 22:41, 7 April 2020 (UTC)
- Whoa! It just changed! Some of what I said has been obsoleted! —RCraig09 (talk) 22:46, 7 April 2020 (UTC)
Sorry Craig; I was trying to address the concerns here with the new version. I'm not crazy about it either, so I merged an old version with the new version in the hopes of coming up with a more clear graphic. For reference, here's the version you were talking about and that Dragons flight hates.
Dragons flight: Thanks for engaging on this instead of just reverting; it's a work in progress.
The original energy flow graphic is helpful in explaining Earth's energy budget, but it does not describe climate change. It actually doesn't talk about climate change at all- it's just showing Earth's energy budget when everything is in balance. The old graphic is also very technical and will wall people off to some of the content, so we were thinking it fits in better in the physical drivers section if we could make room.
The goals for the new graphic are laid out above at the top of this section. I took a step back and tried to address problems with the new graphic by merging it with an earlier version that more clearly separates out the descriptive steps. Take a look at the version there now and let me know if you think it is more helpful. Do you have constructive suggestions on achieving the goals here beyond just reverting?Efbrazil (talk) 23:07, 7 April 2020 (UTC)
@RCraig09: If you have to choose between the new graphic and the old greenhouse effect graphic, which do you prefer at this point? If you want the old graphic I'll do a revert. I can see the argument on either side and am conflicted.
Second issue- do you want to try and fix the issues raised with the "causes and effects" flowchart? If you want to open a new section where you try to address issues, kind of like we did before, then I'm all for it. The issues Femke and I raised with it were both technical and substantial in terms of content. I can reiterate them if you open a new section here for us to do another review. If we get it up to snuff then I support putting it back in the intro where it was.I still support your goals in creating the graphic.
I think to get it right will require a lot of work though, like condensing all feedbacks into 1 item, and cutting the number of enumerated effects by half. That's partly why I stopped editing the flowchart- the edits became so deep that the graphic was unrecognizable,. Efbrazil (talk) 22:25, 8 April 2020 (UTC)
- Since the second graphic has moved in various directions, like Robert I favor the first graphic File:Greenhouse Effect.svg as a starting point now, and it actually accomplishes more, intuitively. It could be improved by... removing numbers like 14° C and all w/m2... changing the central text to "Greenhouse gases trap heat in lower atmosphere"... introduce a factory to the right of the "The GHE" circulator with a separate arrow pointing toward that text... remove the two white arrows... add an upward heated arrow from just right of the sunbeam up to the new central text... eliminate or consolidate mention of radiation into space... remove upper left "solar radiation..." text... make lowerAtm/upperAtm/space colored red/blue/black...
- Re the now-deleted flow diagram, I'm busy on other projects so a massive re-think of which reliably sourced effects to consolidate or eliminate will have to wait. —RCraig09 (talk) 03:17, 9 April 2020 (UTC)
Recent “Land use change” edits and revised language for GHG gases subtopic
Moved from closed peer review by Femkemilene
I think I understand what you’re trying to do by moving the paragraph I had created for the Land Use Change subtopic to the last paragraph of the”Greenhouse Gases” subtopic, but just cutting and pasting the entire paragraph is problematic in a few ways: 1) it degrades the readability of the paragraph it was inserted into, 2) it deracts from the logical flow of the original Land Use Change subsection. Not so important in and of itself, but this also contributes to: 3) it aggravates one of the significant flaws that remain in the GW article; which is the lack of information to help a reader understand the effects of deforestation/reforestation, both on GW/CC itself and its significant role in future mitigation plans. When I added that paragraph into the sub section that was formerly titled “Land Use Change”, I was hoping that section could be strengthened and aligned with other parts of the article in order to help the reader further understand the ways that deforestation contributes to the GW/CC problem, as well as the ways in which forest preservation and reforestation are seen as a potentially significant mitigation tools. I am guessing these edits you’ve made are part of an overall revision plan to make the organization and content in the “Physical drivers of recent climate change” topic line up more closely with the radiative forcing graphic you created (which is an excellent graphic), and that you have modified what was formerly Land Use Change” to make it more consistent, both in title and content, with the “land reflectivity” bar in that graphic. I don’t understand your latest revision explanation statement “The previous demarcation of section wasn’t logical”, but that seems to be what you are referring to.
Although I disagree with this approach, you’ve clearly done a heroic job in editing this article, particularly over the past few months, so I would defer to your judgement in terms of overall organization. But I think that the paragraph starting with “Global anthropogenic greenhouse” now needs a good bit of editing; it reads to me like a bit of a mishmash of disparate ideas. I think it really needs to be broken into two paragraphs to accommodate the insert that you’ve made in a readable manner. I also believe that both the “Physical drivers...” and “Mitigation” topics still have flaws in the limited manner in which they treat deforestation/reforestation.
Over the next couple of days I’ll work to present an underline/strikeout version of the changes I would suggest for the “Global anthropogenic emissions” paragraph, and also provide some thoughts on how the Mitigation topic could be strengthened in terms of its coverage of the deforestation/reforestation issue. At a minimum, I think the topic deserves its own section. Its current placement as part of the Technology section makes no sense to me.
Please let me know if you have any concerns with what I am proposing. Dtetta (talk) 13:21, 28 March 2020 (UTC)
- You're right I made a bit of a mess of the prose. Eager to hear about your suggested improvements. It was an attempt to line up with the NCA2017 report, which approximately lines up with IPCC from which I got the data for the radiative forcing graph. If land use change is a subsection, than the GHG subsection has to be renamed into industry and energy or smth. I find that a less logical distinction. The previous subsections were overlapping in content.
- I've been staring at the "global anthropogenic greenhouse" paragraph for a bit, because I've transformed that into an ugly tangle. Feel welcome to rewrite and split into two paragraphs. It would be good to have a small paragraph entirely dedicated to land use GHG emissions, yes.
- In terms of space, I don't think that we can use the proper summary style and have an entire subsubsection (I assume you meant that) decicated to that. But surprise me. My reasoning in splitting technology and policy/measures was to create a paragraph with the actual things we need to do (reforestation/energy transition) on the one hand, and the policy tools to get there on the other hand. Feel free to rename. Femke Nijsse (talk) 14:25, 28 March 2020 (UTC)
Here is the my proposal for language for the last part of the Greenhouses gases subtopic. I realize this is a good bit longer than the current text. However, I do think this is all important information for the reader in order to have a complete understanding of greenhouse gases and sinks in affecting global warming. Underline for additions and strikeout for deletions.
Global anthropogenic greenhouse gas emissions in 2018 excluding land use change were equivalent to 52 billion tonnes of carbon dioxide. Of these emissions, 72% was carbon dioxide from fossil fuel burning and industry, 19% was from methane, 6% was from nitrous oxide, and 3% was from fluorinated gases.[1] A further 4 billion tonnes of CO2 was released as a consquence of land use change, which is primarily due to deforestation.[2]
Globally, the primary sources of GHG emissions are electricity and heat (31%), transportation (15%), manufacturing (12%), agriculture (11%), and forestry (6%).
[4] Consumption based estimates of GHG emissions, although they vary from country to country [5] p.12, offer another useful way to understand sources of global warming. In the US, for example, the main consumption based GHG sources are: car/air travel (33%), home (heat/AC/water-25%), food (15%), consumer goods (14%), and services (13%).[6]Current patterns of land use affect global warming in a variety of ways. While some aspects cause significant GHG emissions, processes such carbon fixation in the soil and photosynthesis act as a significant carbon sink for CO
2, more than offsetting these GHG sources. The net result is an estimated removal (sink) of about 6 billion tonnes annually, or about 15% of total CO
2 emissions.[67] Using life-cycle assessment to estimate emissions relating to final consumption, the dominant sources of 2010 emissions were: food (26–30% of emissions);[68] washing, heating, and lighting (26%); personal transport and freight (20%); and building construction (15%).[69] Agriculture emissions were dominated by livestock.[70]
Land use changes, mainly deforestation, play a unique role in affecting CO2 levels. While some aspects cause significant emissions, processes such as carbon fixation in the soil and photosynthesis act as a significant carbon sink for CO2, more than offsetting these contributions. The net result is an estimated removal (sink) of about 6 billion tonnes annually, or about 15% of total CO2 emissions.[3] Reforestation and forest preservation actions that make use of this carbon sink principle are a key feature of many countries’ plans to meet their Paris Agreement commitments.[7]
The ocean also serves as a significant carbon sink via a two-step process. First, CO2 dissolves in the surface water. Afterwards, the ocean's overturning circulation distributes it deep into the ocean's interior, where it accumulates over time. Currently the world’s oceans remove about 8.8 billion tonnes of CO2 annually.[8] p.2143. The strength of both the land and ocean sinks increase as CO2 levels in the atmosphere rise. In this respect they act as negative feedbacks in global warming.
Scientists are also seeing new evidence that Arctic permafrost may now be acting as a source of CO2 emissions, and this is projected to increase as global warming continues. Current estimated of CO2 emissions from one recent study range from 300-600 million tonnes per year.[9][10] Dtetta (talk) 23:41, 8 April 2020 (UTC)
@Efbrazil:, I also think your excellent graphic on sources and sinks, now placed in the scientific consensus subtopic, might be better used in the Greenhouse gases subtopic (with perhaps some revised wording in the description)...thoughts on that?Dtetta (talk) 14:08, 9 April 2020 (UTC)
- I'll be implementing parts of your suggestions later, the flow is again much improved compared to my attemps. About the sources & sinks: true, this is a better location. We have to prevent sandwhiching of figures (text between a figure on left/right), but with extra text we might be able to move it back. Specific comments:
- I'm trying very strongly to avoid the word tonnes if possible. I don't even have a feeling for what a tonne is, so I assume our typical readers don't either. Percentages work better.
- Paris agreement is mitigation, doesn't really belong here?
- Scientists say X is wording to avoid as it's a bit vague. Either it's true (no introduction needed, which is the case here), or it should be attributed to a specific (group of) scientist(s).
- words like unique, useful are our own opinions, and shouldn't be in there.
- WP:IDONTLIKE the US as specific example. Is there not a global estimate available?
- (as the TFA asked us to update, there is a 2019 global carbon report available). Femke Nijsse (talk) 14:49, 9 April 2020 (UTC)
Thanks for your response @Femkemilene:. My thoughts:
- Thanks for the suggestions about the use of “tonnes”. I’ll work to avoid it. However, the article is laden with a variety of hard to visualize metrics - I have much less of an idea what a W/m2 of radiative forcing is, for example.
- Re: the Paris agreement reference, my thinking was to include a brief reference here, and then expand on it in the mitigation topic, describing some of that possibilities/challenges/uncertainties associated with this mitigation method. I think the two concepts: 1)deforestation as a greenhouse gas source, and 2)reforestation/forest preservation as a mitigation measure, are pretty intimately connected, and thought a seque here was appropriate. But your call on whether to keep that sentence.
- Will make a point of avoiding “scientists say”.
- The “unique” phrase is admittedly opinion, but there are several phrases in the various parts of the article that could also be classified that way. But I’m glad you pointed it out, as I re-reviewed what I wrote, and think it could be improved. How about this: "Despite the contribution of deforestation to global GHG emissions, the Earth’s land surface, particularly it’s forests, remain a significant carbon sink for CO2. Natural processes such as carbon fixation in the soil and photosynthesis more than offset the GHG contributions from deforestation. The land surface sink is estimated to remove about 11 billion tonnes of CO2 annually from the atmosphere, or about 29% of global CO2 emissions.[4]" Note-29% is based on 11.2(natural response of land)/39.1 (Total net anthropogenic emissions) from the values on SPM page 10. And I think it’s page 10, not 9. My error when I first created the footnote.
- Re: the US example for CBEI. Part of the issue, which I mentioned in the first clause of the sentence, is that the results vary from country to country, so a global figure could be less useful than picking a representative country. Initially I tried to figure out a way of using the figure on page 12 in the c40 reference, which covers continent wide estimates, and just generally describe the relative contributions of various activities. But then I stumbled onto the US reference, based on the work of the Cool Climate group at UC Berkeley (which I recalled, from teaching this topic for a short period of time, as a national, if not world-class, leader in this area). So I felt very comfortable about using it, despite its limited focus on the US. But, perhaps it’s best to try to use some generalized language based on the page 12 figure in the c40.org reference. I can look also around a bit more to see if there’s a better reference, if you think that’s worth it, but the question of country specific vs. global will remain.
- Yes, there is a 2019 global carbon budgetDtetta (talk) 18:56, 9 April 2020 (UTC)
- @Dtetta: Thanks, I'm glad you see the value in the graphic! Feel free to move it, but the current location was chosen for 3 reasons- 1. to avoid crowding and sandwiching of graphics. 2. To separate it from the physical drivers section, which also covers carbon sources and for which the graphic is partly redundant (the sources part). 3. To frame the scientific discussion issue by clarifying that where carbon goes in the future is a big question mark, but where it is coming from is pretty straight forward. The IPCC cheats in its projections by looking at GG concentrations instead of GG emissions, so that way it can avoid the massive uncertainty associated with the carbon cycle in its projections. Efbrazil (talk) 17:56, 9 April 2020 (UTC)
- @Efbrazil: Thanks for that explanation. Based on those thoughts, it probably doesn’t make sense to move your graphic up into the greenhouse gas section. @Femkemilene: I wonder if you’d be willing to consider adding a couple of bars to your radiative forcing graphic, to illustrate the land and ocean sinks.Dtetta (talk) 01:47, 10 April 2020 (UTC)
- The radiative forcing graph displays the energy imbalance (at the top of the atmosphere), so the units are completely different from anything to do with the carbon cycle. Adding any bars there wouldn't make much sense, I'm afraid. When I'm more awake, I'll try to go through the text and see if radiative forcing is mentioned in places before the explanation (f.i. engage in the discussion whether it should be in the lede.) Tonnes is somewhat easily replacible with %, whereas the only easy 'translation' of radiative forcing I'm familiar with is quite dramatic: http://sks.to/heat -> radiative heat translated into things like 'hurricane sandies / atomic bombs per minute'.
- If you see more phrases in the text that are opinion, please point them out, so I can rephrase or attribute.
- The C40 report is interesting, more later.
- If we get enough text (and with that, place for figures), I'd like to move the figure back up. Especially now we're covering the carbon cycle in that section more explicitly. Femke Nijsse (talk) 19:12, 10 April 2020 (UTC)
- I've added the ocean stuff, but it still needs two more sources. Femke Nijsse (talk) 20:00, 10 April 2020 (UTC)
- @Efbrazil: Thanks for that explanation. Based on those thoughts, it probably doesn’t make sense to move your graphic up into the greenhouse gas section. @Femkemilene: I wonder if you’d be willing to consider adding a couple of bars to your radiative forcing graphic, to illustrate the land and ocean sinks.Dtetta (talk) 01:47, 10 April 2020 (UTC)
@Femkemilene: Thanks for making that start to the edits. Some thoughts:
- For the paragraph starting with “Global anthropogenic...”, I think if you’re going to choose between a sector based analysis and a consumption based approach to characterize emissions, sector based is preferable. It’s the approach used on government websites such as the EPA,[11], and EU [12], and the consumption based approach has all of the problems associated with lifecycle assessment boundaries. In my original paragraph I used it as an alternative to the sector-based approach to give readers a fuller understanding. But if you want to just have one rubric I believe the sector-based statistics are better. I had eliminated the sentence starting with “Lifecycle assessment...” for a couple of reasons. Although the research seems well done, I didn’t find their conclusion supported in other sources, nor did I see them reflected in footprint calculators, which use a similar methodology. Is there a reason for preferring these particular references? I question the high value associated with food, and with washing, not that they both aren’t significant. I would recommend using the c40 paper rather than these references.It also seems like the sentence itself uses one statistic from the Poore paper, and combines that with statistics from the Bajzelj paper, which doesn’t seem quite right, although the food ratio is relatively consistent between the two. It seems like just the ratios in the latter should be used, if you’re going to stick with that particular study, which is now seven years old. Lastly, the term lifecycle assessment is jargon, unfamiliar to most readers. A phrase like “consumer based” or “consumption based” would be a better choice of wording. So my main suggestions are 1) use sector based statistics if you have to use just one method; 2) use the c40 reference rather than the Bajzelj paper, and 3) substitute “consumer based” for “lifecycle assessment”.
- In my second edit I was trying to make the sinks paragraph more focused on just that. So my revised leading sentence emphasized the the land surface as a sink, including the use of the larger 29% statistic, which is better correlated with the ocean sink wording. The current paragraph now has a few problems in the first three sentences. Although I like your idea of using some of the natural responses ideas from the SRCCL report, the “Natural responses...” sentence itself is awkwardly worded, and I’m not really sure how to fix is at this point. Also the reference to forestry as a major source is redundant, as it’s clearly mentioned in the previous paragraph. I suggest putting the agriculture reference into the paragraph above, such as “19% was methane, largely from agricultural livestock and rice farming”. That would let you eliminate the sentence starting with “Agriculture and forestry..., and allow for a lead in like was in my original paragraph, which I think was more readable than what is there now. On a minor note, “dual role” rather than “double role” seems like better wording in the first sentence.
- The global carbon budget report would be a reference for the statement that the sinks are increasing with CO2 concentrations. In the 2018 report its on p 2160.
- I would be happy to make these edits directly if you would rather focus on other things.Dtetta (talk) 15:12, 11 April 2020 (UTC)
- Yes, please go ahead and make the edits.
- The life-cycle assessment line will need to be updated at some point indeed, but I do think it's a useful way to think about it. I can further believe that heating (+ smaller washing+lighting) covers such a big chunk. I hadn't looked into the confusing sourcing yet, but indeed mixing and matching is not what we should do. I was planning to remove the words lifecycle assessment in a rewrite indeed, and your replacement suggestion is good (I prefer to comsumption based, as consumer based has a capitalist tinge to it, reducing us to consumers).
- The reason I didn't use your leading sentence (I assume you meant Land use changes, mainly deforestation, play a unique role in affecting CO2 levels), is that natural responses to human intervention is not categorized under land use change as far as I can discern from the IPCC reports.
- Would you like me to look out for a source about how the ocean sink works? The two-step process? I couldn't find that in the carbon report, but maybe I didn't look good enough. Femke Nijsse (talk) 15:31, 11 April 2020 (UTC)
- Yes, please go ahead and make the edits.
Sounds good, I will do the next edit, and I can look for a reference on how the ocean sink works.Dtetta (talk) 03:13, 12 April 2020 (UTC)
Climate change redirect
why does climate change redirect to global warming?
- There have been many past discussions on this topic - see Talk:Climate change (general concept)#Requested move 1 April 2020 and other earlier discussion linked there. Mikenorton (talk) 10:49, 19 April 2020 (UTC)
New line still incorrect
The new line is still incorrect. I am quite surprised to see this common misconception reflected on the NASA website. According to the IPCC reports, further warming will immediately stop after we stop emitting greenhouse gases. The negative carbon feedbacks and the positive temperature feedbacks compensate. You can find this information if you search for " committed warming". Of course, when we stop emitting, the temperature won't revert back completely to pre-industrial temperatures.
Furthermore, we should not include information in the lead if it's not included in the body. We were also asked to make the lead shorter instead of longer. I am using speech to text so keeping it very brief.
Femke Nijsse (talk) 07:28, 17 April 2020 (UTC)
- I'd be interested in reading what you're reading at IPCC on this, Femkemilene. I did a cursory search and didn't see it. NewsAndEventsGuy (talk) 10:47, 17 April 2020 (UTC)
IPCC wg1 AR 5 page 1104. Femke Nijsse (talk) 10:55, 17 April 2020 (UTC)
- I've looked at that section, and I think the issue is more complex. First, "immediately" is a relative term. As I understand it, the shortest timeframe discussed starts 100 years after emissions stop. This is immediate in a geological sense, but not in a human sense. Secondly, the outcome seems to depend on various factors, including climate sensitivity: "For high climate sensitivities, and in particular if aerosol emissions are eliminated at the same time, the commitment from past emission can be significantly positive, and is a superposition of a fast response to reduced aerosols emissions and a slow response associated with high climate sensitivities" - i.e. in that case, warming will continue for a while. I'm not sure how to reflect that in a compact sentence - maybe using the subjunctive "may ... or may ..., depending on a number of factors". Or we argue for about a year and hope that AR6 will have something more definitive ;-). --Stephan Schulz (talk) 11:16, 17 April 2020 (UTC)
- you're right, I was simplifying. The SR 15 report page 64 also deals with the zero emission commitment. It is a bit more definitive. Specifically figure 1.5 indicates that stopping all emissions including aerosols would only lead to five or 10 years of warming (orange). Cooling also fits into the confidence interval. Note that the current sentence excludes aerosols, so that the purple line is more appropriate.
- I think we should first remove the sentence from the lead as the current formulation is not correct. This sentence doesn't fit in the paragraph as the last paragraph is about future warming.I think including a weak sentence in the already crammed lead isn't an improvement. Femke Nijsse (talk) 12:22, 17 April 2020 (UTC)
- I strongly disagree- the sentence is critical to making the point that worst impacts of emissions do not occur until at least several years after emissions happen, and your own confusion on the point helps to drive home the issue. Without that sentence, someone new to the topic will think that we can wait to cut off emissions until the problems outweigh the cost of a fix. It is also a perfect segway to the paragraph on effects, as the most serious effects have not happened yet, and some effects like sea level rise have barely started. Efbrazil (talk) 16:24, 17 April 2020 (UTC)
- I found a newer source here that goes in more depth on the issue, although it focuses on "stabilizing" concentrations instead of talking about cutting off new emissions: https://science2017.globalchange.gov/chapter/4/. I think I prefer the existing formulation I used as it includes the issue of the carbon cycle. Femke- is what I would suggest is that you consider better wording for the idea instead of looking to cut the idea. The core message of momentum in the climate system and that the worst effects of emissions today won't happen for many years is important to convey up front. Efbrazil (talk) 16:37, 17 April 2020 (UTC)
- it's it's simply not true that the worst effects of emissions so far won't happen for many years, at least in most domains. This misconception undermines support for mitigation, as there are no direct benefits. Could we start by deleting the incorrect sentence from the lead? I think I will be weakly against a correct sentence as well, but happily be overruled by consensus. I am not going to craft a new sentence as dictation technology is still young. The NCA source or the 2018 IPCC source are both excellent, and the IPCC source includes the carbon cycle. Do you have a suggestion how to shorten the lead otherwise? It is true that ocean acidification and sea level rise will both continue after emissions stop, but that is a separate points. Femke Nijsse (talk) 17:20, 17 April 2020 (UTC)
- I'll look to update the text with the IPCC data. Note that ocean heating is also a lagging effect, along with acidification and sea level rise. So coral reef damage won't peak until many decades after emissions stop. I'll look to update the text further today. Efbrazil (talk) 16:45, 18 April 2020 (UTC)
- Done. That was a very interesting deep dive on the research. The myth femke talks about seems to be based on science from a decade ago, when models showed warming continuing by another 0.6 degrees due to momentum in the climate system, even if emissions were cut off. Newer models show that the ocean is absorbing enough heat content and CO2 to stop increased growth of temperatures, although temperatures will remain elevated for the foreseeable future. I want to get this information up front because it is a key issue in the climate change debate- on one side, some people think we should just wait for problems to happen and then look at solutions. On the other side, some people say everything is hopeless so why bother trying to fix the situation. Efbrazil (talk) 23:48, 19 April 2020 (UTC)
- I'll look to update the text with the IPCC data. Note that ocean heating is also a lagging effect, along with acidification and sea level rise. So coral reef damage won't peak until many decades after emissions stop. I'll look to update the text further today. Efbrazil (talk) 16:45, 18 April 2020 (UTC)
- it's it's simply not true that the worst effects of emissions so far won't happen for many years, at least in most domains. This misconception undermines support for mitigation, as there are no direct benefits. Could we start by deleting the incorrect sentence from the lead? I think I will be weakly against a correct sentence as well, but happily be overruled by consensus. I am not going to craft a new sentence as dictation technology is still young. The NCA source or the 2018 IPCC source are both excellent, and the IPCC source includes the carbon cycle. Do you have a suggestion how to shorten the lead otherwise? It is true that ocean acidification and sea level rise will both continue after emissions stop, but that is a separate points. Femke Nijsse (talk) 17:20, 17 April 2020 (UTC)
- I found a newer source here that goes in more depth on the issue, although it focuses on "stabilizing" concentrations instead of talking about cutting off new emissions: https://science2017.globalchange.gov/chapter/4/. I think I prefer the existing formulation I used as it includes the issue of the carbon cycle. Femke- is what I would suggest is that you consider better wording for the idea instead of looking to cut the idea. The core message of momentum in the climate system and that the worst effects of emissions today won't happen for many years is important to convey up front. Efbrazil (talk) 16:37, 17 April 2020 (UTC)
- I strongly disagree- the sentence is critical to making the point that worst impacts of emissions do not occur until at least several years after emissions happen, and your own confusion on the point helps to drive home the issue. Without that sentence, someone new to the topic will think that we can wait to cut off emissions until the problems outweigh the cost of a fix. It is also a perfect segway to the paragraph on effects, as the most serious effects have not happened yet, and some effects like sea level rise have barely started. Efbrazil (talk) 16:24, 17 April 2020 (UTC)
Replacing "Climate change and global warming causes and effects chart"

Separating causes and effects
I spent time trying to rework the chart shown here and I'm concerned that it's biting off more than it should. There's really 2 key topics here- the causes of climate change, and the effects of climate change. I don't see a good reason to combine those 2 things in one chart, as they're really separate issues. So I'm treating them separately down below.
- (a) Oy. I completely agree that "the whole system is complicated to represent visually", but thankfully, representing the system is not the diagram's purpose, and would indeed be "biting off too much". More simply, the purpose of this intro diagram is to visually portray GW's causes and effects, including feedbacks.
- (b) Your "Causes..." section (below) has more detail than appropriate for an intro chart. And textual tables lack the impact of a block diagram in visually (instantly, intuitively) showing (not telling) the many pathways of wide-ranging effects—without being unmanageably complex. The diagram also visually portrays the feedback principle in a way that laymen can instantly see.
- (c) Motivation for the chart was the very fact that, indeed, "nobody on the Internet has created a coherent graphic describing..." these causes and effects, including feedbacks. With valuable contributions from you and others, I think it has achieved that ambitious purpose.
- (d) Diagrams embodying your ideas, being detailed and seeking "data", could find a good home in the 'Physical drivers...' or 'Effects' sections. Within the scope of the diagram's purpose, you know by now that I'm open to specific suggestions. —RCraig09 (talk) 05:21, 26 March 2020 (UTC)
- Yeah, sorry, I go back and forth on the chart. I spent a lot of time trying to tweak it. What I came around to thinking is that, without backing data justifying what's in the chart, it will be viewed not as unbiased information, but as alarmist propaganda. I think it could be easily picked apart by someone that is skeptical about the threat of climate change in a way that the charts showing data can't be picked apart. There's individual things like how increased plant growth is a much stronger negative feedback than permafrost methane release. Then there's larger things like how impacts on the environment and humans are mostly just a lot of text- I don't know that the flow chart format helps to illustrate them. That's how I ended up thinking of a reset, but I could be persuaded to just go back to being incremental and editing the chart. I'd be interested to know what @Femkemilene: thinks. Efbrazil (talk) 17:04, 26 March 2020 (UTC)
- Anything can be picked apart. Granted, the block diagram is qualitative rather than quantitative, but the quantitative GST graph directly above it can also be picked apart as alarmist propaganda since it's so general (why I favored breaking out drivers). Again, within the context of causes and effects of global warming—in the title of the diagram—the details of the entire climate system are so numerous and complex that they couldn't, even shouldn't, be included. Other commenters are invited. —RCraig09 (talk) 17:17, 26 March 2020 (UTC)
- The difference with the GST graph is that it has sources that justify the information presented and is showing data from those sources. You raise a good point though about the GST graph over-abstracting human and natural influences though- I'll improve the source links next. The flowchart does not have backing data- what's there is strictly a qualitative editorial decision. It's true anything can be picked apart, but I think the flowchart can be justifiably picked apart. Efbrazil (talk) 19:43, 26 March 2020 (UTC)
- In an encyclopedia for mass consumption, in a lede graphic, in a top-level article—one with ~4.7 million views/yr—quantitative data is not needed or, arguably, called for in the lede; note the lede text itself is devoid of numbers except for "1.5-2 °C"
and 42 gigatons. Rather, directly-understandable concepts like those in the diagram's blocks are absolutely critical to our primary duty here, science communication. As an engineer I appreciate the techy/sciency/graphy impulse, but many intelligent-but-non-techy people see a line graph and their eyes glaze over, so it's best to have concepts be as immediately accessible to all, with "drilling down" being accomplished through references, article sections, and sub-articles. The four (qualitative) sources ensure the diagram's qualitative content can't be justifiably "picked apart". And the flow of the diagram—which you even call a flowchart—visually portrays causal paths even though the blocks themselves are textual: show, don't tell. —RCraig09 (talk) 21:43, 26 March 2020 (UTC)- I'll refrain from commenting /(making up my mind) until I have a better idea of what LAYOUT issues we don't comply with. I asked whether GW could be run on the front page, and the coordinators indicated that the current article doesn't comply with the layout criteria of FA. I suspect this is because we have too many figures, but I'll have to check. Femke Nijsse (talk) 09:10, 27 March 2020 (UTC)
- In an encyclopedia for mass consumption, in a lede graphic, in a top-level article—one with ~4.7 million views/yr—quantitative data is not needed or, arguably, called for in the lede; note the lede text itself is devoid of numbers except for "1.5-2 °C"
Wikitable re GW/CC Diagram
I'm still having trouble understanding the change in opinion over the past five weeks, after an intensive two-week multi-editor collaboration. I don't perceive my arguments, above, have been specifically responded to, so I've made this chart to crystallize any issues. Feel free to add to it; I'm hoping to keep things short & concise.
| Objection | Support |
|---|---|
| ...don't see a good reason to combine cause, effect in one graphic | This GW article largely concerns both causes & effects (& feedbacks). Diagram instantly conveys the few causes and wide-ranging effects of GW/CC. |
| In terms of cause, fossil fuels are the vast majority of the problem, something on the order of 2/3rds to 3/4ths of the cause depending on source, with most of the remaining being land use. I don't think individual feedbacks belong in an overview graphic like this, they just confuse and distract from the primary drivers. | Conceptual chart doesn't pretend to be quantitative. Chart is designed to show RSs' causes & effects of GW/CC—not whole (climate?) system. Also, article has an entire 'CC feedback' section. Re fossil fuels' dominance: an arguable issue of internal chart design. |
| Some negative feedbacks the chart ignores (like plant growth) are currently stronger than the positive feedbacks the chart features (like methane release), which makes the chart appear biased towards the apocalyptic. | Every block has data support. See the RSs! They "justify the information". It's just presented as linked concepts not plotted as "data". Most readers aren't dataheads, but do care about flooding, crop yields, etc. Diagram is about global warming; cooling influences aren't called for in a summary diagram. Adding negative (cooling) feedbacks would increase size & complexity. |
| Can be "picked apart" by skeptics, and wikipedia needs to be about presenting information that cannot be picked apart. The other graphics are all strongly sourced, so if anyone complains about them they can click through to the study or source data that is the basis. | No more than any other diagram; see the RSs! Every block has data support. |
| Large size that causes layout problems |
... and with good reason! The graphic hasimo the highest concentration of content per sq. inch. Substance should trump form. |
| If the picture is predominantly text, then the text should be done as a text-centric format that supports links, be localized, be edited, be accessible, etc. A table might be the best solution, because it is easier for some people to digest than a paragraph and helps organize the information. Tables can even contain triangles for directionality like this: ►▲▼◄ | Flow diagram instantly, visually shows causal paths, and relation of causes & effects & feedback. A visual is more impactful than prose or text tables buried walls of words. Also consider: stripped of its decoration, the GH Effect schematic is a flow diagram of text, also. To be as readable, a table would have to be as big as the diagram, and even bigger if adding negative feedbacks, future outcomes etc. |
| Somewhat redundant with the Table of Contents, which can be clicked to contents and easily edited / localized / zoomed / is accessible / works on all devices | Precisely! Lede images should summarize. Plus, causal flow diagram concisely links concepts better than any ToC could. Text has some internal 'mechanical' advantages, but readers clicking on ToC entries are sent to long, distributed sections of prose. |
| A zoom of 1.35 upright is max allowed for lead standards, so text in image is not visible on desktop, plus it is awful squinty on smartphone at present, plus the aspect ratio is not suited for reuse in presentation graphics | MOS:IMGSIZE: "Lead images should usually use upright=1.35 at most"—non-mandatory. If there's a conflict: substance should trump style. Consider what readers are seeking to find, quickly, when they come here. |
| Currently replaced with GH Effect schematic that is grounded in data and clarifies the core mechanism behind climate change, but this does not have to be the case. We could switch out the GH Effect schematic for a table or another graphic that we all agree on. | GHE schematic shows internal mechanisms that are behind GW—not summary content about GW itself that should be in a GW lede. Again, each block in the diagram is "grounded in data". Note that the lede mentions causes, effects, feedbacks—but not GHE. |
| Text largely "unreadable" due to thumbnail sizing, and without reading the text the graphic conveys no information. | Is clicking on a graphic to enlarge, too much to expect? The color-shaded regions' labels impress the cause/effect/feedback relationship instantly, inviting clicking if needed in particular screen resolutions. |
| A key criticism of climate change messaging is that it goes overboard and is apocalyptic, so wikipedia can be a real antidote to that by putting the science first in a way that is indisputable. This graphic appears biased towards the apocalyptic, especially since it does not present multiple future possibilities. | Re apocalyptic: I just plain disagree, & think these scientific sources are not apocalyptic at all. This diagram does "put the science first" (see sources). Behavior (=responses)—a separate issue—has never been in any recent lede image, including the GH Effect schematic. |
| When presenting future possible outcomes we need to be very clear about how our behavior will influence them and how long they will take to develop. | Sources disclose these effects at the most general level—which does "inform people with hard facts". Re "future possible outcomes": True, there is a 'Responses' in the ToC but it's one step beyond effects... and adds size. Arguably, removing RS content for its social/political purpose or conjectured psychological effects violates WP:Neutrality. |
| ___ | ___ |
| Summary: Causes are over-complicated and confuse rather than clarify, effects would be better done in a text-centric format | Summary: objections seem mostly formal, stylistic, ~"internal" to WPedians (versus reader-centric). Substantively, the diagram concisely summarizes essential GW content. |
——RCraig09 (talk) 05:46, 29 March 2020 (UTC)
- My major objection is these two contradictory requirements: the figure must be displayed sufficiently big to be readable. At upright=1.5 it was just about readable. At 1.35, which is the max in the lede, the figure becomes unreadable. The placement in the effects section is less ideal, and enlarging it there brings us back to the problem we started with: sandwiching. I think photos are essential to make this article accessible to a non-geeky public. We might want to consider adding the GHE into the lede, but that may be difficult as one of our 'assignments' before FAR is shortening the lede a bit. Femke Nijsse (talk) 15:55, 29 March 2020 (UTC)
- Are you talking about high-pixel-count screens? iPhone screens? . . . Agree, some 'pictures' are needed, to humanize the topic.
- I appreciate your points. True, MOS:IMGSIZE states that "Lead images should usually use upright=1.35 at most"—but the language isn't mandatory. In the context of this important article—sometimes criticized for being 'bloated'—and a public thatimo usually doesn't dig through long prose details, I think that either a
upright=1.5"stylistic rule"-stretching, or expecting people with certain screen resolutions to (gasp!) click to enlarge an image, are reasonable. I fear that drive-by reviewers, from FAR or anywhere else, may not appreciate the richness of this article's content. —RCraig09 (talk) 16:42, 29 March 2020 (UTC)- I definitely understand the frustration given all the work that was put into the graphic and the extensive edits made to get it in good shape and how valuable a single intro graphic would be. What led to me rethinking things was the process of trying to adapt the graphic to svg. There's two primary issues that came up.
- First, the graphic is mostly text so it needs to be readable in thumbnail / on smartphone, and that requires zooming a lot of text at the current resolution. I tried collapsing the graphic to 2 columns, then realized it would be better to just go to a table view since that's native text, which has many advantages for localization, for links, for editability, and so forth. This is especially true for the "effects" section, which I don't think flow chart form works for very well. It could be the overall graphic would work better as a powerpoint slide, but then the whole thing would need to be pivoted to landscape mode and wouldn't work for Wikipedia anymore.
- Second, when looking at the graphic with fresh eyes I think it is too heavy on the overwhelming / apocalyptic messaging. A key criticism of climate change messaging is that it causes people to throw up their hands and say oh well, might as well enjoy today since we're all screwed in the end. Climate scientists spend a lot of time trying to say "things are in fact going to get shittier, but the question is how shitty how quickly, and we can do a lot to impact that". Since this is wikipedia we want to firstly inform people with hard facts so they can't dismiss the science, then spell out alternate future possibilities. Efbrazil (talk) 17:29, 29 March 2020 (UTC)
- - And thank you for your valuable feedback, both substantive and graphical, throughout the creative process.
- - I've responded in the table above, to the conjectured psychological effect on readers of seeing a comprehensive portrayal of GW's effects.
- - Re screen resolutions, it seems it's a matter of values: (1) comprehensively and concisely portraying substantive content versus (2) stylistic layout considerations and convenience for some users in not having to click on an image if needed. I wish more editors would weigh in on what they think is most important. —RCraig09 (talk) 18:44, 29 March 2020 (UTC)
Click at right to show/hide refs
|
|---|
|
References
|
Causes (feedbacks and the carbon cycle)
The causes section of the flowchart diagram is meant to capture climate change as a system. I like the idea, but all that's really there is to say FOSSIL FUELS with a sprinkling of land use and a few select positive feedbacks. The feedbacks in particular are unweighted and strike me as alarmist based on how much space they take when presented without data in the diagram.
For instance, why does feedbacks ignore negative feedbacks? Negative feedbacks include increased vegetation uptake of carbon, which has been a strong negative feedback so far, plus increased heat emissions to space as the temperature increases. Even positive feedbacks like permafrost melting to produce methane in the short term has a flip side of yielding more arable land for vegetation in the long term. The IPCC weighted feedbacks to be net positive in the near term, but they explicitly weren't looking at the carbon cycle and they didn't assign a net number to feedback impact that I could find (the article also refuses to assign numbers to feedbacks).
Ideally we could get good numbers to describe climate change by aggregate cause (fossil fuels, feedbacks, land use, other) and use that here in a simplified graphic. It would be like the physical drivers chart, but instead directed at sources instead of gases. I don't see that data clearly laid out, does anyone else?
The best numbers I see are these, but they don't spell out feedbacks and introduce the complication of needing to show the carbon cycle in addition to radiative imbalance:
- GGE Sources- 72% Fossil Fuel Combustion https://www.c2es.org/content/international-emissions/ (agriculture 11%)
- GG causing energy imbalance 76% Carbon Dioxide (Same source, methane 16%)
- Carbon Dioxide 46% to air, 23% to ocean, 31% to biosphere, from global carbon project (http://folk.uio.no/roberan/GCB2019.shtml
- Energy Absorption 92% to Ocean
The truth is that the whole system is complicated to represent visually. Either your just say "FOSSIL FUELS" in big, bold letters, or you collapse into a muddle because you need to include both the carbon cycle and also radiative imbalance. I think we do a good job in the physical drivers section, but just picking out a few select issues for the flowchart seems problematic. The fact that nobody on the Internet has created a coherent graphic describing climate change as a system illustrates the difficulty.
Effects on the environment and humans
| Effects on environment | Effects on humans | |
|---|---|---|
| Air heating | More intense heat waves, droughts, and hurricanes | Direct physical harm, economic losses |
| Land heating | Wildfires, desertification, and ecosystem damage | Farmland loss, spread of tropical diseases and pests |
| Ocean heating | Coral bleaching, fish stock declines | Fishery and tourism losses |
| Ice sheet melt | Loss of arctic and marshland ecosystems | Flooding of coastal cities |
The list of environmental and human impacts is really just a lot of text that might be better done as a table, so we can use real text. I have created an example here, sized to a width approximating thumbnails.
The down side of the table is that it's really just the paragraph of text in the intro broken down into a table format, so it's arguable as to how much value it adds. Of course the same applies to the flowchart view of effects.
The up side of the table is that it avoids svg rendering issues and can be easily edited, but is arguably more organized and digestible than a paragraph of text. It kind of splits the difference with the flowchart. I also reorganized the content in a way that I think is more accurate and clear than what's in the flowchart.
Elevating another graphic

One graphic I think would be good to elevate is the climate change performance index, shown here. The graphic clearly shows how the performance of various countries stack up against each other in addressing climate change problems. It's good as a snapshot of who is doing what to address climate change, which is an important topic to elevate.
So if I was just going to pull out the big edit hammer right now I think I would replace the flowchart with that graphic and then tack on the effects chart so effects get clear visibility as well. Thoughts? Efbrazil (talk) 22:15, 25 March 2020 (UTC)
- I'm not following what you mean by "flowchart" versus "that graphic" versus "effects chart".
- The Performance Index is a meaningful graphic, but—based on the principle that a Wikipedia article on "X" should prominently describe X's causes, characteristics, and effects—I think that since the Performance Index deals with human response (not a true effect) it's not so central to the GW article that it warrants a lede image position. It's excellent where it is now, in 'Political response'.
- I plan to add the Performance Index to the CCPI article. I think specific sourcing is needed, at least in the Commons file page if not also here. —RCraig09 (talk) 16:14, 26 March 2020 (UTC)
- Whoa. This graphic seems to be an exact copy (converted to SVG) of the image on the CCPI.org website. Is there a copyright/licensing issue? —RCraig09 (talk) 16:24, 26 March 2020 (UTC) I'll delay adding to the CCPI article until the possible copyright issue is resolved. —RCraig09 (talk) 16:26, 26 March 2020 (UTC)
- In terms of licensing, maps are a grey area- are they data, or are they an image containing copyrighted info? According to the wikimedia article discussing derivative works using maps none of the following are subject to copyright: data, colors, systems, and geographical boundaries. That covers all that this map contains. I could rerender the map using a third party tool, but I don't know that it would make a difference. Thoughts? Efbrazil (talk) 17:21, 26 March 2020 (UTC)
- The data itself can't be copyright-protected, nor, probably, is there the required "modicum of creativity"(U.S. law) involved in simply painting different countries different colors. The only possible issue is the bare-bones country-outline map itself, which the CCPI.org website designers probably did not create, themselves. So I think it's safe, at least from any claims by CCPI. —RCraig09 (talk) 15:25, 27 March 2020 (UTC)
- In terms of licensing, maps are a grey area- are they data, or are they an image containing copyrighted info? According to the wikimedia article discussing derivative works using maps none of the following are subject to copyright: data, colors, systems, and geographical boundaries. That covers all that this map contains. I could rerender the map using a third party tool, but I don't know that it would make a difference. Thoughts? Efbrazil (talk) 17:21, 26 March 2020 (UTC)
Causes and effects path forward?
| Effects on environment | Effects on humans | |
|---|---|---|
| Air heating |
More intense heat waves, droughts, and storms | Direct physical harm and economic losses |
| Land heating |
Wildfires, glacial retreat, desertification, biodiversity loss | Farmland losses, spread of tropical diseases and pests |
| Ocean heating and acidification |
Coral bleaching, ocean current changes | Fishery and shellfish losses, tourism losses |
| Ice sheet melt | Loss of arctic and marshland ecosystems | Flooding of coastal cities |
| Cumulative risks | Ecosystems collapse, climate tipping points crossed | Human migration and conflict |
I agree that the greenhouse effect schematic is not great for the intro. It's overly technical and hard to digest. On the plus side, it's well grounded, clearly points the finger at greenhouse gases, and clarifies the cause of climate change in a directly visual way.
I'm going to try and recreate the graphic in a way that is easier for a lay person to understand, like this: https://miro.medium.com/max/1400/1*58aKfoSmb_hj4zFz0Egt6g.jpeg
I'll also try to add fossil fuels and maybe land use to the graphic.
I agree it would be great to capture effects in an intro graphic, but since effects are a messy area that requires tons of words, I think it's best to leave effects as a paragraph in the intro.
For effects, I updated the effects table I created earlier based on Craig's graphic, new version on the right. I added "cumulative risks" as a summary row at the end, to better capture key issues that depend on future emissions. It needs to have work put in to add links to depth articles or bookmarks in this article. I like the table being in the sidebar because it looks good on smartphone- tables that are full width don't.
Could the table be further improved or changed to capture some more advantages of the flowchart? You can add arrows to tables using ►▲▼◄, but I don't have a clear idea in my head how that would help. Thoughts?
For feedbacks, I don't think there's a coherent way to show them in a graphic or in the intro because the area is muddled and we don't have clear numbers saying what feedback contributions are relative to each other.
For the feedbacks area of the article, it would be interesting to create a list of feedbacks that sorted the feedbacks by relative importance, or maybe a table that organized them by historic impact, current impact, and future impact. Right now we just have an unsorted laundry list of feedbacks in paragraph form. Would be interesting to dive in on. Efbrazil (talk) 21:19, 31 March 2020 (UTC)
- In terms of relative feedback strength: only an old paper springs to mind: https://www.annualreviews.org/doi/10.1146/annurev.earth.061008.134734, Figure 4. It is quite clear that water vapour in models is the largest, and cloud possibly second. Clouds are very uncertain. The cloud feedbacks are larger on average in CMIP6, so possibly they now trump water vapour, but those new high ECS/TCR models are bull (OR: https://www.earth-syst-dynam-discuss.net/esd-2019-86/). I don't think showing them in a graph (be it historical, of model impact) is that useful; the 'units' we describe feedbacks are confusing and mathematical typically.
- I'm pretty sure human migration isn't a tipping piont. I've never saw a study pointing to any threshold behaviour at least. Femke Nijsse (talk) 21:34, 31 March 2020 (UTC)
- Some general observations and comments:
- Causal paths in the Cause/Effects graphic have from 1 to 4 elements in series (after arrows leaving "GW & CC")—difficult/impossible to represent in a two-column chart.
- Similarly, some EffectsOnHumans can be arrived at through more than one path—also difficult/impossible to represent.
- I can't see a practical way to use ►▲▼◄s in a table: causal pathways would occupy space (presumably in "extra" rows/columns devoted to arrows to try to capture causal pathways).
- I think graphics+tables in a high-level article, especially in the lede, should summarize concepts and their relationships, rather than try to exhaustively quantify each. It's probably futile to try to quantify multiple disparate concepts in a comprehensive rendering, since there are multiple dimensions for multiple concepts (hyperspace required!). As suggested above, concepts such as feedbacks could be ordered in separate lists/tables.
- The blocks I entered into the PNG graphic were those most generally disclosed in the cited references. If a table is pursued, I think the contents of those should generally be included in the table (some seem to be omitted).
- Some of the field (left) column entries might be simplified to eliminate
heating, to leave: Air, Land, Ocean. - "Feedback" deserves a row: there has been a text (sub)section devoted to it, after all. I even prefer "feedback and tipping points".
- The cumulative risks row stands in for the summary items in the flowchart, like human migration and conflict.
- These complaints apply even more to the flowchart though. For instance, ecosystem loss of arctic and great barrier reef doesn't connect to the causes of ice sheet melt and coral bleaching, habitat destruction is only taken as a direct outcome of climate change and not a result of all the other types of damage, it's confusing having separate boxes for direct impact on human health and direct physical harm to humans, etc. I think the table actually does a better job of organizing the information, because it clearly scopes effects to a space.
- Agree
- Agree, although data is good too. Our first two graphics are very good I think, and they present data in a summary form.
- I just revisited the table and flowchart side by side and tried to edited the table to include everything from the flowchart that were effects on the environment and humans, although there is some editorial selection (like biodiversity loss / ecosystem collapse I think make the point of "species extinction" without saying it explicitly). I also added a few things, like fishery and tourism losses (you had zero impacts on humans from ocean heating). The scope is limited to effects because the idea is to replace the flowchart in its current location. Efbrazil (talk) 17:49, 1 April 2020 (UTC)
- The row headers are meant to capture the change that leads to the impacts in the rest of the row. I added a newline between air and heating, which makes it look less weird I think. Having "air" on its own wouldn't work.
- I added "Climate tipping points crossed" to cumulative effects, but I think individual feedbacks work better as a list in the feedback section.
- Efbrazil (talk) 17:49, 1 April 2020 (UTC)
- Graphics and tables clearly have respective advantages: visual portrayal versus conceptual organization.
- Specific detail: (disease-carrier) "impact on human health" versus "direct physical harm to humans" (e.g., pandemics versus hurricanes) reflects a biological versus physical distinction that I think is important.
- New idea: adapting Nassi–Shneiderman diagrams as a "graphic-like" textual rendering, could conceivably show causality in a more ~visual way than a category-based table. However the unexpectedly strong rejection-of-new-things experienced here with warming stripes makes me think it wouldn't go far. I mention it to provoke thought. —RCraig09 (talk) 17:07, 4 April 2020 (UTC)
- Yep, you know I'm all about visual portrayal if possible. I understand "show", but for effects I think that mostly amounts to showing things like flooded coastal cities, bleached coral, and the like. Stuff people care about, ignoring stuff like starving polar bears that seem very remote. We could add maybe another picture or two like that?
- I can't figure out how assembling all effects would work better with Nassi-Shneiderman. I think the table does a pretty good job of organizing the info coherently.
- I tweaked the table again to add acidification and shellfish. Are you OK if I swap the table in for the causes and effects flowchart you made? If not, do have a different thought on a path forward? Efbrazil (talk) 22:25, 6 April 2020 (UTC)
- Preliminarily, I think the lead is best served by causes+effects than the Greenhouse Effect since the GHE is an underlying internal mechanism—not actually the reason most readers come here (+, GHE isn't mentioned in the lead and doesn't even have its own section or subsection). Unfortunately, the GHGas section is already populated with images to a degree that some(not me, with a 1600x900 desktop screen) find objectionable if exceeded. :-\
- Besides the visual(show) vs. textual(tell) distinction discussed above, the table (1) categorizes into land/sea/air categories what in reality is a very interrelated system that circulates energy constantly, and (2) masks complex causal relationships. . . . To explain #2: I mean that sometimes an Effect on Humans is a direct result of heating(s) in left column; other times an Effect on Human is a result of something in the Effect on Environment in the middle column; other times one item in the left column is caused by other items(s) in the same left column. Within Wikipedia it's easier for a community to tweak text than images, but the flow diagram reflects a reader-centric sensibility.
- Sadly we don't have a large enough community (n=3 so far) to gauge a larger consensus. —RCraig09 (talk) 19:29, 7 April 2020 (UTC)
- I'm sort of hoping this deadlock will be solved during FAR. We could also tag a few people that have participated in recent GW discussions. Femke Nijsse (talk) 20:07, 7 April 2020 (UTC)
- I'm thinking we dump both the table and the flowchart at this point, since neither is winning anyone over. I'm going to focus today on creating a gallery of images that capture impacts. The good thing about galleries is they change shape to fit smartphone screens, and it "shows" instead of "tells". Efbrazil (talk) 17:29, 8 April 2020 (UTC)
- — A non-prominent gallery of photographs seems like a good idea in principle—assuming it will be ~scientific in nature and not merely 'tug at our heartstrings'.
- — Given the fact that there are entire sections titled 'Physical drivers' (i.e., causes) and 'Climate change feedback' and 'Effects', and most are discussed in the lead... definitely a cause/effect portrayal(flow diagram, or table) is critical, very much preferably in the lead. In this context, causality is paramount: the article answers the questions readers must be asking: "What causes global warming" and "What causes the effects being experienced" —RCraig09 (talk) 17:45, 8 April 2020 (UTC)
- Thanks Craig, yeah, I'll work to avoid sad polar bears or attributing everything that goes wrong to climate change. I want to try and get the same coverage we have in the table / flowchart though, since the idea is to replace those. Efbrazil (talk) 18:30, 8 April 2020 (UTC)
- I added 2 galleries for effects on the biosphere and effects on humans. The sad polar bear even made a comeback, cuz I couldn't find a better image on polar ecosystem impact, plus I'm lazy and that picture already had referenced text I could resurrect. We need one or two more biosphere pictures, but I think the structure is there and good. You agree I hope? As for the lede image, I'll add comments at the end of this talk page. Efbrazil (talk) 21:04, 8 April 2020 (UTC)
- I agree that the reasonably-sized galleries are appropriate. Kudos.
- However, in retrospect: a graphic that portrayed concepts central to the article (causes, effects, feedback) was demoted in what you perceived was an "open season" to move things, and deleted to make way for a collection of a select few images that do not even show causation. The flow diagram has in effect been replaced with a graphic for the GH Effect, which is not even mentioned in the lead and hasn't warranted a separate section or subsection, and that is "a work in progress" at best and "hated" at worst; the reasonable short-term solution is to restore the old GHE graph and move it down, rather than amend the lead to justify an in-process graphic. Whereas you have presented arguments against the flow diagram—based mostly on formal grounds and issues internal to Wikipedia—I don't perceive you've squarely responded to my arguments—which I believe have been substantive and reader-centric—but instead acted without consensus. Please take time to consider this history before proceeding. —RCraig09 (talk) 21:52, 8 April 2020 (UTC)
- I'm thinking we dump both the table and the flowchart at this point, since neither is winning anyone over. I'm going to focus today on creating a gallery of images that capture impacts. The good thing about galleries is they change shape to fit smartphone screens, and it "shows" instead of "tells". Efbrazil (talk) 17:29, 8 April 2020 (UTC)
- I'm sort of hoping this deadlock will be solved during FAR. We could also tag a few people that have participated in recent GW discussions. Femke Nijsse (talk) 20:07, 7 April 2020 (UTC)
- About the gallery, at first I was a bit chocked and my inner conservative screamed no. Upon further tinkering and reflection, I think it can work. A few comments:
- @Efbrazil:; could you make sure all the essential information is present in the cites? Currently, the carbon brief lacks authors, the coral reef cite lacks an author (NOAA), the polar bear one only has a short cite, without any corresponding info in the full cite causing an error, and so forth. I'm willing to put the references in the style we agreed on, as long as the starting references are complete.
- The captions are a bit too long, causing ugly white space. There are two solution; make them shorter and/or crop the images to be a bit wider. I think five lines of caption should really be the max. Femke Nijsse (talk) 07:35, 11 April 2020 (UTC)
- Glad you think it can work! I'll try to fix those issues today. Efbrazil (talk) 15:52, 11 April 2020 (UTC)
- I tried trimming the captions. Note that the gallery tag uses dynamic resizing, so you may see more or less text wrapping depending on your screen width. I tried to make it so that the width of the galleries is similar and typically one screen width on a laptop.
- I added the European heat wave last summer. I could trim sad polar bear width, move australian fires up to biosphere, and then pop this into human impacts to capture crop failure- thoughts? https://commons.wikimedia.org/wiki/File:Corn_shows_the_affect_of_drought.jpg
- I moved the biosphere gallery up to avoid having them so close to human impacts- feel free to move it back if you think that was a mistake- the old place was better except for the spacing issue. It's a bit weird to me that the text section on human impacts is so much larger than biosphere impacts (maybe that section needs to be filled out more?)
- I tried updating sources, let me know if I fell short in places. For places where there's no author I just listed the publisher- for instance NOAA is the publisher, not the author, right? Efbrazil (talk) 17:51, 11 April 2020 (UTC)
Animated GIF for causes and effects?
- Since some of the objection to the January flow diagram related to text size issues, I'm floating the idea of an animated GIF: A sequence of simpler cause-and-effect diagrams that spread out content in the time domain to alleviate crowding issues in the space domain. This proposal would still involve text, but less intensively at any given instant than the January flow diagram. Yes, it wouldn't be as quickly editable as "real" text, but it would perform the crucial task of considering what readers are seeking and illuminating main points as listed in the Table of Contents: causes, effects, feedback. For obvious time-investment reasons, I won't proceed unless there's some affirmative indication such an approach would likely meet consensus (after discussion and fine-tuning here, of course). —RCraig09 (talk) 18:15, 21 April 2020 (UTC)
- Parallel suggestion: Convert the recent galleries of "effects" images into an animated GIF and place into the lead.—RCraig09 (talk) 18:15, 21 April 2020 (UTC)
| Some climate change impacts |
|---|
|
![Image 1Repeated coral bleaching has been damaging the Great Barrier Reef and threatens reefs worldwide.[1]](/wiki/File:Bleachedcoral.jpg)
![Image 2Unusual drought and higher temperatures produced the historically large 2020 bushfires in Australia.[2]](/wiki/File:Orroral_Valley_Fire_viewed_from_Tuggeranong_January_2020.jpg)
![Image 3Permafrost thaws as the Arctic warms, undermining infrastructure and releasing methane in a positive feedback loop.[3]](/wiki/File:National_Park_Service_Thawing_permafrost_(27759123542).jpg)
![Image 4Populations of Arctic animals like polar bears rely on disappearing sea ice for habitat.[4]](/wiki/File:Endangered_arctic_-_starving_polar_bear_edit.jpg)
![Image 5In Colorado a greater number of mountain pine beetles survive winters, killing large swaths of forest.[5]](/wiki/File:Mountain_Pine_Beetle_damage_in_the_Fraser_Experimental_Forest_2007.jpg)
![Image 6Desertification in the Sahel region of Mali threatens to displace populations in areas where rainfall is already sparse.[6]](/wiki/File:Village_Telly_in_Mali.jpg)
![Image 7Agriculture is being impacted by droughts, rising temperatures, loss of glacial-fed rivers, and extreme weather.[7]](/wiki/File:Corn_shows_the_affect_of_drought.jpg)
![Image 8Tidal flooding in Venice, Miami, and other coastal cities increases as sea levels rise.[8]](/wiki/File:Acqua_alta_in_Piazza_San_Marco-original.jpg)
![Image 9Southern Bangladesh after the passage of Cyclone Sidr. Increased rainfall from storms and rising sea levels can lead to catastrophic flooding.[9]](/wiki/File:US_Navy_071120-M-8966H-005_An_aerial_view_over_southern_Bangladesh_reveals_extensive_flooding_as_a_result_of_Cyclone_Sidr.jpg)
![Image 10Heat waves like the one in Europe in 2019 are becoming more common and extreme.[10]](/wiki/File:The_heat_is_on_ESA19461898.jpeg)
- Sorry for not seeing this before. I'm glad you're sticking with this. I agree that featuring effects is important, although I don't want to come across as alarmist and I'm not sure feedbacks are important to cover up front.
- I don't know that an animated GIF will help if the flowchart is going to remain mostly text. I also don't think an animated GIF would work because you can't have the text embedded- it might just look like an alarmist carousel of natural disasters.
- See on right for the effect of turning the effects galleries into a slideshow and then putting it in the sidebar. The relevant help topics are https://en.wikipedia.org/wiki/Template:Random_slideshow/doc and https://en.wikipedia.org/wiki/Template:Sidebar. It's a bit iffy- sizing is not going to match other thumbnails on all resolutions and it'll render as 10 images in a row on smartphone, and I expect standards people will have a problem with it if we put it in the summary section. Still, it's kinda nifty I think, maybe worth pursuing. Maybe we'd pull out 2 or 3 of the less important or redundant images and make them thumbnails in the effects section. Thoughts? --Efbrazil (talk) 17:02, 3 May 2020 (UTC)
- It seems we disagree on whether a concise presentation of the many reliably-sourced GW effects, including feedbacks, is 'alarmist'—or merely alarming as those reliable sources agree. It's those many effects (along with GW's few causes) that are what's essential to communicate prominently. —RCraig09 (talk) 19:20, 3 May 2020 (UTC)
- To save valuable space, an image slideshow is excellent, and slideshow elements are easier to edit than a GIF. Definitely, the images should not be dwarfed by surrounding whitespace, but I couldn't find a size parameter/control in the template documentation. —RCraig09 (talk) 19:20, 3 May 2020 (UTC)
- Glad you like the slideshow approach! I imagine there's a way to collapse whitespace with enough ingenuity. I'll take that as my next task, then post the result down at the bottom of this talk page if I succeed. I am worried we'll get push back regarding standards though- people will say there's too many pictures in the summary, or that galleries can't go in the summary, but no harm in trying.
- Regarding alarmist vs alarming, I just want to make sure that anything alarming is not just correct, but that anyone doubting it can immediately read the text that explains it in a super grounded way. Efbrazil (talk) 19:50, 3 May 2020 (UTC)
add WaPo RSs, since 2020 Pulitzer items?
- Staff of The Washington Post; For a groundbreaking series that showed with scientific clarity the dire effects of extreme temperatures on the planet Pulitzer.org 2020 Pulitzer Prize for Explanatory Reporting
X1\ (talk) 09:46, 7 May 2020 (UTC)
Fixing Temperature Charts


@RCraig09: The temperature charts shown on the right need lots of work. There's very good content in them and I see no reason to throw out the intent behind the charts, but they need to be rebuilt from the ground up to be professional quality.
The same applies to the sea / land temperature chart and the top temperature chart, both of which I worked on. They should all be standardized, professionalized, and brought into alignment.
I'm happy to make all the changes, but I figure you created the charts on the right so maybe you'd rather take a crack? It's really up to you, I'll start hacking away next week unless you'd rather do the work.
Here are some of the top line items I'd fix, although I'm sure more would occur to me as I do the work. Feel free to add to the list and critique the other temperature charts... Efbrazil (talk) 20:11, 7 February 2020
- @Efbrazil: Thanks for sharing your thoughts. I had not consciously focused on making images exactly consistent with each other, much less consistent with other editors' existing images. You make some good points, regardless. Since you're talking about harmonizing the two images at right with two existing images, it might be best if one individual did the work. I'll take a look at my original Photoshop psd files (would you use Photoshop?) within a few days, but I'll respond to the points below, probably Saturday 8 Feb. —RCraig09 (talk) 05:09, 8 February 2020 (UTC)
- I think Efbrazil is making a good point. The fact that the images aren't of professional quality is also the reason I was against including them when that discussion was helt. I'll probably change my opinion on that if we can get them professional :). Femke Nijsse (talk) 15:00, 8 February 2020 (UTC)
- Thanks to both of you for your support on this. I agree with one person doing the work. I am mostly free to do the work next week, but I have no complaint if Craig09 wants to do the work instead. It will be a lot of work to get things right. I personally just use Powerpoint for graphics. I used to work on the product team there, so I know all the ins and outs of how to get poster quality content out of it. The only downside is there's no native svg editing, so I need to directly edit the markup on svg files (the top graph is svg). Also, I tweaked my comment on fonts- that's the big kahuna in terms of work here aside from professionalism- making the thumbnails and smartphone view legible. --Efbrazil (talk) 17:18, 8 February 2020 (UTC)
- Real natives edit SVG directly, right? :-) ♦ J. Johnson (JJ) (talk) 23:57, 11 February 2020
- Later today, I'll add comments in the individual sub-sections below. Then, within a day or two, I plan to correct the basic problems inside each of the two images at right, and then step aside to let you (Efbrazil) harmonize all four images. Also, I can send you my PSD (Photoshop) files directly, if that would help. —RCraig09 (talk) 17:24, 8 February 2020 (UTC)
- Thanks to both of you for your support on this. I agree with one person doing the work. I am mostly free to do the work next week, but I have no complaint if Craig09 wants to do the work instead. It will be a lot of work to get things right. I personally just use Powerpoint for graphics. I used to work on the product team there, so I know all the ins and outs of how to get poster quality content out of it. The only downside is there's no native svg editing, so I need to directly edit the markup on svg files (the top graph is svg). Also, I tweaked my comment on fonts- that's the big kahuna in terms of work here aside from professionalism- making the thumbnails and smartphone view legible. --Efbrazil (talk) 17:18, 8 February 2020 (UTC)
- I think Efbrazil is making a good point. The fact that the images aren't of professional quality is also the reason I was against including them when that discussion was helt. I'll probably change my opinion on that if we can get them professional :). Femke Nijsse (talk) 15:00, 8 February 2020 (UTC)
@Efbrazil: I think we need to coordinate how much I should do to the basic images before you begin harmonization. At the very least, we must all decide whether-&-which images should be combined/eliminated (discussion below, re redundancy). My PSD files are very much "layered", and it would not be easy for you to modify from a resulting PNG; I could send you the smaller elements that went into the making of my two images. After considering my comments from tonight in following sub-sections, let me know what would make your process easiest. —RCraig09 (talk) 04:34, 9 February 2020 (UTC)
- It's hard for me to say what would be helpful in terms of source content until I dig into the content and start rearranging things, but of course more is better (data, source images, etc). I'll add asks stuff to this thread if I get stuck. --Efbrazil (talk) 22:45, 9 February 2020 (UTC)
Distorted, inconsistent font use and inconsistent font sizes
Between the charts shown here, the left hand side fonts are too small and the right hand side is distorted and mismatched, and they're inexplicably different from each other. The charts need fonts standardized across the board. Same applies to the 2 temperature charts I made.Efbrazil (talk) 20:11, 7 February 2020
The big part of this work is going to be zooming the smallest fonts, which means changing the text in several places to favor brevity. The font type and size when viewed on a smartphone should ideally match the wiki text. This issue applies to all 6 of the charts.Efbrazil (talk) 17:18, 8 February 2020 (UTC)
- I can appreciate the general goal of making important text readable on both big and small screens. The only exception might be to include some text purposely so tiny (such as sourcing, or confidence interval explanations, or reference indicia like "1901-2000 average") that casual users won't even notice or care about, but scrupulous researchers will want to see without clicking through to the Wikimedia page. I purposely put such tiny text inside the images themselves, to avoid cluttering the textual captions for our predominantly non-scientist readers. It's a judgment call, more formal than substantive, and not a huge issue for me. —RCraig09 (talk) 03:34, 9 February 2020 (UTC)
Smartphone rendering for the images needs to be fixed
Most people use wikipedia on a smartphone and the charts should simply look good there- be full width and be legible without zooming unless it's essential (in which case landscape mode should work, like it does for your causes and effects chart).
The images on the right look like they are optimized for PC thumbnail / zoom view, but having a few crazy big fonts and some super tiny fonts is not good. It makes it so the content is both unusable on a smartphone and too unprofessional to use in a presentation. The goal should be a legible thumbnail view whenever possible.
Also, the current wiki embedding markup is resulting in the images being badly shrunken on smartphone. That issue applies to the land / sea graph as well. The wiki embed formatting needs to be fixed. Efbrazil (talk) 20:11, 7 February 2020
- I had no problem viewing images in the the side-by-side { { multiple image ... } } markup (iPhone7, iOS 13.3.1), though if you are having trouble viewing, then so must others. Placing them vertically would make the images spill over onto ensuing sections of the article (bad). Combining images (consolidating them, per your suggestion in an ensuing section) may be a solution; I'll continue discussion there... —RCraig09 (talk) 03:41, 9 February 2020 (UTC)
The giant arrow showing zoom is a pixelated mess
Needs to be fixed. Efbrazil (talk) 20:11, 7 February 2020
- 9sptfAq5VYDNKYYeVbCPaLtKuc7N2B58GKo3wPG4GSMTpeqnj5QQUwsNriGb Yep. I'll clean that up, before you (Efbrazil) take over. —RCraig09 (talk) 03:45, 9 February 2020 (UTC)

"Observed global warming" chart is almost entirely redundant with "Since 1880" chart
The two charts are essentially presenting identical data in entirely different formats. We already have too many graphs in this section, and having one of them presenting the exact same information as another one but with different labeling and fonts is not good. I think it could be best to combine the charts and turn the 2 graphics each with 2 charts into a single 3-stack chart. Efbrazil (talk) 20:11, 7 February 2020
- Good idea, methinks, though combining the left (temperature history) chart with the right (causation/attribution) chart definitely blends substantive concepts, which may be controversial here. I'm totally OK with it, though, especially if it solves a smartphone readability issue. If we combine those two charts into a single 3-panel image, then I think the present File:Global Temperature Anomaly.svg graph could be eliminated:'( altogether, and your proposed 3-panel image may completely replace it at the top of the article. I this case, we would have only three panels, not four, to deal with in this process. —RCraig09 (talk) 04:08, 9 February 2020 (UTC)
- FYI: I mention the File:800,000-, 2,000-, 139-year global average temperature.png graphs at right would provide even more time perspective, though that chart was disfavored by others on this page in October 2019. —RCraig09 (talk) 04:08, 9 February 2020 (UTC)
- Generally: I think any temperature chart should emphasize with broader lines the smoothed/moving average (as in the left chart), not the individual years' temperatures (as the dots in File:Global Temperature Anomaly.svg): emphasize trend over annual variations. —RCraig09 (talk) 04:08, 9 February 2020 (UTC)
- I like the 3 stack chart, but it does take a lot of space for just making the point that recent warming is atypical. The trouble with SVG elimination is that it's already translated into about 20 languages and is a good "summary" graph. SVG is always better than PNG when you can pull it off, because it zooms reliably and takes up less download bandwidth. I can change the SVG as you say though- to emphasize the trend and not individual years. --Efbrazil (talk) 22:45, 9 February 2020 (UTC)
- I upgraded the global temperature anomaly graph to emphasize the trend line like you suggested, among other tweaks. The graph is used in a lot of places and is being responsibly edited by a lot of people so I didn't go too far with changes. Plus the only way to edit the file is to edit the xml directly. Efbrazil (talk) 01:16, 12 February 2020 (UTC)
- @Efbrazil: Thanks for your time and expertise in updating this widely-used chart! I think it's a definite improvement. In the next version, maybe consider:
- (1) making the spikey annual trace lighter or non-existent (see File:20191021 Temperature from 20,000 to 10,000 years ago - recovery from ice age.png as an example of separate dots) so that the smoothed trace is much more dominant than the spikey annual data,
- (2) remove or make lighter, the grid of horizontal and vertical lines (lay readers don't need precise grid lines),
- (3) change "Temperature vs baseline" to "Temperature change" (less technical, for lay readers), and
- (4) consider eliminating the "Annual mean" and "Five year average" legends altogether as being unnecessary to those who understand smoothing, and confusing to those who don't. —RCraig09 (talk) 06:32, 13 February 2020 (UTC)
- I agree with (2) and (3), and have no strong opinion on (4). I disagree in (1) that points are an improvement over a line. If something is a timeseries, line is really the scientific standard and I would feel quite uncomfortable not following that. I agree that the smooth should be dominant, but a light grey or blue line should work. Femke Nijsse (talk) 20:02, 17 February 2020 (UTC)
- All these changes mean tossing the work of others, and I wouldn't make any of them. I strongly disagree with 3, and dislike 1 and 2 and 4 although my disagreement isn't as strong. (1) I already faded the absolute line in response to Craig's ask, I think that's good enough, although it could be faded more. There's nothing magical about a 5 year moving average, some us 10 years. Showing the real data is important I think, so I wouldn't remove the line. (2) Is the work of others and is very helpful for seeing where temperature has precisely been year to year- this is not fuzzy modeling type data, it is real data. (3) Is really just incorrect. Measuring temperature change means measuring how much temperature changes each year. So if it goes up .1 degree one year to the next the graph should show .1 degree. Maybe "Temperature vs 1951 to 1980 Average (c)" would be better, although that goes against Craig's intent. (4) Is helpful I think and has already been localized into a couple dozen languages. In general, I think these are fixes in search of a problem that doesn't exist. Efbrazil (talk) 19:28, 19 February 2020 (UTC)
- To clarify: My point "(1)" meant only that the line could be lightened more or eliminated, not the actual data points (which I agree should remain!). Also, "Temp vs baseline" is one type of the non-techy word, "change". I can't comment re the history of politics at Commons, so I'll acquiesce in its present less-than-ideally-friendly-for-non-scientists state after having left my suggestions on the Commons' image page's Talk page. —RCraig09 (talk) 02:17, 20 February 2020 (UTC)
- All these changes mean tossing the work of others, and I wouldn't make any of them. I strongly disagree with 3, and dislike 1 and 2 and 4 although my disagreement isn't as strong. (1) I already faded the absolute line in response to Craig's ask, I think that's good enough, although it could be faded more. There's nothing magical about a 5 year moving average, some us 10 years. Showing the real data is important I think, so I wouldn't remove the line. (2) Is the work of others and is very helpful for seeing where temperature has precisely been year to year- this is not fuzzy modeling type data, it is real data. (3) Is really just incorrect. Measuring temperature change means measuring how much temperature changes each year. So if it goes up .1 degree one year to the next the graph should show .1 degree. Maybe "Temperature vs 1951 to 1980 Average (c)" would be better, although that goes against Craig's intent. (4) Is helpful I think and has already been localized into a couple dozen languages. In general, I think these are fixes in search of a problem that doesn't exist. Efbrazil (talk) 19:28, 19 February 2020 (UTC)
- I agree with (2) and (3), and have no strong opinion on (4). I disagree in (1) that points are an improvement over a line. If something is a timeseries, line is really the scientific standard and I would feel quite uncomfortable not following that. I agree that the smooth should be dominant, but a light grey or blue line should work. Femke Nijsse (talk) 20:02, 17 February 2020 (UTC)
- @Efbrazil: Thanks for your time and expertise in updating this widely-used chart! I think it's a definite improvement. In the next version, maybe consider:
- I upgraded the global temperature anomaly graph to emphasize the trend line like you suggested, among other tweaks. The graph is used in a lot of places and is being responsibly edited by a lot of people so I didn't go too far with changes. Plus the only way to edit the file is to edit the xml directly. Efbrazil (talk) 01:16, 12 February 2020 (UTC)
- I like the 3 stack chart, but it does take a lot of space for just making the point that recent warming is atypical. The trouble with SVG elimination is that it's already translated into about 20 languages and is a good "summary" graph. SVG is always better than PNG when you can pull it off, because it zooms reliably and takes up less download bandwidth. I can change the SVG as you say though- to emphasize the trend and not individual years. --Efbrazil (talk) 22:45, 9 February 2020 (UTC)
To avoid wasted effort and mid-course corrections, I want to emphasize:
- A. Our audience is predominantly non-sci/techy. This critical fact suggests any new charts embody the following:
- A1. Make only the most important traces dominant: use solid lines, strong colors. (Any less important traces: partially transparent or light gray, thinner lines, etc.)
- A2. Minimize dominance of grids: discerning exact numerical values isn't appropriate for expressing concepts and trends to the public (fewer grid lines,less 'granulatiry' less solid, more transparent) (example)
- A3. Eliminate sci/techy words (drivers, forcings, anomaly, baseline, mean) that the public won't immediately understand. Substitute accurate common terms (causes, forces, change, average).
- A4. Make legends—if they're needed—friendlier (not in a separate box); instead put color-coded label next to relevant traces (example) This is akin to "show, don't tell".

- B. Re Attribution/Causation chart: Parallel to discussion in "Cut the "Forces affecting global temperature" graph?" (three sections below)
- B1. A first issue is whether to combine the three natural causes (forcings) in the attribution/causation chart into a single "natural causes" trace. Efbrazil was concerned that showing three specific natural causes is "cheating" while I think the (small, non-correlated) natural causes in practice cancel each other out so that showing plural natural causes is not cheating. Also, identifying separate natural causes exudes a data-driven analysis—rather than a vague conclusion re generic natural forces; it's better to show (data) rather than tell (general conclusions).
- B2. Conversely, a second issue is whether to break down the "human forces" into smaller component traces (presumably greenhouse gases, deforestation, agriculture?). This could be done, but GHGs are so dominant a cause that I think it isn't worth the added complexity for minimal additional edification.
- B3. Efbrazil, you were worried about "explaining" the flat portion of the "human forces" model through the ~1970s and a short valley in the early 1990s: These are present in all the charts I've seen, and WP editors don't need to (in fact, should not) "explain" reliable sources. Do you still think it's a problem?
- B4. In short: I favor breaking down natural causes (since they're all comparably weak), but leaving human causes broad (because one human cause does dominate all others).
- P.S. @Femkemilene: I realize you've already commented on A1-A4, but I think your subject matter expertise would be particularly valuable re B1-B3. 21:19, 21 February 2020 (UTC) and RCraig09 (talk) 21:24, 21 February 2020 (UTC)
- A1 Agreed- key point should be instantly clear
- A2 There's two sides to this. The grids can help with reading the graphs and make it clear they are real data, not some spark line data. My general approach is to fade the lines to nearly transparent so they're there but not obtrusive. If you really hate grids I guess we can kill them- I didn't put them into the temperature graph, that was somebody else a while ago, I actually faded them a ton already.
- A3 Only if it can be done using words that are scientifically correct. As mentioned above a good example of going to far is replacing "vs baseline" with "change" on the temperature graph- "change" means the rate of change on every scientific graph I've seen, so using it in place of "vs baseline" is jarring and looks wrong. For clarity, we could switch to using real world temperature instead of a baseline comparison.
- A4 The key issue here is that it's terrible for localization- strings need to be easily changed and be made longer or shorter.
- B1 Clarity yes, biased propaganda no- I mean, all natural causes pale in comparison to aerosols, yet we aren't breaking out aerosols from greenhouse gases.
- B2 I think we can resolve this by having a vertical bar graph beneath the "human" vs "natural" causes, like this but vertical and having the y axis be degrees celcius of warming. It's on my todo list next week.
- B3 Judging from this graphic, it appears that aerosols counterbalanced GGE during that time. It would be good to add that to the article at some point. Efbrazil (talk) 23:34, 21 February 2020 (UTC)
- A1. ✔
- A2. ✔ Grids: Widely spaced, lighter gridlines are fine with me; you didn't need to delete altogether. Goal: not to distract.
- A3. Wording: I can't remember ever seeing "change" meaning "rate of change". What's your experience, Femke?
- A4. Legends: re localization: I'm just getting familiar with Inkscape, and don't quite see why separate labels would be less changeable, but it's not a huge issue. It's just that list-style legends demand back-and-forth eye movement, which makes non-sci/tech readers work and could make color-blind people struggle.
- B1. Combining natural causes: I'm not understanding the reference to propaganda. I've now labeled my earlier conclusion paragraph "B4." (above) and hope that clarifies. Not breaking out aerosols has only to do with human causes, not to compare aerosols alone to natural causes.
- B2. Bar graph: That sounds like a new topic. FYI: File:Radiative forcing 1750-2011.svg is already in the article under "Physical drivers". (I just didn't want to rely on a bar graph instead of a line graph, since that would be closer to telling than to showing.)
- B3. Aerosols: I notice that File:Radiative forcing 1750-2011.svg (already in the article) portrays aerosols.
- B4. (Newly labeled above.)
- —RCraig09 (talk) 04:23, 22 February 2020 (UTC)
- A1. ✔
- A2. ✔ (don't delete altogether)
- A3. While I don't think I've seen it used as rate of change, I think we should go for vs baseline, as a confusion rate as low as 2% in our readers would be bad.
- A4. I agree that legends are better placed next to line. For translations it would be more difficult with some software (f.i. python), but that's alright I think considering gain.
- B1/B3/B4. I think it's fair to break out aerosols from GHG, and break out natural causes. Aerosols are massively uncertain and our biggest obstacle therefore to predict future warming. It's only fair to put it in.
- B2. Would that not be duplicative with the causes timeseries graph? I prefer keeping the graph that's in there, to reflect different ways of looking at it.
- C1. I'm not sure whether the arrows are still on the table for this/other graph. Wouldn't it be better to have a gif instead? I find the arrows quite distracting even if we fix the resolution. In a gif we can have the normal graph as first frame, a red square around zoomed in area in second, and then the new graph in third? Femke Nijsse (talk) 10:14, 22 February 2020 (UTC)
- B1/B3/B4: It seems that Ef's new simplified causation/attribution chart is a good replacement for my "old" dual-panel causation/attribution chart, and Femke's general idea for a GIF would be a good replacement for my "old" dual time chart with big arrow. Femke, I don't quite understand the details of your GIF suggestion, but I'm sure it would work (save space, draw attention, simplify the concept of how unusual the present warming is). —RCraig09 (talk) 22:33, 22 February 2020 (UTC)
Gray background is unusable in slides, not consistent across graphs
I would prefer a white background on all visuals, it makes it easiest to reuse and edit the content. At the very least, the two graphs shouldn't have different gray backgrounds. Efbrazil (talk) 20:11, 7 February 2020
- Yes, after our cause-effect discussions in January, I appreciate uses outside Wikipedia itself (slideshows). My early perception was that our readers, being predominantly non-scientists, might find graphs like File:Global Temperature Anomaly.svg dry and not eye-catching. I have learned to largely surrender colored backgrounds (first career: engineer), but I still think a light gray border helps to aesthetically "frame" the content we are trying to emphasize to public readers. I certainly won't argue, though, since this is a scientific subject in a high-visibility article. —RCraig09 (talk) 04:18, 9 February 2020 (UTC)
US units instead of international
We should either have Celsius, or both on the graph. Femke Nijsse (talk) 20:08, 8 February 2020 (UTC)
- You are correct. Sadly, the elements in the source for the right image were published in the National Climate Assessment by the U.S. Government—a notoriously Fahrenheit organization! Especially if images are combined, I favor Celsius consistency and harmonization. ☺ —RCraig09 (talk) 04:22, 9 February 2020 (UTC)
- Agreed, I'll standardize on Celcius. Efbrazil (talk) 22:45, 9 February 2020 (UTC)
- Celsius certainly should be included. But because because many Americans – who are the most significant block of CC deniers – are not familiar with Celsius I think there needs to be some accommodation. Could we have the equivalent Farhenheit temperatures on the right side? Or at least perhaps a mention that 2°C = 3.6°F? ♦ J. Johnson (JJ) (talk) 23:49, 11 February 2020
- I agree it would be helpful, but it's not easy. I can't add Farenheight to the existing graphics without substantially cluttering things, and if I do it for one I'd want to do it for all. Is it worth the added clutter and breaking localization of the graphs? Maybe we could add links in the captions of the existing Celcius graphics to Farenheight versions of the same graphics, but that would be a significant amount of work to get going and to maintain going forward, and I'm not sure how much they'd get used since you'd have to click into them. I'll keep thinking about it. Efbrazil (talk) 18:34, 12 February 2020 (UTC)
- Celsius certainly should be included. But because because many Americans – who are the most significant block of CC deniers – are not familiar with Celsius I think there needs to be some accommodation. Could we have the equivalent Farhenheit temperatures on the right side? Or at least perhaps a mention that 2°C = 3.6°F? ♦ J. Johnson (JJ) (talk) 23:49, 11 February 2020
- Agreed, I'll standardize on Celcius. Efbrazil (talk) 22:45, 9 February 2020 (UTC)
- If it was easy, it would already have been done, right? :-)
- Or more likely the formatting is set deeper in the process, so it has more dependencies. Still, I think there is some scope for adding Fahrenheit. E.g., in the "Observed GW" chart above, the first and third panels have some room for a scale in reduced type. (And in any event I would suggest smaller type than for the Celsius scale, as the F. scale is derived, not in the original.) If not, then there is plenty of whitespace for an explanatory "[some typical range in C] = [the equiv. F]".
- As far as localization goes, perhaps en-us could call a version of a graphic with a Fahrenheit overlay. But you are right that we shouldn't have links coming from within a graphic, that would be too much to maintain. ♦ J. Johnson (JJ) (talk) 22:44, 12 February 2020 (UTC)
Cut the "Forces affecting global temperature" graph?
I love the idea, but I'm concerned about the reliability of this graph. It shows human-caused impacts as flat from 1930 to 1970 and in decline in the early 1990s. Is the graph saying that between 1930 and 1970 humans contributed nothing to climate change, and we momentarily cooled the planet in the early 1990s?
The 2017 article that's the basis for it is drawn from a 2013 paper that I can't get into to evaluate. It looks to me like human contributions might just be a "leftover" component in their graph, and that they were studying natural variability.
The graph just raises too many questions for me. I'd like to cut it unless someone has a better basis for defending it, like a recent source from NASA or the IPCC. --Efbrazil (talk) 23:43, 10 February 2020 (UTC)
- The existing 2017 attribution graph ("Forces affecting...") does suggest what you describe, but there's a danger if we as Wikipedia editors judge reliability based on our own personal perceptions. This graph's 1990s precursor, Robert Rohde's File:Climate Change Attribution.png, suggests a somewhat similar "modeled" pattern, so maybe that's what the
datadata+model(s) should show even if details seem counter-intuitive to us. 06:00, 11 February 2020 (UTC) See also this NASA "Earth Observatory" graph. —06:28, 11 February 2020 (UTC) The "human causes" include the climate-chilling effect of our aerosols through the 1980s (it's not all CO2/CH4); plus, it was the attribution chart chosen by NCA4. —RCraig09 (talk) 17:12, 11 February 2020 (UTC) - A PDF of the 2013 paper can be found at https://www.atmos-chem-phys.net/13/3997/2013/acp-13-3997-2013.pdf, and its title, "An empirical model of global climate–Part 1: A critical evaluation of volcanic cooling", does suggest its focus was not on differentiating human influence... but I'm not sure its focus matters as far as reliability goes. —RCraig09 (talk) 06:00, 11 February 2020 (UTC)
- I strongly believe that attribution should figure prominently in this article, and that images communicate much more effectively than text, especially to our predominantly non-technical readers. I think that if there's a better attribution graph, it could be compared to the current one and a substitution made if there are solid reasons. I can only say that I searched a long time before finding NCA4's 2017 Fig. 3.3, and I still had to adapt it to cleanly compare human to natural causation in a single graph. —RCraig09 (talk) 06:00, 11 February 2020 (UTC)
- Another brief search this evening for *.gov attribution graphs led me to Fig. 3.1 of the the same report (!), though that Fig. 3.1 undesirably compares natural-only versus observed, not the (desirable) natural versus human. —RCraig09 (talk) 06:00, 11 February 2020 (UTC)
- Thanks, all well said. Can you research the basis for the flatline from 1930 to 1970 and the dip in the early 90's? If we present this data, I would like to explain those anomalies. I'd actually like to position it directly under "Global Average Temperature" once the formatting is aligned. That accomplishes most of what your 2 stack chart does, while elevating visibility. Efbrazil (talk) 18:53, 12 February 2020 (UTC)
- I'll do some searching, but I'm not sure how easy it will be to extract a definitive explanation of a climate forcing model for any particular time period (other than noting, as I did above, the cooling effect of aerosols until their ban in the 1980s/1990s). In a chart, especially an intro image in a high-level article, I don't think it's necessary or even appropriate to 'explain' what one perceives as a limited-time-period anomaly, especially if (as noted above) other charts basically agree. —RCraig09 (talk) 19:05, 12 February 2020 (UTC)
- I was fussing with it today for quite a while, but I came back around to really not liking the chart in the first place. Why treat solar, volcanic, and "other natural" separately while leaving human factors combined? There's also the problems I raised before with the human factors data fluctuation not being explainable. Chart 3.1 from the same source is maybe better since it groups natural factors, but it still has unexplained human factors phenomena and has the problem of using multiple real world data sets for no good reason.
- The key thing we are trying to get at is the factors causing climate change, not charting their influence year by year. Make sense? Given that, I'm thinking the best thing to do is to adapt chart 3.2 from the same source, which is just a bar chart attributing recent temperature change to different causes. It's a confusing mess in it's current state, but I'm going to try to rebuild it for clarity. I'll first try to square it with the chart we already have in the article, which is "Physical drivers climate change" (reads like a typo). Both of them are as clear as mud right now, but I think they could be fixed to make the point we want to make. I'll tackle all that tomorrow. Efbrazil (talk) 04:09, 13 February 2020 (UTC)
- - What's good about the current chart is that it shows how the "multiple real world data sets" are all down-in-the-noise (relatively negligible) compared to the Human-caused trace. That is the "good reason" you refer to, for showing multiple non-human drivers. —RCraig09 (talk) 06:17, 13 February 2020 (UTC)
- - I think the key thing is showing (NCA4 Fig. 3.3 timewise graph) versus mere telling (Fig. 3.2 bar chart). In images we're trying to show what causes GW, and the current timewise graph based on Fig. 3.3 dramatically shows correspondence of drivers to the temperature-vs-time graph directly above them—adding credibility. In contrast, a bar chart is not much better than text, and merely tells a conclusion based on changes over a single reference time period, without showing attribution is based on data and thus leaving readers to question if the conclusion is credible. Graphs communicate far more than bar charts. Also, critically, a bar chart will change as the time period changes, rendering the bar chart wrong and not merely slightly outdated. —RCraig09 (talk) 06:17, 13 February 2020 (UTC)
- - Maybe there are better timewise graphs out there (I sent you (Efbrazil) a private Wiki-email... I may save you a lot of time 'fussing'!), but in any I strongly think a bar chart is a step in the wrong direction. —RCraig09 (talk) 06:17, 13 February 2020 (UTC)
- Thanks Craig, I understand what you mean about "show" vs "tell". The graph chart definitely has more intuitive impact than a bar chart, no argument there. That doesn't mean it doesn't have drawbacks, which is why I keep looking for a third way. I haven't found it yet though, and if I don't figure one out today I'll just be upgrading your temperature chart.
- The concerns I have about natural variability being broken out while human causes are not: First, I think it comes across as a "cheat" to have natural causes broken down so they seem smaller, while human causes are aggregated. Second, it would help a lot with making the point clearly if natural were grouped, since that's the key point being made (natural vs human). Finally, if something was going to be broken out, I'd like see it be greenhouse gas emissions, since that's really the driver behind warming. Aerosols and other human impacts are more in the "noise" category and would explain the flatlines and declines in temperature over recent history. Efbrazil (talk) 18:49, 13 February 2020 (UTC)
- I'll do some searching, but I'm not sure how easy it will be to extract a definitive explanation of a climate forcing model for any particular time period (other than noting, as I did above, the cooling effect of aerosols until their ban in the 1980s/1990s). In a chart, especially an intro image in a high-level article, I don't think it's necessary or even appropriate to 'explain' what one perceives as a limited-time-period anomaly, especially if (as noted above) other charts basically agree. —RCraig09 (talk) 19:05, 12 February 2020 (UTC)
- Thanks, all well said. Can you research the basis for the flatline from 1930 to 1970 and the dip in the early 90's? If we present this data, I would like to explain those anomalies. I'd actually like to position it directly under "Global Average Temperature" once the formatting is aligned. That accomplishes most of what your 2 stack chart does, while elevating visibility. Efbrazil (talk) 18:53, 12 February 2020 (UTC)
- I've just finished the single-panel version at right. It saves space and reduces redundancy problems, and I've applied others' comments here, re font size & background color. Details can be changed (e.g., adding Celsius, etc.). This condensed image may change our thoughts on overall arrangement of prominent images. Also, it makes any perceived anomalies (probably aerosol-related) seem less significant and less in need of ~explanation on our part.
- I empathize with the desire to have some datasets combined and others distinguished, but, hey, the NCA4 chose this Fig. 3.3 arrangement (not to forget its Fig. 3.1). I agree it's been difficult to find a single source that neatly and concisely combines the exact dataset arrangements we want so that we as WP editors don't have to violate WP:SYNTHESIS.
- Your comment re making natural causes "seem smaller" is very perceptive, but I think the traces actually show that the various natural forces are mutually random (uncorrelated) and thus tend to cancel each other out. The 13 Feb 2020 chart specifically disproves deniers' claims that solar, or volcanic, or El Nino, etc. are "causing" GW. Also, bunching natural forcing agents together makes the chart seem less data-driven, and appear less credible. Breaking out GHGs, aerosols, agriculture, deforestation, etc. would definitely be instructive, but might complicate the chart (which seems near its limit now). It seems like the cooling effect of aerosols could be appropriately mentioned in a textual caption, to avoid complicating the image itself. —RCraig09 (talk) 19:21, 13 February 2020 (UTC)
- In terms of aggregation and breakouts, Scroll down to figure 2.1 here, it's interactive. It lets you aggregate or break out human / natural causes. The report is from 2018 but unfortunately the influence data seems to cut off in 2010-ish.
- I like the combined chart, but it's stupid for both of us to be editing the same images at the same time. I had basically already made the image you have on the right. Can you send me the assets or let me know if you want to manage changes? Efbrazil (talk) 19:38, 13 February 2020 (UTC)
- Stupid is as stupid does! As it turns out, my Photoshop psd file from Oct 2019 would have been frustratingly klugey for you to work with. I'll try to break out and send more 'component' graphs by this weekend (maybe even Friday if my Valentine lets me!) I don't plan on making any more new charts without mentioning here first. —RCraig09 (talk) 19:55, 13 February 2020 (UTC)
- Great! I also have a very busy day tomorrow and won't be online much. I did research today rather than twiddling with images and will wait to mess with stuff until you hand it off to me so we don't duplicate effort. If you use this in interactive mode it's fun because you can choose whether to break out human or natural components, and it's already in svg format no less. It is clear that if you separate out human drivers into individual components that GGE are the overwhelming component of them, with stuff like aerosols acting as modest dampers, and natural components just noise. The view does turn into a mess of spaghetti if you choose to show everything and for some reason some of the influences model data is older, even though the report is from 2018. The solution the authors used for their static image was to render the same graph 3 different ways. For some reason the data does differ a bit from what you are showing.
- It is weird that the data from that interactive differs somewhat from your data. For instance, the human influence is a very jagged line in the interactive, and in yours it is weirdly smooth. Anyhow, my current thinking is we have a stack of 2 graphs like you suggest. The top will be the last 2000 years graph showing the spike at the end. The second would be similar to what you have on the right here, since it is the only one that has recent data and is a fair compromise. I'll probably go on a detour and try to turn it into a 3 stack chart, but then just end up where you already are. I wish we could do better, but CMIP6 should be out this fall and then it's all gonna get replaced anyhow. Efbrazil (talk) 00:21, 14 February 2020 (UTC)
- It's an excellent interactive, except for its not-so-updated data. I think its curves differ from mine (jagged versus smooth) because they may result from different climate models or even averages of models; they're not raw measurements of the same "data". I'm not sure what you mean at this point by a 3 stack chart (not sure what the third panel would be), but... stay in touch here! I'll get to work extracting parts of File:2,000- and 139-year global average temperature.png, at least, noting with sadness the bottom chart only had data through 2018. —RCraig09 (talk) 03:59, 14 February 2020 (UTC)
- Stupid is as stupid does! As it turns out, my Photoshop psd file from Oct 2019 would have been frustratingly klugey for you to work with. I'll try to break out and send more 'component' graphs by this weekend (maybe even Friday if my Valentine lets me!) I don't plan on making any more new charts without mentioning here first. —RCraig09 (talk) 19:55, 13 February 2020 (UTC)
Yes - I think you are right about older ios versions becoming increasingly niche. I don’t have much Android experience, but I looked at a few articles, and it looks like Android tablets are moving towards desktop web browsing experiences as well. Dtetta (talk) 17:06, 7 May 2020 (UTC)
Planned change to graph sequence (cuts, adds, rearranging)
Good news is PPT supports native saving to SVG now, so I'll look to have all text in SVG format. That also lets me make the effort to combine all temperature graphs that go from 1880 to today.
Changes I'm currently thinking of structurally, beginning at the top:
- World map of temperature change --> Keep, but convert to SVG so text zooms correctly
- Global average temperature --> The trick with this one is it's used all over the place, including being localized dozens of times. It's also good to have in an intro, to get the point across. I will keep it but update the graphic and include the latest data.
- Causes and effects chart --> No changes, although it should be convert to svg as well for localization.
- 2000 years to 140 years --> Rebuilt as per all comments above. I might look at switching the 140 year graph to include land / sea info, so we aren't being redundant with the top graph. I could also look to put in markers for the max and min temperatures over the last million years, to capture a bit of Craig's third graph showing the last 800,000 years.
- Observed temp and forcing --> see Cut the "Forces affecting global temperature" graph?
- Land / sea temp --> Cut as a separate graph, maybe incorporated into 2000 years zoom view if it doesn't look too weird
- Video of temperature changes --> Keep as is, I don't see much value in it but it's pretty to look at
Efbrazil (talk) 23:43, 10 February 2020 (UTC)
- - Good general thrust to a complex problem, though I'm concerned about a few things. (#5) Per my comments in the Cut the "Forces affecting global temperature" graph section, above, I do think a graph quantifying Attribution should figure prominently, regardless. (#7) Also land/sea might be confusing and inappropriate in a highest-level position; maybe it should stay in that Regional Trends section. (#4) The 14-degree range over 800,000 years would be far beyond the ~1.5-degree range of any 2,000 year graph (if I interpret your suggestion correctly). I think your original idea of combining two 2-panel graphs into a single 3-panel graph is most likely to succeed; I appreciate that a 4-panel graph including 800,000 yrs might be too much. —RCraig09 (talk) 06:22, 11 February 2020 (UTC)
- - Idea: In the Attribution graph: superimpose the red "Observed GW" temperature trace atop the blue "Human-caused" trace to emphasize the high correlation. This combination would allow one full chart to be eliminated from the mix. Aside: making the "Observed GW" trace be partially transparent would allow the models' traces to be emphasized as they should. —RCraig09 (talk) 18:28, 11 February 2020 (UTC)
- - I understand wanting to show attribution early on. If we want a graph, I think the best might be a Celsius version of the top graph in this article, because it's from a US government agency and shows uncertainty well, although it's low quality and an older data set so I'm not excited about it. It could be better to show a clear diagram of how CO2 / Methane create climate change, or perhaps a graph showing atmospheric CO2 / Methane / Temperature over time. There's a lot of those out there, but imho none of them are very clear at a glance. Efbrazil (talk) 20:03, 11 February 2020 (UTC)
- - The EPA graph is in some ways a good find though for a non-scientist audience, uncertainty may be confusing, which we should avoid especially in prominent introductory images in top-level articles. And I think a separate human-caused trace is substantively more demonstrative than the EPA's combined "natural and human factors" trace. The age of the EPA data is another reason to keep searching, methinks. —RCraig09 (talk) 23:04, 11 February 2020 (UTC)
- - Your suggestion for a CO2+CH4-->G.W. graph is right on track, but is one step short of affirmatively asserting that it is humans who cause CO2/CH4 in the first place. Also, it omits the cooling effect of aerosols—another human influence—before the ~1990s. —RCraig09 (talk) 23:04, 11 February 2020 (UTC)
- All true, I don't have a solution yet. Today I updated the first image to be SVG and include 2019 data (released on 1/15/2020) and to be super-high resolution. I checked and it looks good zoomed in or on smartphone. As an SVG the text can be selected and localized and zooms correctly. I expect programs like Google translate can also do stuff with it. Also, the save as svg function in Powerpoint works but is buggy- you need to dive into the XML after exporting and make some clean up edits, then verify everything with SVG Checker. If you export as PDF and then convert to SVG all the fonts are converted to shapes, which is no good for localization / accessibility / etc. Mostly mentioning all that in case you decide to SVG-ize the causes and effects chart. I'll tackle updating the temperature graph tomorrow, then continue working my way down.Efbrazil (talk) 23:28, 11 February 2020 (UTC)
- @Efbrazil: Regrets, I never graduated to SVG (somewhat intimidating to even set up the environment), much less XML editing. (html and C++ were as far as I got!) I plan to send you (Efbrazil) the basic elements I used to generate the composite graphs we've been discussing in this section—without textual labels since (as I understand it) you must use SVG to do labels properly. Sending you the basic elements should make it easier for you to generate more usable final products. —RCraig09 (talk) 06:36, 12 February 2020 (UTC)
- All true, I don't have a solution yet. Today I updated the first image to be SVG and include 2019 data (released on 1/15/2020) and to be super-high resolution. I checked and it looks good zoomed in or on smartphone. As an SVG the text can be selected and localized and zooms correctly. I expect programs like Google translate can also do stuff with it. Also, the save as svg function in Powerpoint works but is buggy- you need to dive into the XML after exporting and make some clean up edits, then verify everything with SVG Checker. If you export as PDF and then convert to SVG all the fonts are converted to shapes, which is no good for localization / accessibility / etc. Mostly mentioning all that in case you decide to SVG-ize the causes and effects chart. I'll tackle updating the temperature graph tomorrow, then continue working my way down.Efbrazil (talk) 23:28, 11 February 2020 (UTC)
- - I understand wanting to show attribution early on. If we want a graph, I think the best might be a Celsius version of the top graph in this article, because it's from a US government agency and shows uncertainty well, although it's low quality and an older data set so I'm not excited about it. It could be better to show a clear diagram of how CO2 / Methane create climate change, or perhaps a graph showing atmospheric CO2 / Methane / Temperature over time. There's a lot of those out there, but imho none of them are very clear at a glance. Efbrazil (talk) 20:03, 11 February 2020 (UTC)
I have the following observations & suggestions, to possibly influence any graphical work you are doing:
- A. The (static) heat map (presently at top) is eye-catching, but substantively seems suited to distinguish global differences in the "Regional trends" section, and the video already does that, arguably even more effectively than a static heat map. Is eliminating the static heat map an acceptable option? Or replacing it with the video?
- B. To emphasize how recent warming is ~unprecedented in recorded history: a composite of a 2,000-year graph and your File:Global Temperature Anomaly.svg, along the lines of a cleaned-up successor to my File:2,000- and 139-year global average temperature.png. Such compositing eliminates redundancy of ~140-year graphs.
- C. To emphasize causation (attribution): use the single-panel attribution chart File:2017 Global warming attribution - based on NCA4 Fig 3.3 - single-panel version.png. It includes a ~140-year chart, but doesn't take up additional space.
- D. To emphasize wide-ranging effects: keep the File:20200118 Global warming and climate change - vertical block diagram - causes effects feedback.png block diagram we've recently labored over.
Of course, individual images can be improved, SVG-ized, etc. —RCraig09 (talk) 20:38, 16 February 2020 (UTC)
- A. The existing graphic captures arctic heating and land heating very well and is in good shape and is being widely used on the Internets. It's more important than the graphs to visually capture planetary impact- remember "show, don't tell". The video is cute but really is overwhelming with the amount of info and doesn't zoom or render well in a range of outputs. The current graphic is current and high quality, I would definitely leave it as is, I'm disappointed you aren't a fan.
- B. Yeah, that makes sense once we have something better to replace it with that includes attribution, like you say in C.
- C. I'm reworking that chart but it's a laborious process. I agree it's a good overview chart and could replace the other chart when done to reduce redundancy and elevate causes.
- D. Yep- it stays as is. It would be nice if it was SVG and provided more clarity at a glance. --Efbrazil (talk) 19:48, 19 February 2020 (UTC)
Why does the 2000 year graph only go up to 0.6 degrees celcius?
@Femke: It looks like the 2000 year chart you made is normalized against a baseline of 1951-1980, so the squiggle at near zero degrees is the temperature flatline from 1950 to 1980. If so, the top of the measurement line should go up to nearly 1 degree celcius, but it maxes out at 0.6 degrees celcius. Is it out of date, or am I missing something? Efbrazil (talk) 22:50, 20 February 2020 (UTC)
- It is half a year out of date. As the proxies for the last 2000 years are not always yearly, the original paper used a moving average. For consistency, the current period is also produced with a moving average. Don't remember exactly how long it was, probably around 30 years. So the last point on the graph corresponds to the 1990-2019 average or smth, less than 1 degree warmer. I can easily change the baseline to be a bit earlier I think.. Femke Nijsse (talk) 21:35, 21 February 2020 (UTC)
- Maybe the 30 year moving average could be collapsed to 5 years for the observational data set? It would help with clarity for a non-technical audience if the peak was near +1.0 instead of +0.6. I think a more narrow moving average is intellectually honest- the older data is less precise, newer data is more precise, so naturally the recent "measured" values would be less blurred out. Thoughts? Efbrazil (talk) 23:12, 21 February 2020 (UTC)
Reworked second graphic, chart of temperature since 1880

I'd like to replace the second graphic in the article with what you see on the right. Tried to incorporate feedback from above as much as I could. I even labeled the Y-Axis "change", but clarified the baseline (pre-industrial). Content adapted from the existing second graphic. Efbrazil (talk) 20:23, 22 February 2020 (UTC)
- - Your new graphic definitely conserves space and is preferable (for me) over a bare-bones temperature graphic, since your new graphic places causality/attribution prominently, and a good introduction to the Effects block diagram immediately following. Breaking down causality as discussed above (natural and/or human-caused) can be done in a separate graphic and placed further down—very preferably compared to a Temperature trace as in File:2017 Global warming attribution - based on NCA4 Fig 3.3 - single-panel version.png.
- - On the substantive side: I've just adjusted the Temp trace downward in the apparently-soon-to-be-superseded File:2017 Global warming attribution - based on NCA4 Fig 3.3 - single-panel version.png to match a 1901-1960 baseline in the NCA4 Fig. 3.3 source. The difference in reference periods explains why your Temp trace is "higher".
- - On the presentation side: The graphic itself is layman-friendly, but the proposed caption can be simplified, for example: "Scientists have investigated many possible causes of global warming (black line), and have found that accumulation in the atmosphere of greenhouse gases, especially those resulting from humans burning fossil fuels, is the predominant cause (red line) rather than natural forces (green line)." I suggest that all sourcing and technical jargon can be placed inside the footnote itself so as not to make the public's eyes glaze over as they read. (Aside: placing the sourcing & jargon in a local footnote makes it more accessible than at Wikimedia Commons—though I think you should add sourcing there, in case the image becomes unused here down the road).
- - Thanks for all your work! —RCraig09 (talk) 22:01, 22 February 2020 (UTC)
- Thanks Craig! The graphic is now live. Your point on the description is a good one, I mostly adopted your text. I did leave references inline though, for a couple reasons- people that doubt what is being said can get directly to the source, and it helps to lock down the content against lazy edits, since lazy people don't want to mess with references. Efbrazil (talk) 19:33, 23 February 2020 (UTC)
- Sorry I'm not paying as much attention as I should with the review (and life) ongoing. A few comments about the graph and caption.
- We're not allowed to have things like "scientists say" in prose per WP:WEASEL
- You probably know that external links are a no-go in the body of an article, so this point is probs moot. But if you didn't know, could you conform to the standards of this article?
- I think 'And forces' should be deleted from the title. What you're showing is the temperature, and the temperature components, both with units degrees. Forcing is something else: in climate it usually means the energy imbalance at the top of the atmosphere measured in W/m2.
- The squares at the individual years for the black line are distracting. Could you delete it?
- To me, the font seems a bit off, or just a bit too busy. Maybe the frequency of tick labels can go down? Femke Nijsse (talk) 19:45, 23 February 2020 (UTC)
- Good feedback, will tackle all that now. Efbrazil (talk) 21:05, 23 February 2020 (UTC)
- (1) done (2) done (3) Forces cut from title, forces changed to "drivers" in the key. Drivers is consistent with the source material as well. (4) done (5) Fixing the font is hard. I don't want to convert the font to images like you did Temperature_reconstruction_last_two_millennia because it blocks localization. It might look better if I recalculate all the points and sizes in the image so that the native scale approximates the thumbnail, but that's a ton of work. You know of a better fix? Maybe I'll fuss with all that later. I'd rather not change tick labels because they make sense (.1 degree, once per decade), but if craig has issues I can tweak them.Efbrazil (talk) 21:43, 23 February 2020 (UTC)
- The image is a straightforward demonstration of a critical concept. "Change from pre-industrial era" is a brilliant solution to the simple-versus-scientifically-correct issue. No changes are "needed" though I mention the following in case others deem them worth (re)considering: • legends close to respective traces • less granularity on vertical axis • a few light horizontal grid lines would be OK as I didn't argue for their deletion • light gray "frame" to aesthetically emphasize graphical area of interest. Happily, my Chrome for Mac does not render any areas black as it (perplexingly) does enlarging some other SVGs. In short, this chart is "ready for primetime!" —RCraig09 (talk) 06:32, 24 February 2020 (UTC)
- Thanks, and much thanks for your help on this! To get a white background I just put a solid white rectangle in the background before exporting- SVG with transparency is shown on black in Windows Chrome too. The horizontal / vertical grid line issue I really don't have a preference on, so I'm just going to leave it unless someone else chimes in advocating for a grid line comeback. The legend is as good as I could make it given the shape of the graph. Efbrazil (talk) 19:19, 24 February 2020 (UTC)
- (A very belated response, trying to do too many things off and on wiki)
- 5a. So about those fonts, I'm not entirely sure what the options are. Is there only one font you can choose from if you have adjustable fonts?
- 5b. In terms of tick labels: I think doing one every 25 years instead of 20 would be immensely helpful. Now the distance between 1880 and 1900 is about as big as a space, which doesn't work for me. Alternatively, you can make the fonts for everything but the title a bit smaller. The temperature tick labels could be similarly spaced: 0.25, but that would require more significant digits.
- 6. To get rid of more distracting details, you could consider removing the upper and right spine, making all the spines (dark) gray.
- 7. To gauge the natural factors, a light gray line at zero temperature may be helpful.
- 8. The line thickness for the actual information could be a bit higher. Femke Nijsse (talk) 20:24, 5 March 2020 (UTC)
- Thanks, and much thanks for your help on this! To get a white background I just put a solid white rectangle in the background before exporting- SVG with transparency is shown on black in Windows Chrome too. The horizontal / vertical grid line issue I really don't have a preference on, so I'm just going to leave it unless someone else chimes in advocating for a grid line comeback. The legend is as good as I could make it given the shape of the graph. Efbrazil (talk) 19:19, 24 February 2020 (UTC)
- The image is a straightforward demonstration of a critical concept. "Change from pre-industrial era" is a brilliant solution to the simple-versus-scientifically-correct issue. No changes are "needed" though I mention the following in case others deem them worth (re)considering: • legends close to respective traces • less granularity on vertical axis • a few light horizontal grid lines would be OK as I didn't argue for their deletion • light gray "frame" to aesthetically emphasize graphical area of interest. Happily, my Chrome for Mac does not render any areas black as it (perplexingly) does enlarging some other SVGs. In short, this chart is "ready for primetime!" —RCraig09 (talk) 06:32, 24 February 2020 (UTC)
- Sorry I'm not paying as much attention as I should with the review (and life) ongoing. A few comments about the graph and caption.
- Thanks Craig! The graphic is now live. Your point on the description is a good one, I mostly adopted your text. I did leave references inline though, for a couple reasons- people that doubt what is being said can get directly to the source, and it helps to lock down the content against lazy edits, since lazy people don't want to mess with references. Efbrazil (talk) 19:33, 23 February 2020 (UTC)
5a. It's tough, wikipedia has extremely limited font support for svg files. I'm trying to follow advice from a wikipedia SVG help request I made.
5b. I shrunk the font size on the axis labels so the gaps are better and so it matches the other graphics as I've been working my way through. I think it's better now. I don't want to change scale- what's there now works with tick marks being on decades, matches the data set (which starts at 1880), and also matches up with the temperature scaling.
6. The border helps with getting your bearings since there's no grid lines anymore. Color could be tweaked to match other graphs- I need to bring them all into better alignment still. It's hard because some are things I rebuilt from the ground up while others are tweaks to existing SVG files, like this one, and they have stuff like different native sizing on the svg viewbox.
7. It's already really busy around the 0 temperature mark, hopefully the border helps with bearings?
8. I'm not sure I see this problem- the trace lines seem very visible to me and the thicknesses are comparable to what you have in your graphic on "CO2 concentrations over the last 800,000 years" Efbrazil (talk) 22:26, 5 March 2020 (UTC)
- 5/6 Okay :).
- 7. Not realy. The right border doesn't have ticks on it, so I don't feel it helps at all. I think it's important to know what natural drivers do in the last 20 years. Have they been positive or negative? That's difficult to see now. A small grey line in the background wouldn't make it much busier.
- 8. I'm not sure I've put my finger on the problem yet. If I compare this graph with the other graph about attribution, I think those lines are clearer. There are three differences: thickness (tiny bit thinner these), transparancy: they seem to have a 80% transparancy and colour: the previous graph uses less primary colours. Maybe all three need changing for a more professional vibe? Femke Nijsse (talk) 18:56, 6 March 2020 (UTC)
Lots of minor tweaks done to chart:
- Added tick marks to right hand side of graph, changed line weights to match other graphs
- Fixed a bug where the svg converter was ignoring styles on fonts, so font colors in the key now match the lines on the graph
- Trace lines a tiny bit bolder now
- All data ranges re-verified, found that natural influence was offset a bit high, graph range extended down to capture full natural range
- Fixed localization of one numberEfbrazil (talk) 20:01, 7 March 2020 (UTC)
Replacing the 2000 year view in the "Observed Temperature Rise" section

My initial attempt at higher quality for capturing the 2000 year view is on the right. It's an updated version of the 2000 year view femke came up with that features recent warming the way craig wanted. The Y axis is baselined to 1850-2000 temperature averages since that's what the IPCC uses. It includes the 5 year moving average of data from NASA for 1880 - 2019, replacing the 30 year average femke was using.
Also, the other 3 graphs in that section go away I think- the attribution graph content is now covered in the intro area and the land / sea temperature graph we can live without. I could upgrade the land / sea graph if people like the content- it does capture how land is heating much faster than the ocean, pointing to how the ocean is absorbing a lot of the increased temperature. I guess we keep the video of change. Thoughts? Efbrazil (talk) 23:56, 23 February 2020 (UTC)
- - For ideas re the 2000-year chart, see this recent Ed Hawkins chart (which is licensed under Creative Commons).
- - In your chart, "Proxy" (jargon) can be replaced with "Indirect" to balance the "Direct measurement..." legend. The main caption can be "Global average temperature
in the Common Era" since the data axis is clear. I'd leave off the "–2019" so the graph doesn't advertise it's outdated next year. I'm thinking the two Confidence legends can be made super-tiny and at the bottom of the image, so casual readers aren't distracted/confused. - - I think it's important to have two charts in the Physical drivers section: (1) one with human causes graphed with Global temp, alongside (2) another image showing natural causes graphed with Global temp. I think it's too messy to combine them into one. (The second one is like this image but without the 'Human forces' trace.)
- - In Regional trends, in addition to the video, I think there is value in showing (A) land-versus-sea as in the article now, and (B) Northern versus Southern Hemispheres (data is a this file description page).
- - My foray into SVGs has been frustrating (here), so I hesitate to volunteer for anything that would have result in an SVG. Text renders differently on file page, enlarging Commons file page image, in en.wp, enlarging en.wp image, etc. . . . I could shoulder the work for PNGs, no problem.
- - Probably too late, but I've cleaned up the pixellated arrows in my old charts. —RCraig09 (talk) 07:03, 24 February 2020 (UTC)
- Looks good. I'm really impressed by what you can do with those images! I agree with RCraig09's suggestion to further improve, except I wouldn't even put the confidence intervals in there at all per Ed Hawkins chart (and because super-small things are just not that clear in my opinion). This information can be on the Commons background page. I don't mind having the 2019 in there, as that will motivate us to update the graph. Femke Nijsse (talk) 18:39, 24 February 2020 (UTC)
- Thanks all for your support! Addressing Craig's list in order:
- - Good find! I overlaid the femke / composite graph on top of that one and the data matches, which is nice affirmation. I think I'll stick with current data since it has smoothing and is native SVG and I don't see much value in switching. The added labels and section description just clutter things I think.
- - Proxy --> Indirect done, good change! The title of the top graph is already "Global surface temperature" so I want to leave in the time frame for this graph since that's the critical feature that distinguishes this chart. I removed the "2019" like you suggest (as femke unsuggested), mostly because I don't know that it added much value other than forcing the chart out of date in a couple years. I shrunk the font on the confidence indicators, but I don't see harm in leaving them in- it's clearly a subtitle under the main text, so it can be easily ignored when not zoomed.
- - Yeah, I'll tackle physical drivers soon and see what I come up with- there's room for improvement there.
- - I'll look at what I can do with showing regional info outside of a map view. I think map view is maybe the most informative though- it has everything there at once.
- - SVGs have a learning curve for sure. I've struggled a lot with fonts- ideally the thumbnail fonts look the same as the article fonts, and I haven't figured out how to pull that off yet.
- I'll look to make these tweaks live now. Probably other changes need to wait until tomorrow. Thanks for your support! Efbrazil (talk) 20:51, 24 February 2020 (UTC)
Switching image used in the top line graphic
Femke changed the top line graphic yesterday, I reverted it back. The inserted graphic was of low quality and not consistent with the work I've been doing to clean up the fonts and graphics throughout the article, including conversion to svg. It had inconsistent fonts, wasn't localizable, didn't zoom well. Femke- if you want to switch the graphic, please make the case here. I can incorporate the new graphic source and update the SVG if there's agreement on the switch. Efbrazil (talk) 18:19, 27 February 2020 (UTC)
- Sorry for the bold move.
- The old image suffered from a couple of defects that can probably not be remedied easily: it showed mountains and other distracting features and it was too dark. Furthermore, it contained a 5-year average over 2015-2019, giving the impression that warming is not a global phenomenon, but has quite a few areas that didn't cooled instead. The ongoing peer review also noted that ENSO might not be averaged out completely with such a short average. The website I used: https://data.giss.nasa.gov/gistemp/maps/index_v4.html, also allows saving the image in pdf (which should be convertible to svg?) and PostScript (no idea how that works). Would you be willing to work from that image? Or tell me more specificly what you want me to do? Femke Nijsse (talk) 18:27, 27 February 2020 (UTC)
- Thanks for understanding Femke, reverting stuff is not something I like to do. Sure, I'll make the update, I agree the new image source is better- I was using downloads from the video image source. If you have any other graphics asks please let me know in this section. I'm going slow but my plan is to work my way through all of the images.
- Regarding time period, I'd like to stay after 1950 since that's what NASA does by default and going earlier misses temperature in areas of the globe, particularly the poles. I'd also like to have a 50 year time differential since that's a crisp number. If you want a 10 year minimum, we could do 1951 to 1978 vs 2010 to 2019, meaning an average of 1964.5 to 2014.5. Thoughts? Efbrazil (talk) 19:09, 27 February 2020 (UTC)
- Though EF's graphic has more color gradations, I agree that mountain ranges are very distracting. More importantly, I appreciate Femke's substantive comments and suggestions, and give substantial weight to her demonstrated judgment and subject matter expertise. If moving the NASA video to the lede is off the table, I suggest the compromise of the two still-picture maps along lines described above by Femke. Afterwards, it seems like adding some SVG-localizable legends to a thus-improved map would be a relatively small additional step. Sorry, I'd offer to do more of the work, but I'm still in the I-have-SVG-font-display-problems stage. —RCraig09 (talk) 07:32, 28 February 2020 (UTC)
- Thanks Craig / Femke, change to the lead graphic made to use the new source image. I removed the stupid "+" over the globe (who thought that was a good idea?), shortened the temperature scale to only show what is on the map, and I changed the vertical height to match the prior image scale as that's more typical. I also updated the caption with the new dates. Let me know if you want anything further done. Efbrazil (talk) 20:31, 28 February 2020 (UTC)
- You used the January temperatures! Furthermore, I think the units should be displayed in the standard format of °C instead of Celsius:. I'm okay with removing some of the unused colours, but would like the colour bar to be centered. Femke Nijsse (talk) 20:47, 28 February 2020 (UTC)
- Thanks Craig / Femke, change to the lead graphic made to use the new source image. I removed the stupid "+" over the globe (who thought that was a good idea?), shortened the temperature scale to only show what is on the map, and I changed the vertical height to match the prior image scale as that's more typical. I also updated the caption with the new dates. Let me know if you want anything further done. Efbrazil (talk) 20:31, 28 February 2020 (UTC)
- Though EF's graphic has more color gradations, I agree that mountain ranges are very distracting. More importantly, I appreciate Femke's substantive comments and suggestions, and give substantial weight to her demonstrated judgment and subject matter expertise. If moving the NASA video to the lede is off the table, I suggest the compromise of the two still-picture maps along lines described above by Femke. Afterwards, it seems like adding some SVG-localizable legends to a thus-improved map would be a relatively small additional step. Sorry, I'd offer to do more of the work, but I'm still in the I-have-SVG-font-display-problems stage. —RCraig09 (talk) 07:32, 28 February 2020 (UTC)
New temperature chart
This chart has been floating around in various forms for a while, it does a good job of illustrating the association between CO2, temperature, and sea level. Here's an older version for instance. The changes I made were to get current data, convert to SVG, and clarify recent changes relative to pre-industrial baselines. I also changed the time scale to 500K years instead of 400K or 800K, as I think that's easiest for people to wrap their heads around. All data was rerendered from the ground up, so changes are easy for me to make.
I'm a little conflicted about the graphic, so I'd like reaction here. On the good side, it's useful for highlighting recent climate change relative to glacial time periods to highlight the potentials for the climate system. On the down side, it's arguably too long a time frame for us to be featuring in this article and it takes some explaining, which I tried to do in the description but that maybe it's more confusing than clarifying. Thoughts? Efbrazil (talk) 22:52, 27 February 2020 (UTC)
- It's a well-balanced, clean, and visually attractive graph showing successive correlations: CO2-->Temp-->SLR.
- a. My first thought is where to place such a graph, since the first "-->" has to do with causation/attribution and the second "-->" has to do with effects. I think it's too detailed and complex for the lede, which is well-populated with images now.
- b. Considering the caption: it seems the temperature variation is actually ~15˚C, and SLR is actually ~150m — unless you mean something different for "between glacial and interglacial periods".
- c. The "1870 to today" looks like an alternative title to the entire graph. To clarify things, I would combine that legend with the ""+47% ... legend, and add a little line from that combined legend to the red part of the trace, surrounding that red part of the trace with an oval as in Femke's File:Carbon Dioxide 800kyr-nl.svg. Similarly, an arrow pointing from red legends toward the changed portions of the traces would make it clearer (it took me a long time to figure out that the four red legends correspond).
- d. I'm not sure how 500Kyr is easier to grasp than 800Kyr, so I'd prefer the larger number for greater impact, but it's not a big issue.
- e. In the caption, I think that "are associated with" and "are beginning to be reflected" don't state the case strongly enough. I think you can be more definitive about causation.
- f. Sourcing may be an issue, and you must consider WP:SYNTHESIS. Include the entirety of sourcing in footnotes, not in the caption where it would befuddle non-sci/techy readers. —RCraig09 (talk) 07:18, 28 February 2020 (UTC)
- g. Some of the sourcing may be accomplished with the Wikimedia Commons file description page, but I also think that putting basic sourcing in the image itself in purposely very tiny lettering—text that casual viewers wouldn't even notice—could remove some of the burden of sourcing in the article's textual caption. Such in-image sourcing has the additional benefit of crediting the sources when others use the image both inside and outside Wikipedia. —RCraig09 (talk) 07:43, 28 February 2020 (UTC)
- Here's a good article on the association- it's not as simple as CO2 causes the temperature changes between glacial periods unfortunately. There's a correlation, but the causal link is weak. At the very least, it looks to me like it's false to say that 100 ppm of carbon ultimately will result in a 10 or 15 degrees celcius temperature change. So I think I'll let that chart die, unless you have a more clear headed idea for it than I did when I made the chart. Efbrazil (talk) 22:23, 28 February 2020 (UTC)
- I can see the problem with publishing a chart that encourages readers to make inferences that scientists know aren't so clear cut, but at the same time a good caption can fairly explain the level of significance the correlation does have. I don't think strict or unique causality is needed for the three traces to be meaningfully juxtaposed—just careful wording in the caption for its interpretation. Aside: I hate to see hard work go to waste! —RCraig09 (talk) 22:55, 28 February 2020 (UTC)
- Much thanks for the kind thoughts here, it was a lot of work! At least I learned something along the way. Putting aside causality, the chart does usefully highlight the range of the climate system. It's chock full of interesting data for sure! Still, if the graph was honest it would begin with sun exposure, as that seems to have been the primary driver for glacial periods, with carbon dioxide more of a feedback mechanism that followed temperature changes. So then you're looking at a 4 stack chart with CO2 third, and that has nothing to do with modern climate change. Efbrazil (talk) 23:43, 28 February 2020 (UTC)
- I nominated the file for deletion. If you see another way to organize it then let me know. I'll tackle the air / sea temperature chart next week. Efbrazil (talk) 23:52, 28 February 2020 (UTC)
- I think it's best to start with a goal or purpose or problem in an article, and then make a graphic to fit it or solve it. If one starts with a graphic, one can have a graphic in search of an article! I'm not sure this graphic should be deleted, even if it isn't used now. (P.S. When I open this SVG file in my Inkscape, the text objects are placed differently, sometimes overlapping even though everything's alright on WP & Wikimedia... it's still a mystery to me.) —RCraig09 (talk) 04:10, 29 February 2020 (UTC)
- Oh, I had great goals and purpose- to show how carbon has spiked unnaturally in current times and to show how temperature and sea level have historically followed carbon concentration and to show the range of temperature and sea level in prehistorical times. All noble goals and all reflected in the data. The problem is in implying that carbon is the driver for glacial cycles- it's correlated, but that seems to be as far as I can honestly go with it. Efbrazil (talk) 00:56, 2 March 2020 (UTC)
- I think it's best to start with a goal or purpose or problem in an article, and then make a graphic to fit it or solve it. If one starts with a graphic, one can have a graphic in search of an article! I'm not sure this graphic should be deleted, even if it isn't used now. (P.S. When I open this SVG file in my Inkscape, the text objects are placed differently, sometimes overlapping even though everything's alright on WP & Wikimedia... it's still a mystery to me.) —RCraig09 (talk) 04:10, 29 February 2020 (UTC)
- I nominated the file for deletion. If you see another way to organize it then let me know. I'll tackle the air / sea temperature chart next week. Efbrazil (talk) 23:52, 28 February 2020 (UTC)
- Much thanks for the kind thoughts here, it was a lot of work! At least I learned something along the way. Putting aside causality, the chart does usefully highlight the range of the climate system. It's chock full of interesting data for sure! Still, if the graph was honest it would begin with sun exposure, as that seems to have been the primary driver for glacial periods, with carbon dioxide more of a feedback mechanism that followed temperature changes. So then you're looking at a 4 stack chart with CO2 third, and that has nothing to do with modern climate change. Efbrazil (talk) 23:43, 28 February 2020 (UTC)
- I can see the problem with publishing a chart that encourages readers to make inferences that scientists know aren't so clear cut, but at the same time a good caption can fairly explain the level of significance the correlation does have. I don't think strict or unique causality is needed for the three traces to be meaningfully juxtaposed—just careful wording in the caption for its interpretation. Aside: I hate to see hard work go to waste! —RCraig09 (talk) 22:55, 28 February 2020 (UTC)
- Here's a good article on the association- it's not as simple as CO2 causes the temperature changes between glacial periods unfortunately. There's a correlation, but the causal link is weak. At the very least, it looks to me like it's false to say that 100 ppm of carbon ultimately will result in a 10 or 15 degrees celcius temperature change. So I think I'll let that chart die, unless you have a more clear headed idea for it than I did when I made the chart. Efbrazil (talk) 22:23, 28 February 2020 (UTC)
Three-latitude-band SVG chart
_GISS.svg)
- Especially to @Efbrazil and @Femkemilene: do you see an advantage using this chart in 'Regional trends'?
- Especially to @Efbrazil: Your explanation at SVG Help is much appreciated, but involved XML editing and was a bit over my head. FYI: Version 1 had terrible text rendering in thumbnails so I converted the text to 'paths' (vectors) for Version 2, and preserved the native text objects in a hidden layer for others to localize. The addition of the path/vector layer almost quadrupled file size (57K --> 214K); however, being a bit old-fashioned I'm of the opinion that computers should work for us, and not vice-versa! Comments welcomed. —RCraig09 (talk) 03:41, 15 March 2020 (UTC)
- P.S. The kinky multi-parallel-line graph traces are chosen for people who are color-blind. Microsoft Excel does not have too many options in that department. —RCraig09 (talk) 03:52, 15 March 2020 (UTC)
- The path solution is covered in the bug description I filed. Having hidden text I don't think helps with localization. For localization to work the svg should "automatically" localize when pumped through a translation engine, then be touched up by a human being. Svg with text is best for smartphone and localization, and bad for the desktop thumbnail view. I don't see how to improve desktop view without losing one of the other advantages. Efbrazil (talk) 20:29, 16 March 2020 (UTC)
- Thanks for writing the bug report and for this explanation. It looks like any true multi-platform solution/workaround would require a bit of work for the localizer person, regardless. If the original (hidden) text objects are automatically or manually translated, the human would have to delete the old pathtext,(I put it in a separate layer) duplicate the translated text, and convert the duplicated translated text objects into visible paths. It doesn't seem to be an egregious amount of work especially if there is minimal text—numerals are easy to translate ;- . —RCraig09 (talk) 21:07, 16 March 2020 (UTC)
- I like the graph, and wouldn't mind if it replaced the video that is currently used. There is no place for an additional graph, and I don't think regional warming patterns are important enough for two graphs. I'd use "T" as abbreviation for tropics, to be consistent. You can cut off the graph at -0.8 degree to amplify diffferences and make the asymmetry between warming and cooling starker. Femke Nijsse (talk) 16:17, 21 March 2020 (UTC)
- The gallery has a big disanvantage of showing loads of white space at higher resolutions. Since there is overlapping information between this graph and the video, there is little priority to put both in. I think the strong decline in aesthetics and the summary style (if that's a thing for figures) are good reasons to choose either this figure, or the video. Femke Nijsse (talk) 08:52, 22 March 2020 (UTC)
- I've eliminated the NASA video since it resembles the blue-red map at the top of the article. I've right-justified the remaining two graphs.
- Especially considering this article's ~4.7 million annual views, I strongly urge that our presentation be readily understandable to "butchers, bakers, candlestick makers". Sourcing and techy details can be in footnotes or in tiny print in the images, as well as on the Wikimedia file page, for the small fraction of readers who will scour the article as if its authors were defending a dissertation. —RCraig09 (talk) 18:32, 22 March 2020 (UTC)
- Please bring the chart more in alignment with the other charts. 1. Normalize the temperature to the 1850 to 1900 average as per what the IPCC uses. 2. Remove grid lines, add ticks to right hand axis 3. Use standard text that can be localized instead of vector text. If you want to just send me the data I can generate it all pretty easily- I've got a system now. Efbrazil (talk) 21:43, 22 March 2020 (UTC)
- Graphic updated, but I'd like to get the video back, so I'll look to rearrange for that. The video had no text so no localization problems, and for some people seeing the video will be more compelling than just a static graph. Having said that, I don't see the graph as being a bad thing.
- Also, stacked graphics are really not a good thing- you can't follow recommended sizing based on thumbnail scaling. That means that stacked graphics will not scale correctly based on screen resolution- they're stuck as a certain pixel resolution. So next I'll unstack the graphs and get the map animation back in to a different location where there is room. Efbrazil (talk) 18:44, 23 March 2020 (UTC)
- Please bring the chart more in alignment with the other charts. 1. Normalize the temperature to the 1850 to 1900 average as per what the IPCC uses. 2. Remove grid lines, add ticks to right hand axis 3. Use standard text that can be localized instead of vector text. If you want to just send me the data I can generate it all pretty easily- I've got a system now. Efbrazil (talk) 21:43, 22 March 2020 (UTC)
- The gallery has a big disanvantage of showing loads of white space at higher resolutions. Since there is overlapping information between this graph and the video, there is little priority to put both in. I think the strong decline in aesthetics and the summary style (if that's a thing for figures) are good reasons to choose either this figure, or the video. Femke Nijsse (talk) 08:52, 22 March 2020 (UTC)
- I like the graph, and wouldn't mind if it replaced the video that is currently used. There is no place for an additional graph, and I don't think regional warming patterns are important enough for two graphs. I'd use "T" as abbreviation for tropics, to be consistent. You can cut off the graph at -0.8 degree to amplify diffferences and make the asymmetry between warming and cooling starker. Femke Nijsse (talk) 16:17, 21 March 2020 (UTC)
- Thanks for writing the bug report and for this explanation. It looks like any true multi-platform solution/workaround would require a bit of work for the localizer person, regardless. If the original (hidden) text objects are automatically or manually translated, the human would have to delete the old pathtext,(I put it in a separate layer) duplicate the translated text, and convert the duplicated translated text objects into visible paths. It doesn't seem to be an egregious amount of work especially if there is minimal text—numerals are easy to translate ;- . —RCraig09 (talk) 21:07, 16 March 2020 (UTC)
- The path solution is covered in the bug description I filed. Having hidden text I don't think helps with localization. For localization to work the svg should "automatically" localize when pumped through a translation engine, then be touched up by a human being. Svg with text is best for smartphone and localization, and bad for the desktop thumbnail view. I don't see how to improve desktop view without losing one of the other advantages. Efbrazil (talk) 20:29, 16 March 2020 (UTC)
"Perspective" video: recent GW in 2000-year context
- Video is made as a general response to User:Femkemilene's 22 Feb 2020 suggestion here.
- Video includes simplification of User:Efbrazil's chart, File:Common Era Temperature.svg, which was derived from an earlier User:Femkemilene chart, File:Temperature reconstruction last two millennia.svg.
I tried to make the video thumbnail be the same as the 2000=year chart so that the video thumbnail would look ~the same in this article as the current chart, and allow much of the ~same caption to be used. I thought that putting the 2000-year chart as the first frame would accomplish this goal, but it did not—the 1880- chart shows instead! If you know how to control the thumbnail in a video, please let me know!- I set thumbnail to first frame with
thumbtime=0. - My intent is to substitute this video for the present still picture
after the thumbnail issue is resolved. Comments welcome. —19:29, 20 March 2020 (UTC) revised with strikeout RCraig09 (talk) 21:46, 20 March 2020 (UTC)- I personally prefer the existing static picture to the video. Videos are generally less usable and visible (e.g. in Internet searches, for reuse in Websites / presentations, for localization, etc), and I also don't see this particular video as being superior to the static graphic. --Efbrazil (talk) 00:49, 22 March 2020 (UTC)
- It's true about automatic localization, though I purposely minimized non-numeric text. I'm not sure why a video would be less usable outside WP: the Wikimedia file page has the standard "Use this file" button at the top, as well as a pic of and link to the still image. My goal was to add to the Wikipedia article(s) rather than promote a file per se.
- Substantively, you may remember from early-February comments above, re how File:800,000-, 2,000-, 139-year global average temperature.png emphasized how abnormal the present GW is... eventually Femke suggested10:14, 22 Feb a gif and I think this video expresses the unusual nature of current GW best—show, don't tell. Also, maybe there's a sub-article where the video would also be appropriate (Temperature record of the past 1000 years?). Maybe User:Femkemilene still has an interest in commenting? —RCraig09 (talk) 03:59, 22 March 2020 (UTC)
- I agree with Efbrazil that I prefer the static picture to the video.
- -> A video is more distracting than a static picture, with an arrow shouting press me please. When you press it, it pops up in the middle of the screen. A gif doesn't have these problems, as it automatically plays in its correct location.
- -> Both a video and a gif are more distracting than something static. This means that the execution much be close to perfection. In this case, that would mean having the frame, the title completely static, while only zooming in. Now, two frames merge into each other. Femke Nijsse (talk) 12:30, 22 March 2020 (UTC)
- I dislike Wikipedia's way of ~blanking the video window after the video completes, but I do think videos are valuable and warrant the 'distraction'. I think videos are and should be more engaging, and preferably, cool while instructive. Granted, my first video is not aesthetically perfect, though I purposely wanted the 2000-year graph to aggressively "squeeze" the 140-year graph in order to show modern GW in context and perspective. But it looks like even an aesthetically perfect video won't meet consensus here, so I doubt I'll pursue it further, at least in this venue. I appreciate different points of view, though. Thanks to both for taking the time to express your reasoning. —RCraig09 (talk) 18:44, 22 March 2020 (UTC)
- Back to the drawing board! —RCraig09 (talk) 18:45, 22 March 2020 (UTC)
- I personally prefer the existing static picture to the video. Videos are generally less usable and visible (e.g. in Internet searches, for reuse in Websites / presentations, for localization, etc), and I also don't see this particular video as being superior to the static graphic. --Efbrazil (talk) 00:49, 22 March 2020 (UTC)
@Efbrazil: @Femkemilene: and others:
I've found that Gimp can produce high frame-rate GIFs, making for smooth animation. Though you were against the March 20 video, would you be in favor of a "perfect" GIF (one that adopts your suggestions above to the extent possible)? Or would the motion be too distracting? Let me know either way, as I won't invest the time unless it will be used. —RCraig09 (talk) 00:54, 5 April 2020 (UTC)
- That is good to know about GIMP. I wouldn't object to it, but I think the current situation is quite good, so maybe invest the time elsewhere? There are sooo many climate change articles with outdated and poor graphics. Hope that I'm not reducing your enthousiasm :(. Femke Nijsse (talk) 15:10, 5 April 2020 (UTC)
new research on heat and humidity too severe for human tolerance spreading, add?
- Jonathan Lambert, Deadly temperatures expected to arrive later this century are already here; Global weather station data show dangerously hot and humid days are becoming much more common 8 May 2020 Science News
- "The emergence of heat and humidity too severe for human tolerance". Science Advances. 6 (19). 8 May 2020. doi:10.1126/sciadv.aaw1838. Retrieved 9 May 2020.
{{cite journal}}: Cite uses deprecated parameter|authors=(help) - https://www.washingtonpost.com/weather/2020/05/08/hot-humid-extremes-unsurvivable-global-warming
- https://www.theguardian.com/environment/2020/may/08/climate-change-global-heating-extreme-heat-humidity
- https://www.usnews.com/news/health-news/articles/2020-05-08/planet-already-seeing-temperatures-beyond-human-tolerability
- https://www.cnn.com/2020/05/08/weather/killer-heat-climate-change-study/index.html
- Tim McDonnell Potentially lethal heat waves are more common than scientists thought May 8, 2020 Qz.com
- Jan Wesner Childs Unsurvivable Heat Was Predicted to Blast Earth in the Future. Instead, It's Happening Now. 7 May 2020 Weather.com
X1\ (talk) 22:11, 9 May 2020 (UTC)
Featured picture candidate for lead image
I submitted the lead picture as a featured picture candidate here, upvotes appreciated: Wikipedia:Featured picture candidates#Change in average temperature over the last 50 years — Preceding unsigned comment added by Efbrazil (talk • contribs) 17:38, 13 May 2020 (UTC)
- A shame it didn't make it. Hope we can get some other picture featured. Picture has improved further though, thanks! Femke Nijsse (talk) 12:45, 23 May 2020 (UTC)
Adding effects to the summary at the beginning of the article
| Some effects of climate change |
|


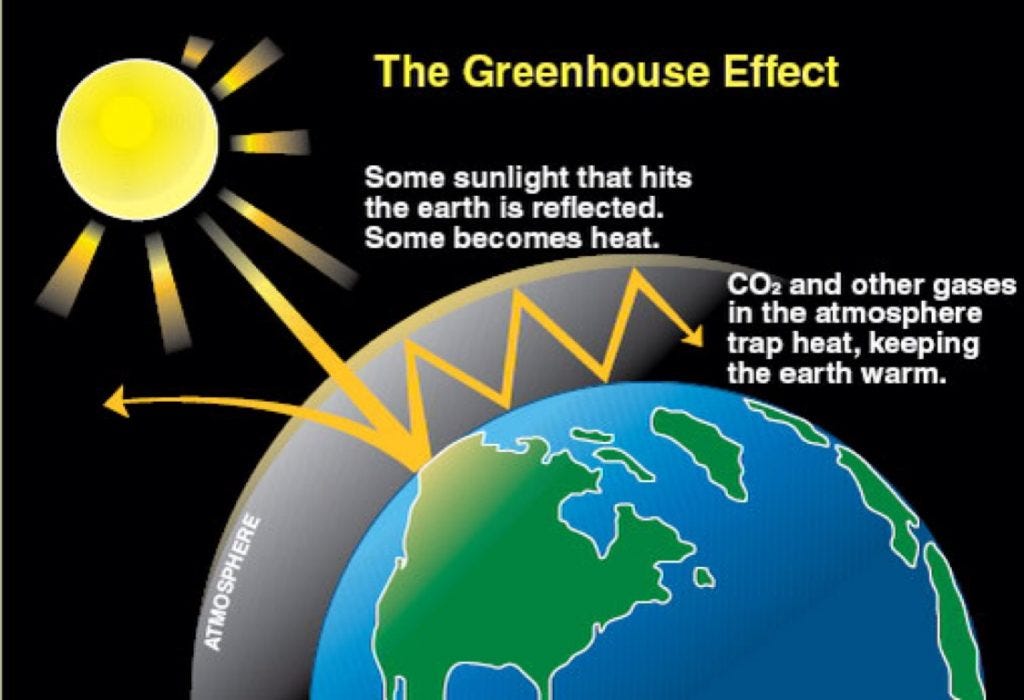
.png)
Craig and I would like to get effects visible earlier in the article, to try and present why the subject should matter to people. One option is shown here on the right hand side, which is transcluding the effects galleries into a sidebar gallery that we could put in the introduction. I currently have it showing the images in randomized order.
The gallery would fit beneath the temperature chart on the right hand side in desktop mode. In mobile view, the first 4 images of the slideshow would be shown immediately after the effects paragraph. The gallery would not replace the expanded effects galleries down below in the artile, it is simply putting the content of that gallery earlier in the article. As part of this change the greenhouse effect graphic would move down to physical drivers.
While sizing isn't perfect, it's pretty good, and one good thing is that the markup is simple even though it took a lot of trial and error to figure it out. Edit this page to review it.
Thoughts on making this change? Efbrazil (talk) 19:16, 6 May 2020 (UTC)
- Great work EfBrazil and RCraig09! This is a wonderful graphic, and it will be a nice touch to have an interactive feel at the start of the article. Just as a note, with the iPad I have that runs iOS 12 (mobile Safari browser), I can’t see the graphic at all in this post, even though I can see other right hand side graphics that are on this talk page. But in the iPad that now runs iOS 13, which Apple seems to have set up to run the full (desktop) Safari browser and not the mobile version, the graphic shows up fine. I’m guessing you both have tested this aspect, but thought I would let you know how it’s looking to me.Dtetta (talk) 02:40, 7 May 2020 (UTC)
- • All kudos go to Efbrazil for the final idea and this implementation of a slideshow, which I think is preferable over my 21 April idea of a GIF. An extended dialectic has yielded an excellent result! Wikipedia makes inadequate use of multimedia, methinks, and this idea may, and should, spark new standards on the website, especially if the article becomes Featured.
- • My iOS 13.4.1 / Safari browser shows and executes the slideshow fine in "desktop view" but it is invisible in "Mobile view"—same results for two iPads born in 2011 and 2016. Desktop: my old OSX 10.11.6 / Chrome 81.0 displays and executes it fine.
- • Enlarging to
width=25emmakes the images more visible, with the same outside frame width as the existingupright=1.35images at the top of the article. It also reduces the wasted space in the 'frame' of the slideshow. - • A downside is that the citations do not seem to appear to have survived the transclusion. —RCraig09 (talk) 03:51, 7 May 2020 (UTC)
- Thanks for the encouragement!
- It's a shame that citations are lost. I imagine that's intentional since content can be transcluded from other pages, so reused references may not be defined on the current page.
- For platforms, I'm trusting how wikipedia chooses to handle transclusion galleries, and it looks like they are hidden on mobile. I think it is OK for it to be hidden since the content is still on the page, just further down. It is a shame that this will be a desktop-only experience, but it would be hard to get right on mobile anyhow- should the user see all 10 images at once, before the rest of the article, and then see them a second time down in the effects section? The odd thing is that the code says that the transclusion is supposed to show the first 4 images on mobile, but it doesn't, so maybe that's a bug somewhere.
- Thanks for checking ipad, it's good it works on iOS13. iOS12 ipad is niche and fading so I'm not worried about that.
- For the width, changing to 25em does bring it out of alignment with upright=1.35 images, for me at least. Craig- please double check that on your side- the width definition I'm using above is for the frame, so changing it takes it out of alignment with thumbnails. The way to zoom the contained image content without altering the frame width is by altering the left and right margins. Currently I have them set at -5, which I thought looked best. You can zoom content more by bumping left and right margins to something like -10 (zooming the content without impacting frame width), but then the image captions start to touch and overflow the frame border.
- Keeping the caption narrower while the image zooms is difficult because the template doesn't provide customization mechanisms, not even the ability to use custom classes on the template. That means a fix requires doing something hard core, like making a universal change to the code for this widely used template or creating a new template version. Given that we're only talking like 5 pixels on either side of the image, I figured it wasn't worth the bother, but maybe if we want this to become popular site wide then the investment would be worth it. Thoughts?
- So, good job immediately finding the issues I was hoping wouldn't be noticed :) Anything here you think we should push further on before making this change? Efbrazil (talk) 16:42, 7 May 2020 (UTC)
- Yes I agree that older iOS versions are increasingly becoming niche situations. I don’t have much experience with Android devices, but I looked at a few articles, and it seems that Android tablets are also moving towards full desktop type browsing in Chrome. So the mobile browser limits on tablets should become less of an issue over time for this kind of graphic gallery.Dtetta (talk) 17:15, 7 May 2020 (UTC)
- Hmm... when I replace the the GHEffect svg with the entire 22.4em sidebar code and view the preview, the outer edge of the frame displays a bit narrower than the two top images. Increasing to 25em puts them into alignment for me, including when I enlarge or reduce the view with Apple's Command+ and Command- and Command0 key combinations. (Edit the entire page, not just the lead, to avoid a "No image found" error message in preview.) I think exact framing thickness etc. is secondary to large image size; I think it's best to proceed boldly on the presumption that if there is a minor presentation problem, someone will find a solution. —RCraig09 (talk) 18:55, 7 May 2020 (UTC)
- Ugh, yeah, trying to match thumbnail sizing is really ugly. It's based on a combination of your preferences and screen resolution. They say it's usually 220px width, but I never changed my settings and my values were (very) different from that- I was defaulting to 180, but now I see 220 after resetting to defaults. Maybe preferences get locked when you create an account on wikipedia? To see your values, go to "Thumbnail size" under Preferences → Appearance → Files. Do a reset on all preferences and see what Wikipedia now looks like to new users! Then there's the issue of screen resolution scaling on top of that.
- So, I implemented a hackaround- I insert an image, hide it, and then size the gallery to the hidden image. The trouble then is that if you click another image in the page and then use the right / left directional arrows to go through all images, you'll see the image that was hidden. To work around THAT, I stuffed in a fallback image in the hidden location. Take a look at right for the complete effect, which is better for the user but significantly further into the hacker world.
- Maybe we post this version into the article, then I reach out to the template authors and see if they (or I) can't fix the template to work more elegantly in the sidebar? Efbrazil (talk) 20:31, 7 May 2020 (UTC)
- I understand basically what you did (though I wouldn't know how!). Regardless, now the lead images are perfectly aligned on my desktop (without my changing any defaults), and the photos themselves are altogether decently sized. Result: success!
- (Sad-face) Things are
upright=1.35rather than the old 1.5; maybe for the lead there could be 1.5 but keep 1.35 in the body to prevent crowding problems. —RCraig09 (talk) 22:17, 8 May 2020 (UTC)
- @Efbrazil: were you ever able to incorporate this gallery into the article? Dtetta (talk) 23:13, 31 May 2020 (UTC)
References
- ^ "Coral Reef Risk Outlook". National Oceanic and Atmospheric Administration. Retrieved 4 April 2020.
At present, local human activities, coupled with past thermal stress, threaten an estimated 75 percent of the world's reefs. By 2030, estimates predict more than 90% of the world's reefs will be threatened by local human activities, warming, and acidification, with nearly 60% facing high, very high, or critical threat levels.
{{cite web}}: CS1 maint: url-status (link) - ^ Carbon Brief, 7 January 2020.
- ^ Cite error: The named reference
Turetsky 2019was invoked but never defined (see the help page). - ^ IPCC AR5 WG2 Ch28 2014, p. 30:Within 50 to 70 years, loss of hunting habitats may lead to elimination of polar bears from seasonally ice-covered areas, where two-thirds of their world population currently live.
- ^ "What a changing climate means for Rocky Mountain National Park". National Park Service. Retrieved 9 April 2020.
A greater number of mountain pine beetles (Dendroctonus ponderosae) survive the winter season, contributing to a longer and more severe pine beetle outbreak that is changing the landscape on trails and in campgrounds throughout the park.
{{cite web}}: CS1 maint: url-status (link) - ^ Serdeczny et al. 2016.
- ^ Porter, J.R., et al., Section 7.5: Adaptation and Managing Risks in Agriculture and Other Food System ActivitiesIPCC AR5 WG2 A 2014, pp. 513–520
- ^ National Oceanic and Atmospheric Administration. "What is nuisance flooding?". Retrieved April 8, 2020.
- ^ Kabir et al. 2016.
- ^ Van Oldenborgh et al. 2019.
- ^ Kevin E. Trenberth and John T. Fasullo (5 October 2016). "Insights into Earth's Energy Imbalance from Multiple Sources". Journal of Climate. 29 (20): 7495–7505. Bibcode:2016JCli...29.7495T. doi:10.1175/JCLI-D-16-0339.1.
Semi-protected edit request on 3 June 2020
This edit request has been answered. Set the |answered= or |ans= parameter to no to reactivate your request. |
In the third graph, please replace the unclear title
"Global temperature in the Common Era"
with the clear title
"Global temperature since AD 1"
Likewise in the figure legend, please replace the unclear text
"Global surface temperature reconstruction over the last millennia using proxy data"
with the specific text
"Global surface temperature reconstruction since AD 1 using proxy data"
In the longer term, please justify why the Wikipedia climate graphs start with the birth of Christ. More pertinently, the temperature graphs should start with the end of the last ice age 11,500 years ago.
Thank you. 86.161.81.81 (talk) 11:41, 3 June 2020 (UTC)
 Not done. See MOS:ERA. –Deacon Vorbis (carbon • videos) 14:46, 3 June 2020 (UTC)
- You are mistaken Deacon Vorbis. There is no mention of CE/BCE anywhere in the article. This "Common Era" is out of place and confusing. And, as I mention in my concluding sentence, the confusion is exacerbated because "Common Era" is not even relevant for climatology as a time period. I would like a considered second opinion from someone else, please. 86.161.81.81 (talk) 19:06, 3 June 2020 (UTC)
 Not done: Same. See MOS:ERA. Mdaniels5757 (talk) 22:00, 3 June 2020 (UTC)
Citation standards (<ref name=)
This standard confuses me:
- s: Use of named-refs (the "<ref name=" construct) to duplicate notes is discouraged.
I interpret this to mean that the desired coding is:
In which case the standard should be reworded:
- s: Use of named-refs (the "<ref name=" construct) to reduce duplicate notes is discouraged.
The following standard might be misleading:
- n: In-line citation of content to be done with short-cites (such as done with {{harvnb}} templates or similar).
I think of the {{sfn}} templates as being "similar". But standard "s:" would discourage their use because they combine notes.
Discouraging duplicate notes contradicts WP:DUPCITES. -- User-duck (talk) 18:29, 16 June 2020 (UTC)
- Shall we just remove s then? DUPCITES is mostly about full citations I think, so doens't quite apply, but I'm happy to make the CITEVAR easier and more consistent, and I like duplicating notes. Femke Nijsse (talk) 10:52, 18 June 2020 (UTC)
References
- ^ Smith 2020, p. 11
- ^ Jones 2020, p. 21
- ^ Smith 2020, p. 11
- ^ a b Smith 2020, p. 11.
- ^ Jones 2020, p. 21.
Citation standards
This standard should be reworded:
- k: Multiple authors: only the first five need be listed. If more than four set "
|display-authors=" to 4.
This is an example of the confusion of a "requirement" and a "method". I believe the "requirement" is:
- k: Multiple authors: only the first four are displayed. ["Method":] If more than four use "
|display-authors=4", or list four and use "|display-authors=etal"
Listing five (or more) authors and using |display-authors=4 implies all authors are listed and the display was shortened. Listing four authors and using |display-authors=etal shows that the author list was intentionally shortened.
There can be standards for methods. In which case I would propose the standard to be:
- k: Multiple authors: List all. If more than four set "
|display-authors=4".
I assume this standard applies to editors as well, but … . --User-duck (talk) 17:35, 16 June 2020 (UTC)
- Makes sense, feel free to edit as you see fit :). Femke Nijsse (talk) 18:46, 18 June 2020 (UTC)