
File:Migrant caravan.pdf
Size of this JPG preview of this PDF file: 773 × 599 pixels. Other resolutions: 310 × 240 pixels | 619 × 480 pixels | 864 × 670 pixels.
Original file (864 × 670 pixels, file size: 720 KB, MIME type: application/pdf)
| This is a file from the Wikimedia Commons. Information from its description page there is shown below. Commons is a freely licensed media file repository. You can help. |
Summary
| Description |
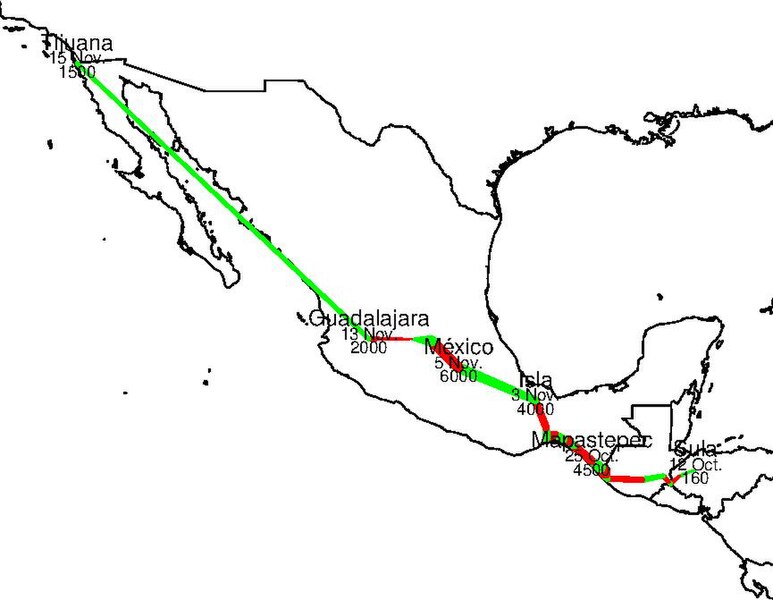
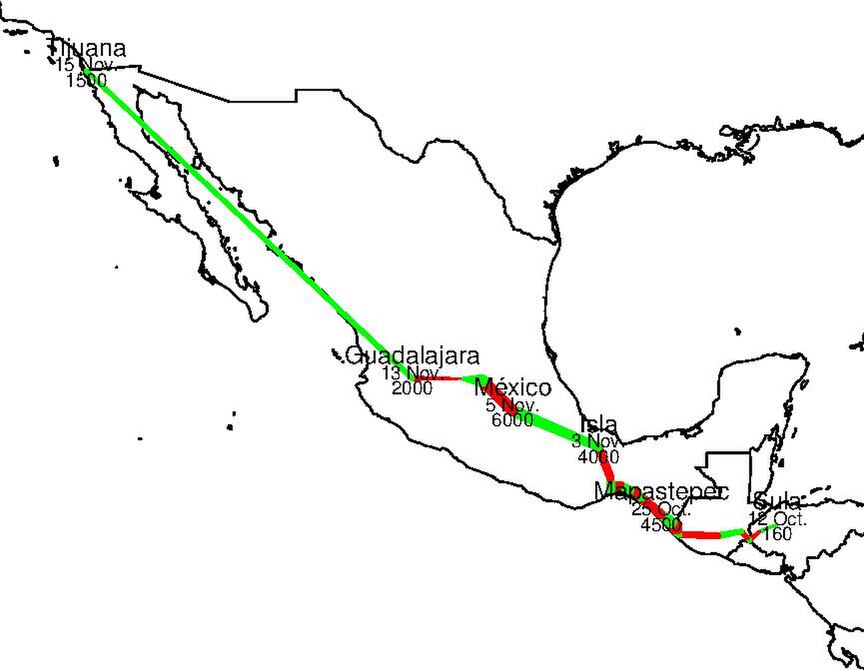
Deutsch: Mittelamerikanische Migrantenkaravane Herbst 2018 Der Weg der Karavane wird entsprechend w:en:Central_American_migrant_caravans#Table nachgezeichnet, wobei die Etappen gemäß Tabelle alternierend gefärbt sind. Nederlands: Centraal-Americaanse migrantencaravaan hervst 2018 English: Central American migrant caravan fall 2018
Feel free to improve the map! Current Code(File karavane.r) #R CMD BATCH karavane.r;pdfcrop migrant_caravan.pdf migrant_caravan.pdf
library(rnaturalearth)
library(plotrix)
liste<-read.table("karavane.tsv",header=TRUE,sep="\t",dec=",")
liste[,1]<-as.Date(liste[,1])
zeck<-.75#Schriftgröße
vek<-c(1,10,17,18,21,22)#Genannte Städte
band<-.95*max(max(liste$Longitude)-min(liste$Longitude),max(liste$Latitude)-min(liste$Latitude))/2#edge length map
mittex<-(max(liste$Longitude)+min(liste$Longitude))/2
mittey<-(max(liste$Latitude)+min(liste$Latitude))/2
map<-ne_countries(continent = "north america",scale=10)#Precise map for publication
#map<-ne_countries(continent = "north america",scale=110)#Small file for testing
farbe<-function(farbe.n){
farbe.f<-"red"
if(farbe.n%%2==0){farbe.f<-"green"}
farbe.f
}#Allow for differen colors per stage
#Plotfunktion:
bild<-function(){if(require(sp)){plot(map,ylim=c(mittey-band,mittey+band),xlim=c(mittex-band,mittex+band))}}#produces the map
marke<-function(tag){
text(liste$Longitude[tag],liste$Latitude[tag],labels=liste$Plak[tag],cex=1,pos=3)#Stadt
text(liste$Longitude[tag],liste$Latitude[tag]-.6,labels=liste$KD[tag],cex=zeck,pos=3)#Datum
text(liste$Longitude[tag],liste$Latitude[tag]-1.2,labels=liste$People[tag],cex=zeck,pos=3)#Stärke
}
dicke<-.00003#stream thickness
punkt<-function(punkt.n,punkt.r){
punkt.p<-c(liste$Longitude[punkt.n],liste$Latitude[punkt.n])
punkt.weg<-c(cos(punkt.r),sin(punkt.r))*dicke*liste$People[punkt.n]
punkt.p+punkt.weg
}
#flow
strich<-function(strich.n){
grund<-c(liste$Longitude[strich.n]-liste$Longitude[strich.n-1],liste$Latitude[strich.n]-liste$Latitude[strich.n-1])
gradient<-atan2(grund[2],grund[1])
länge<-norm(grund,type="2")
tüte<-asin((liste$People[strich.n]-liste$People[strich.n-1])*dicke/länge)
eck<-matrix(c(1:8),4)
eck[1,]<-punkt(strich.n,gradient+tüte+pi/2)
eck[2,]<-punkt(strich.n,gradient-tüte-pi/2)
eck[3,]<-punkt(strich.n-1,gradient-tüte-pi/2)
eck[4,]<-punkt(strich.n-1,gradient+tüte+pi/2)
polygon(eck[,1],eck[,2],col=farbe(strich.n),border=farbe(strich.n))
draw.circle(liste$Longitude[strich.n],liste$Latitude[strich.n],liste$People[strich.n]*dicke,col=farbe(strich.n),border=farbe(strich.n))
draw.circle(liste$Longitude[strich.n-1],liste$Latitude[strich.n-1],liste$People[strich.n-1]*dicke,col=farbe(strich.n),border=farbe(strich.n))
}
#lines()
#strich<-function(strich.n){lines(c(liste$Longitude[strich.n-1],liste$Longitude[strich.n]),c(liste$Latitude[strich.n-1],liste$Latitude[strich.n]),lwd=liste$People[strich.n-1]/1000,col=farbe(strich.n))}
#makes the path
ganz<-function(){
bild()#Plot erstellen
lapply(c(2:dim(liste)[1]),strich)#insert path
lapply(vek,marke)#Marken einfügen
}
#ganz()
pdf("migrant_caravan.pdf")#Outputdatei öffnen
ganz()#Jetzt wird gedruckt
dev.off()#Outputdatei schließen
Current Data(File karavane.tsv, as derived from w:en:Central American migrant caravans#Table) Date KD Place Plak Latitude Longitude People 2018-10-12 12 Oct. San Pedro Sula Sula 15,052018 -88,033333 160 2018-10-13 13 Oct. Santa Rosa de Copan Copan 14,766660 -88,783333 1000 2018-10-14 14 Oct. Ocotepeque Ocotepeque 14,433333 -89,183333 1700 2018-10-15 15 Oct. Aguas Calientes (Honduras) Calientes 14,531281 -89,283139 1600 2018-10-16 16 Oct. Chiquimula Chiquimula 14,783333 -89,533333 2000 2018-10-18 18 Oct. Ciudad de Guatemala Guatemala 14,613333 -90,535278 3000 2018-10-19 19 Oct. Ciudad Tecun Uman Tecun Uman 14,666667 -92,150000 3000 2018-10-21 21 Oct. Tapachula Tapachula 14,900000 -92,266667 7000 2018-10-24 24 Oct. Huixtla Huixtla 15,133333 -92,466667 5800 2018-10-25 25 Oct. Mapastepec Mapastepec 15,427778 -92,898333 4500 2018-10-26 26 Oct. Tonala Tonala 16,100000 -93,750000 4500 2018-10-27 27 Oct. Arriaga Arriaga 16,235000 -93,895556 3500 2018-10-28 28 Oct. Tapanatepec Tapanatepec 16,366667 -94,200000 4000 2018-10-30 30 Oct. Santiago Niltepec Niltepec 16,566667 -94,616667 4000 2018-10-31 31 Oct. Juchitán de Zaragoza Juchitán 16,433333 -95,016667 5000 2018-11-02 2 Nov. Matías Romero Matías Romero 16,866667 -95,033333 4000 2018-11-03 3 Nov. Isla, Veracruz Isla 18,033333 -95,533333 4000 2018-11-05 5 Nov. Ciudad de México México 19,433333 -99,133333 6000 2018-11-10 10 Nov. Santiago de Querétaro Querétaro 20,587500 -100,392778 6531 2018-11-11 11 Nov. Irapuato Irapuato 20,666667 -101,350000 1 2018-11-13 13 Nov. Guadalajara Guadalajara 20,676667 -103,347500 2000 2018-11-15 15 Nov. Tijuana Tijuana 32,525000 -117,033333 1500 |
| Date | |
| Source | Own work |
| Author | Ciciban |
Licensing
I, the copyright holder of this work, hereby publish it under the following license:
This file is licensed under the Creative Commons Attribution-Share Alike 4.0 International license.
- You are free:
- to share – to copy, distribute and transmit the work
- to remix – to adapt the work
- Under the following conditions:
- attribution – You must give appropriate credit, provide a link to the license, and indicate if changes were made. You may do so in any reasonable manner, but not in any way that suggests the licensor endorses you or your use.
- share alike – If you remix, transform, or build upon the material, you must distribute your contributions under the same or compatible license as the original.
File history
Click on a date/time to view the file as it appeared at that time.
| Date/Time | Thumbnail | Dimensions | User | Comment | |
|---|---|---|---|---|---|
| current | 08:08, 16 November 2018 |  | 864 × 670 (720 KB) | Ciciban | Actualized→Tijuana |
| 15:52, 15 November 2018 | 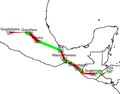 | 864 × 675 (777 KB) | Ciciban | Switched to linearly changing thickness | |
| 15:34, 14 November 2018 | 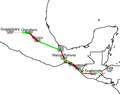 | 864 × 675 (768 KB) | Ciciban | Actualized | |
| 11:04, 11 November 2018 | 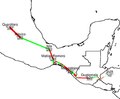 | 864 × 712 (783 KB) | Ciciban | Number fixed – currently only 2000 have arrived in Querétaro | |
| 10:49, 11 November 2018 |  | 864 × 712 (783 KB) | Ciciban | Querétaro added | |
| 09:49, 7 November 2018 | 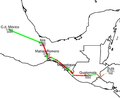 | 864 × 704 (792 KB) | Ciciban | *Colors per stage *Mexico City->Autonym (the map should work in other wikis, too) *New crowd size | |
| 12:49, 6 November 2018 | 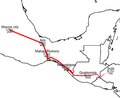 | 864 × 704 (792 KB) | Ciciban | Cropped and other issues | |
| 10:10, 6 November 2018 | 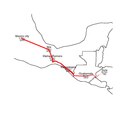 | 1,050 × 1,050 (73 KB) | Ciciban | Actualization | |
| 16:00, 4 November 2018 |  | 1,050 × 1,050 (5 KB) | Ciciban | Culprit corrected | |
| 15:54, 4 November 2018 |  | 1,050 × 1,050 (5 KB) | Ciciban | Actualization |
File usage
The following pages on the English Wikipedia use this file (pages on other projects are not listed):
Global file usage
The following other wikis use this file:
- Usage on fr.wikipedia.org
- Usage on he.wikipedia.org
- Usage on nl.wikinews.org
- Usage on zh.wikipedia.org