From Wikipedia, the free encyclopedia
Part of the 1999 Irish local elections
1999 North Tipperary County Council election|
|
|
|
|
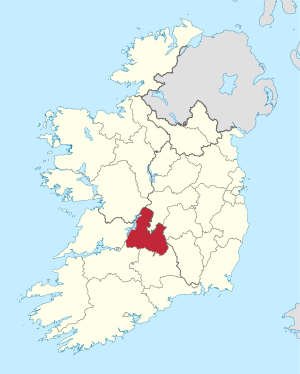 Map showing the area of North Tipperary County Council |
|
|
Council control after election
Fianna Fail
| |
An election to North Tipperary County Council took place on 10 June 1999 as part of that year's Irish local elections. 21 councillors were elected from four local electoral areas for a five-year term of office on the system of proportional representation by means of the single transferable vote (PR-STV).
Results by party[edit]
Results by local electoral area[edit]
Borrisokane[edit]
Borrisokane - 3 seats
| Party |
Candidate |
FPv% |
Count
|
| 1 |
2 |
3 |
4 |
5
|
|
|
Fianna Fáil
|
Jim Casey*
|
24.16
|
1,092
|
1,156
|
|
|
|
|
|
Fine Gael
|
Louis McCormack
|
18.96
|
857
|
911
|
1,023
|
1,040
|
1,048
|
|
|
Fine Gael
|
Gerard Darcy*
|
16.80
|
759
|
910
|
1,024
|
1,053
|
1,071
|
|
|
Fianna Fáil
|
Tony McKenna*
|
16.42
|
742
|
838
|
1,176
|
|
|
|
|
Fianna Fáil
|
Michael Hough*
|
12.90
|
583
|
665
|
|
|
|
|
|
Labour
|
Larry Dunne
|
10.75
|
486
|
|
|
|
|
| Electorate: 6,701 Valid: 4,519 (67.44%) Spoilt: 44 Quota: 1,130 Turnout: 4,563 (68.09%)
|
Nenagh - 7 seats
| Party |
Candidate |
FPv% |
Count
|
| 1 |
2 |
3 |
4 |
5 |
6 |
7
|
|
|
Fianna Fáil
|
Maire Hoctor
|
13.41
|
1,515
|
|
|
|
|
|
|
|
|
Fianna Fáil
|
Tom Harrington*
|
10.23
|
1,156
|
1,180
|
1,182
|
1,239
|
1,285
|
1,337
|
1,498
|
|
|
Fianna Fáil
|
Mattie (Coole) Ryan*
|
9.84
|
1,112
|
1,128
|
1,139
|
1,183
|
1,309
|
1,330
|
1,515
|
|
|
Fine Gael
|
Tom Berkery
|
9.35
|
1,056
|
1,061
|
1,106
|
1,135
|
1,158
|
1,230
|
1,306
|
|
|
Fianna Fáil
|
John Carroll
|
8.64
|
976
|
988
|
992
|
1,056
|
1,069
|
1,178
|
1,360
|
|
|
Independent
|
Martin Kennedy
|
8.33
|
941
|
942
|
1,033
|
1,041
|
1,236
|
1,265
|
1,357
|
|
|
Fine Gael
|
Tom Ryan*
|
8.27
|
934
|
944
|
975
|
1,013
|
1,019
|
1,050
|
1,079
|
|
|
Fianna Fáil
|
John Sheehy*
|
7.51
|
848
|
855
|
878
|
912
|
967
|
1,030
|
|
|
|
Labour
|
Seán Creamer
|
6.85
|
774
|
777
|
783
|
805
|
814
|
|
|
|
|
Labour
|
Senator Kathleen O'Meara
|
6.79
|
767
|
785
|
794
|
865
|
890
|
1,279
|
1,417
|
|
|
Fianna Fáil
|
Cait Delahunty
|
4.56
|
515
|
517
|
536
|
545
|
|
|
|
|
|
Sinn Féin
|
Paddy Hackett
|
3.98
|
450
|
454
|
456
|
|
|
|
|
|
|
Fine Gael
|
Pat Vaughan
|
2.24
|
253
|
253
|
|
|
|
|
|
| Electorate: 17,208 Valid: 11,297 (65.65%) Spoilt: 130 Quota: 1,413 Turnout: 11,427 (66.41%)
|
Templemore[edit]
Templemore - 5 seats
| Party |
Candidate |
FPv% |
Count
|
| 1 |
2 |
3 |
4 |
5
|
|
|
Fine Gael
|
Noel Coonan*
|
26.99
|
1,858
|
|
|
|
|
|
|
Fine Gael
|
Denis Ryan*
|
13.82
|
951
|
1,105
|
1,210
|
|
|
|
|
Fianna Fáil
|
Seán Mulrooney*
|
13.03
|
897
|
932
|
981
|
999
|
1,023
|
|
|
Fianna Fáil
|
Dr. Joe Hennessy
|
11.46
|
789
|
975
|
1,014
|
1,125
|
1,137
|
|
|
Fianna Fáil
|
John Hogan
|
11.46
|
789
|
865
|
890
|
1,120
|
1,121
|
|
|
Fianna Fáil
|
Dan Smith*
|
11.13
|
766
|
838
|
862
|
938
|
963
|
|
|
Fine Gael
|
Willie Kennedy
|
7.42
|
511
|
665
|
712
|
|
|
|
|
Labour
|
Anne Keegan
|
4.68
|
322
|
355
|
|
|
|
| Electorate: 11,126 Valid: 6,883 (61.86%) Spoilt: 79 Quota: 1,148 Turnout: 6,962 (62.57%)
|
Thurles[edit]
Thurles - 6 seats
| Party |
Candidate |
FPv% |
Count
|
| 1 |
2 |
3 |
4 |
5 |
6
|
|
|
Independent
|
Michael Lowry TD*
|
35.94
|
3,049
|
|
|
|
|
|
|
|
Fianna Fáil
|
Harry Ryan*
|
13.13
|
1,114
|
1,346
|
|
|
|
|
|
|
Independent
|
Willie Kennedy*
|
11.04
|
937
|
1,525
|
|
|
|
|
|
|
Fianna Fáil
|
John Egan*
|
10.33
|
876
|
959
|
988
|
1,013
|
1,045
|
1,163
|
|
|
Fianna Fáil
|
John Hanafin*
|
10.24
|
869
|
1,085
|
1,132
|
1,173
|
1,224
|
|
|
|
Fine Gael
|
Seán Cahill
|
5.83
|
495
|
694
|
765
|
785
|
824
|
932
|
|
|
Fine Gael
|
Mae Quinn*
|
5.58
|
473
|
706
|
770
|
793
|
905
|
1,115
|
|
|
Labour
|
John Kenehan
|
5.37
|
456
|
643
|
699
|
716
|
771
|
|
|
|
Independent
|
Noel O'Dwyer
|
2.53
|
205
|
313
|
358
|
365
|
|
|
| Electorate: 13,824 Valid: 8,484 (61.37%) Spoilt: 119 Quota: 1,213 Turnout: 8,603 (62.23%)
|
External links[edit]


