
Wikipedia:WikiProject Climate change/Figures
| Main | Participants | Popular articles | Recommended sources | Style guide | Get started with easy edits | Talk |
Inventory[edit]
Image 1: temperature record[edit]

Problems[edit]
- The image has not been updated since 2004.
- More reconstructions should have become
- I'm not entirely sure, but I seem to recall that either the MWP or the LIA were local effects and that in more recent temperature records, this is not really found back in the global temperature record.
- A new image should try to keep the extensive explanation and the use of multiple reconstructions. Maybe additionally error estimates of each of the reconstructions can be added in such a way that the clarity does not decrease.
Image 3: sea level rise[edit]
.png)
Problems[edit]
- lines should be thicker and labels bigger
- Maybe we can use more recent data
Discussion[edit]
I've obtained the data from Mengel (http://www.pnas.org/content/113/10/2597). They manage to bridge the gap between semi-emperical methods and process-based modelling and seem quite representative of the current state of sea level research. As a side note, Next year a new IPCC report will be published on sea level rise (SROCC report). Femkemilene (talk) 13:35, 17 August 2018 (UTC)
Image 4: Attribution[edit]

Problems[edit]
- Only one climate model is used
- Should be updated to current time
- We could make graph start in 1880, but this might lead to a graph with too much information.
- Due to the fact that two axes have been used, it's not clear at once that greenhouse gas forcing alone is actually leading to more warming than observed.
- The uncertainty in aerosol forcing and greenhouse gas forcing is not shown. Might be difficult to show this.
- I don't think that for the latest ensembles the additivity is still true.
Image 6: Solar influence[edit]
Problems[edit]
_and_the_Sun%27s_energy_received_at_the_top_of_Earth%27s_atmosphere_(red,_bottom)._Solar_energy_has_been_measured_by_satellites_since_1978.gif)
- The current figure on the Attribution of recent climate change page only shows data up to 2009. We have an additional 10 years of data, or 30% more.
- Furthermore, the graph is in Fahrenheit, which only people in the US would understand.
- Better choice of colors makes it less ugly
- Bit larger font makes it readable as a thumb
Discussion[edit]
Image 7: Warming stripes[edit]
.png)
Bottom graphic: global average.
Problems[edit]
- Solves data visualization problem of communicating global warming data, especially to non-scientists
Discussion[edit]
— Preferred features[edit]
- Minimize technical indicia; use color to communicate
- Black background preferred, to accentuate colors. <--- Originator Ed Hawkins (scientist)'s observation.
- Examples are at https://commons.wikimedia.org/wiki/Category:Warming_stripes. Some images are created by climate scientists; others are laboriously generated by me. —RCraig09 (talk) 19:49, 29 September 2019 (UTC)
— Advantages[edit]
- Is intuitive: immediately associates blues --> cooler and reds --> warmer.
- Avoids technical indicia that can be distracting, confusing, or discouraging for non-scientist readers (= the majority of WP readers)
- Is gaining scientific recognition and WP:RS use (>100 broadcast meteorologists, covers of The Economist and The Guardian, UK Met Office website, U.S. Congress Committee logo, etc.) See end of Warming stripes#Applications and influence.
- Is being adopted and extended by other climate scientists. See Warming stripes#Extensions of warming stripes.
- "Stacking" warming stripes (top graphic in image) allows immediate comparison of large numbers of individual datasets
- Flexible shaping (height/width) to suit application (can be rectangular, concentric, ring-shaped, etc.)
- Designed with aesthetics as a consideration (suitable for merchandise, etc.)
— Disadvantages/obligations[edit]
- The graphic may not be immediately or widely recognized
- A textual caption (such as the one at right) is often needed to explain the warming stripes concept, especially if "stacked". (In-image legends can be included if needed, as in the image at right)
- Confidence intervals aren't represented
- "Intuitive" color shades don't convey quantitative degree of change as analytically as line charts
- Simple (non-stacked) warming stripes, being essentially a one-dimensional heat map, represent only a single variable.
- Cheap, general-purpose software to quickly generate the graphic apparently isn't available at this time
Finished[edit]
Image 2: CO2 record[edit]


Problems[edit]
- There should be an update, at least in the past 1000 years part.
- The figure is not SVG
- The figure could be extended to the last 800 000 years. It might become more ugly if we do so, but I think it reflects current knowledge better
- The capitalisation in the inset box should be removed
Discussion for new image[edit]
Here as well, we might need to contact authors of recent reconstructions.
- I've almost finished making new image which will go back 800 000 years. There are reconstructions that go further back (1 million years is latest ice core record, but there are some reliable proxies going back further). I don't really see the point in using them. Femkemilene (talk) 08:43, 24 May 2018 (UTC)
- I think it looks good with the 800k years.
- However, I'm not really a fan of the orange-ish background. For me it seems like too strong a color (i.e. distracting) and doesn't mix too well with the cyan color used for the earliest part of the ice core record.
- Also, it's not a big deal, but the reason an oval was used to indicate the inset portion in the original was to avoid a potential confusion. By indicating the inset portion with a rectangle some observers will assume the small rectangle shows exactly the dimensions of the inset plot. Of course that's not the case since the x dimension of your inset indicating box is actually much wider than 1000 years. Dragons flight (talk) 07:14, 29 May 2018 (UTC)
- I agree with the background. I played around a bit with different colors, but after a couple of minutes I couldn't find a good color. Will spend some more time on it to see if a blueish or grey color can be found that doesn't distract and is easily distinguishable from the actual graph.
- Good point as well for the inset figure. Didn't think about that. Femkemilene (talk) 08:37, 29 May 2018 (UTC)
- New version is up.Femkemilene (talk) 13:26, 10 June 2018 (UTC)
Image 5: IPCC range ECS[edit]


I've just made this figure for the climate sensitivity page. I think I should choose a darker color gray for the title and labels. Questions
- Should I include Fahrenheit on the right? Or would that be too busy?
- Is this a good visualisation between the informal quantification of ECS in FAR, SAR and TAR vs formal statement of uncertainty in AR4 and AR5
- I've lumped together the statements about very unlikely larger than 1.5 in AR4 and extremely likely smaller than 1.0 in AR5. What is a better visual representation of this uncertainty?
Femke Nijsse (talk) 21:50, 20 March 2019 (UTC)
- I've come up with a new idea to show the quantification of informal uncertainty. (just showed it to my partner, who is statistician, and he things the graph is still rubbish at conveying the information). What if I draw arrows up from where there are no estimates? And for the AR4 and AR5 where an actual estimate exists, I put a horizontal line at the end of the line in place? Femke Nijsse (talk) 19:33, 22 March 2019 (UTC)
Gallery of finished figures[edit]
Gallery of finished figures
-
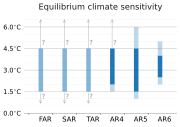 Overview estimates climate sensitivity IPCC
 -
 CO2 from ice cores and Keeling curve
 -
 Pages2k reconstruction 2019
 -
 Radiative forcing IPCC report
 -
 Write a caption here


