This is a discussion archive containing comments posted in 2020. Please do not post any new comments on this page. See current discussion, or the archives index.
That's funny, Htonl--you never answered the IP's question, as far as I can tell, but I came here to ask you about a similar map, File:South Africa 2011 Afrikaans speakers proportion map.svg. I am trying to replicate the results but am having a hard time. You have Afrikaans as the primary language for 80-100% of the people in pretty much all of Northern Cape and Western Cape. According to the 2011 Census, page 23, NC has 606,000 L1 speakers of Afrikaans out of a total of 1.13 million speakers (54%), and WC has 2.82 million L1 speakers of Afrikaans out of 5.68 million speakers (about 50%). Now, your map says it's at the ward level, and it's possible that (like American gerrymandered election) the "general", popular level produces different results, but still that is a huge discrepancy--from 50% overall to just about all of WC and NC provinces at 80-100%. My concern is that the resulting picture suggests that the western part of the country, in both maps, is almost completely Afrikaans-speaking. Doug Weller, is my math off very much? Drmies (talk) 17:49, 23 January 2020 (UTC)[reply]
Drmies I don't think so. I certainly can't figure how the figures produce the map. Doug Wellertalk 20:01, 23 January 2020 (UTC)[reply]
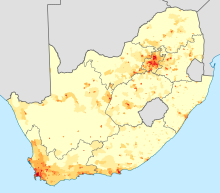
SA population density
@Drmies and Doug Weller:: you have to consider the distribution of population. Take a look at the population density map to the right - the population density is extremely uneven. Non-Afrikaans-speakers are concentrated in the cities (Cape Town, Kimberley, George) as well as the far north-eastern part of the Northern Cape (along the border with the North West). There are huge areas of the west (especially in the Northern Cape) where there are almost no people, but the tiny number of people that are there speak Afrikaans. Afrikaans-speaking population density The "proportion" map is potentially confusing in this way, which is why it is paired with a "density" map (also visible on the right) which gives a picture of the distribution of the Afrikaans population, and the two maps are displayed in close proximity on the articles Afrikaans and Afrikaans speaking population in South Africa.
To put it in figures: in the Western Cape, 64% of the province's population and 80% of its non-Afrikaans-speaking population live in the City of Cape Town, which occupies only 2% of the province's land area. In the Northern Cape, the Frances Baard District Municipality and John Taolo Gaetsewe District Municipality together contain 53% of the province's population and 79% of its non-Afrikaans-speaking population, but occupy only 11% of the land area. - htonl (talk) 22:22, 23 January 2020 (UTC)[reply]
Late addition: if you X out the wards with very low population (<1 person/km2) the Afrikaans proportion map looks like this. - htonl (talk) 23:51, 23 January 2020 (UTC)[reply]
To answer the IP's question (apologies that I didn't respond sooner): the ward geometries can be downloaded at [1] and the population statistics can be obtained from StatsSA at [2] (register/log in; choose Community Profiles -> Census 2011 -> Descriptive -> Descriptive, then New Table; click the arrow next to Geography and select South Africa by Electoral Wards, then Add to Row; click the arrow next to Language and select Language, then Add to Column; click Retrieve Data; download results using the dropdown in the top right). - htonl (talk) 22:31, 23 January 2020 (UTC)[reply]
Langville, Western Cape
Why did you turn Langville, Western Cape into a redirect? The target article does not mention Langville, nor did you insert anything relevant on the same date. On the face of it, that was not a helpful thing to do. SpinningSpark 20:05, 14 March 2020 (UTC)[reply]
@Spinningspark: That was ten years ago, so my memory is fuzzy. But IIRC there were at that time a lot of stub articles being created in the same format as that Langville one was before I redirected it, i.e. "X is a settlement in Y Municipality in the Z province of South Africa" with no further information. I think they were generated off of some list. Anyway, lots of them were for neighbourhoods and we redirected a lot of those to the articles for the towns of which they were part. In the case of Langville it's a spelling error as well because the correct name is Laingville. You will see it is actually referred to in that article, under "Geography":
The region of Saint Helena Bay is sub-divided into various suburbs, namely (from east to west):Slippers Bay(Home of the famous Novella family), Laingville(Situated on part of the farm Elandskloof that was owned by the Laing Family), ...
Ok, I had missed "Laingville" in the article. As it is a misspelling, we should mark it as a misspelling or delete it. If we keep it, a redirect with the correct spelling should also exist. SpinningSpark 22:50, 14 March 2020 (UTC)[reply]
I have no objections either way. - htonl (talk) 23:17, 14 March 2020 (UTC)[reply]
Neighborhood shapes on Wikidata for use on Wikipedia
Hi Htonl, I want to start adding district maps on Cape Town neighborhood articles pages similar to the one on the Hell's Kitchen, Manhattan article. This however seems to require shape files for these areas to be on Wikidata so they can be called into the mapbox template for use on Wikipedia. I see you have very kindly (big thank you) shared these files with the public in kml format on your website. Is there a way we could get those shape files en-mass onto Wikidata (ping @YaguraStation: for any suggestions here should we be able to get a pile of shape files)? Once they are on Wikidata we can then start a process of giving all neighborhood areas maplinked mapboxs to show readers the geographical boundaries of the neighborhood they are looking at.--Discott (talk) 09:17, 23 July 2020 (UTC)[reply]
@Discott: The areas on my site are the "main places" and "subplaces" from Census 2011; you can grab them at https://stuff.adrianfrith.com/MP_SA_20.zip and https://stuff.adrianfrith.com/SP_SA_20.zip. However - as far as I can tell - you can't add shapes directly to a Wikidata entry; you have to have a relation in OpenStreetMap and tag it with wikidata=Qxxxxx to link it to the Wikidata entry. Then you can use {{Infobox mapframe}} to add the map to the infobox. As an example I have done Rondebosch which already had a linked relation in OSM. As a complication, I'm not sure whether the copyright status of that Stats SA data would be acceptable for OSM. - htonl (talk) 17:17, 23 July 2020 (UTC)[reply]
@Htonl: Firstly thanks for all your work in OSM and Wikimedia projects. I'd be very happy to assist, Discott! The wards are all neatly mapped in OSM by Htonl, but they don't meet the "suburb" definition, sometimes being larger and smaller. Suburbs for Cape Town are indeed available in OSM (query in overpass), but not for all areas unfortunately (e.g. Philippi). So then do I see it right that I should (1) start adding the Wikidata keys to the established suburbs in OSM? And (2) map the missing Capetonian suburbs in OSM with corresponding Wikidata keys? Next to StatsSA, CoCT's Open Data Portal has published suburbs as shapes with their dubious "custom license" which could be uploaded and referenced in Commons, but it's probably safer and more sustainable to maintain them in OSM. Also CoCT's data varies in quality. If you have tooling tips, let me know. Because the next step would be to check StatsSA and OSM compatibility and batch process that. -- YaguraStation (talk) 18:43, 23 July 2020 (UTC)[reply]
@YaguraStation: Indeed the wards are purely electoral structures which change every five years, and don't correspond to anything we would write articles about on Wikipedia. You do have it right in your points (1) and (2). I've added some Wikidata tags in Cape Town and it looks like you've been doing the same. However it seems there's currently a pause on importing data from OSM into the Wikimedia servers - see the note mw:Help:Extension:Kartographer#External_data and the linked bug reports on Phabricator.
When adding new suburbs, for Cape Town I'd suggest to use the City Council's boundaries over the Census. The road-side signs that name a suburb when you are entering it, seem to correspond to the City Council's boundaries (not suprising since they are responsible for the signs).
As to bulk imports, I'm not sure about them. Most of the boundaries run along roads, and I'd think in OSM we'd probably want to use the existing road segments as part of the suburb relations - not sure if we can do that automatically. Manual addition of suburbs might be better. - htonl (talk) 20:39, 25 July 2020 (UTC)[reply]
@Htonl: Yes, will be slowly mapping the outstanding Capetonian suburbs in OSM as multipolygons using outer boundaries additionally to existing suburb nodes, like the others. And will be using the CoCT's data as reference. But this will take some time. -- YaguraStation (talk) 07:48, 27 July 2020 (UTC)[reply]
@Htonl:, now that I have been involved in the whole copyright space for some time I can say with certainty that such data is not copyrightable. Long story short, one can only copyright creative works. Data is a reflection of fact, it has no transformative creativity, and so is not copyrightable. I am happy to get a legal opinion on this to back us up on it? This is also going on Wikidata which has very different requirements than Wikipedia so I doubt we will get any friction from there. --Discott (talk) 09:26, 24 July 2020 (UTC)[reply]
@Discott: I certainly defer to you on copyright questions. I think the requirements though would be those of OpenStreetMap rather than Wikidata since the data would be uploaded to OSM. Perhaps we should ask User:Firefishy who is/was on the OSM Data Working Group. - htonl (talk) 20:39, 25 July 2020 (UTC)[reply]
@Htonl: good call. I am not familiar with the role OSM would play in all of this so I am all in favour of asking Firefishy for their input on this.--Discott (talk) 13:41, 27 July 2020 (UTC)[reply]
About the "Numero" symbol (№)
Sorry i did not know it was forbidden.I will change it i saw it in List of prime ministers of Czechoslovakia and i thought it was ok again i am sorry
The discussion will take place at Wikipedia:Articles for deletion/Matriculation in South Africa until a consensus is reached, and anyone, including you, is welcome to contribute to the discussion. Users may edit the article during the discussion, including to improve the article to address concerns raised in the discussion. However, do not remove the article-for-deletion notice from the top of the article.
To customise your preferences for automated AfD notifications for articles to which you've significantly contributed (or to opt-out entirely), please visit the configuration page. Delivered by SDZeroBot (talk) 01:04, 24 October 2020 (UTC)[reply]
ArbCom 2020 Elections voter message
Hello! Voting in the 2020 Arbitration Committee elections is now open until 23:59 (UTC) on Monday, 7 December 2020. All eligible users are allowed to vote. Users with alternate accounts may only vote once.
The Arbitration Committee is the panel of editors responsible for conducting the Wikipedia arbitration process. It has the authority to impose binding solutions to disputes between editors, primarily for serious conduct disputes the community has been unable to resolve. This includes the authority to impose site bans, topic bans, editing restrictions, and other measures needed to maintain our editing environment. The arbitration policy describes the Committee's roles and responsibilities in greater detail.
If you wish to participate in the 2020 election, please review the candidates and submit your choices on the voting page. If you no longer wish to receive these messages, you may add {{NoACEMM}} to your user talk page. MediaWiki message delivery (talk) 01:16, 24 November 2020 (UTC)[reply]
Provincial-level shapefile
Sorry to bother you, but I was thinking of making a map in a similar style to the blank maps that you've made for the linguistic articles, except somewhat larger and with text added. Since the blank map that you used as a base was somewhat smaller than I needed for my purposes, I decided to recreate the map myself. It has been difficult to find shapefiles which are up-to-date, and most files I've found online either are outdated, or are up-to-date but also provide local municipalities (which I don't think I need for the moment). Do you have the shapefile which you used to make that map? Jerry (talk) 21:23, 28 November 2020 (UTC)[reply]
Yes, though when I went to download one of the PNG previews of the map, everything wasn't as smooth as the original file was, and since I'm not sure how to download the SVG itself, I decided to remake it from scratch in Inkscape. It wasn't too hard to get data for coastlines and national borders and urban areas from Natural Earth, so the only other thing I had to find was that. I don't think I understood what you meant, I don't think I can download the original SVG file to edit myself.Jerry (talk) 00:16, 30 November 2020 (UTC)[reply]
@JerrySa1: if you go to a map's File page (e.g. File:Map_of_South_Africa_with_provincial_borders.svg), just below the image of the map and the links of PNG previews, you will see a link to "Original file". Right click on that link and you can do "Save Link As" to download the original SVG. - htonl (talk) 00:23, 30 November 2020 (UTC)[reply]
Oh... that's something I didn't really consider. It seems I wasted an hour or two on something which would take less than a minute. On the bright side, the parts of the map I had completed seem to match up perfectly with the basemap you posted, so it seems I did it correctly. Thank you for the clarification. Jerry (talk) 00:34, 30 November 2020 (UTC)[reply]
@Garble: Hey, that's a good idea (especially since I'm holidaying only a few kilometres away from Tesselaarsdal) so I've written up a brief article: Tesselaarsdal. - htonl (talk) 12:20, 29 December 2020 (UTC)[reply]
Wow, that's impressive! Much better sources than I was able to find. What seems odd is that there is no postal code. It seems there is no more postal service? Garble (talk) 19:17, 29 December 2020 (UTC)[reply]
@Garble: no, I just hadn't thought to add the postal code. :) It is in the 7230 zone of the Caledon post office. - htonl (talk) 19:39, 29 December 2020 (UTC)[reply]


