From Wikipedia, the free encyclopedia
1983 United Kingdom general election Opinion polls Turnout 72.7%,
Presidents [ edit ]
Presidency[b]
President
Party[c]
Election
Vice President
1
May 1, 1948 January 20, 1953
Clement Attlee
Labour
1945
Herbert Morrison
2
January 20, 1953 January 20, 1957
Winston Churchill
Conservative
1952
Anthony Eden
3
January 20, 1957 January 20, 1965
Harold Macmillan
Conservative
1956
Rab Butler
Selwyn Lloyd
1960
35
January 20, 1961 November 22, 1963
John F. Kennedy [d]
Democratic
1960
Lyndon B. Johnson
36
November 22, 1963 January 20, 1969
Lyndon B. Johnson
Democratic
Vacant through
1964
Hubert Humphrey
37
January 20, 1969 August 9, 1974
Richard Nixon [e]
Republican
1968
Spiro Agnew [e]
1972
Vacant, Oct. 10 – Dec. 6, 1973
Gerald Ford [f]
38
August 9, 1974 January 20, 1977
Gerald Ford
Republican
Vacant through
Nelson Rockefeller [f]
39
January 20, 1977 January 20, 1981
Jimmy Carter
Democratic
1976
Walter Mondale
40
January 20, 1981 January 20, 1989
Ronald Reagan
Republican
1980
George H. W. Bush
1984
41
January 20, 1989 January 20, 1993
George H. W. Bush
Republican
1988
Dan Quayle
42
January 20, 1993 January 20, 2001
Bill Clinton
Democratic
1992
Al Gore
1996
43
January 20, 2001 January 20, 2009
George W. Bush
Republican
2000
Dick Cheney
2004
44
January 20, 2009 January 20, 2017
Barack Obama
Democratic
2008
Joe Biden
2012
45
January 20, 2017 Incumbent Donald Trump
Republican
2016
Mike Pence
Sources: [1] [2] [3]
2005 Conservative Party leadership election
Candidate
Liam Fox
David Cameron
First ballot
56 (28.3%)
62 (31.3%)
Second ballot
90 (45.5%)
57 (28.8%)
Members' vote
134,446 (67.6%)
64,398 (32.4%)
Candidate
David Davis
Kenneth Clarke
First ballot
42 (21.2%)
38 (19.2%)
Second ballot
51 (25.7%)
Eliminated
Members' vote
Eliminated
Eliminated
2007 Labour Party leadership election
2010 United Kingdom general election Opinion polls Turnout 65.1% (
2014 United Kingdom general election Opinion polls Registered 46,354,197 Turnout 66.4%[4]
First party
Second party
Leader
Liam Fox
David Miliband
Party
Conservative
Labour
Leader since
6 December 2005
25 September 2010
Leader's seat
North Somerset
Doncaster North
Last election
305 seats, 36.1%
258 seats, 29.0%
Seats won
329*
232
Seat change
Popular vote
11,334,226
9,347,273
Percentage
36.9%
30.4%
Swing
pp
pp
Third party
Fourth party
Leader
Nicola Sturgeon
David Laws
Party
SNP
Liberal Democrats
Leader since
14 November 2014
28 April 2010
Leader's seat
Did not stand [n 1] Sheffield Hallam
Last election
6 seats, 1.7%
57 seats, 23.0%
Seats won
56
8
Seat change
Popular vote
1,454,436
2,415,916
Percentage
4.7%
7.9%
Swing
pp
pp
Colours denote the winning party, as shown in the main table of results.
* Figure does not include the Speaker of the House of Commons John Bercow , who was included in the Conservative seat total by some media outlets.
2010 United Kingdom general election Opinion polls Turnout 61.4% (
First party
Second party
Third party
Leader
Shirley Williams
Owen Paterson
Tony Benn
Party
SDP
Conservative
Labour
Leader since
9 August 2010
6 November 2007
10 November 1984
Leader's seat
Sefton Central
North Shropshire
Chesterfield
Last election
52 seats, 18.3%
166 seats, 31.7%
413 seats, 40.7%
Seats before
51
165
403
Seats won
62
198
355 ‡
Seat change
Popular vote
5,985,454
8,784,915
9,552,436
Percentage
22.0%
32.4%
35.2%
Swing
pp
pp
pp
Fourth party
Fifth party
Sixth party
Leader
Nick Clegg
Jeremy Corbyn
Nick Griffin
Party
Liberal Democrats
Ind. Labour Party
BNP
Leader since
23 August 2007
9 August 2008
27 September 1999
Leader's seat
Sheffield Hallam
Islington North
Barking
Last election
52 seats, 18.3%
52 seats, 18.3%
52 seats, 18.3%
Seats before
51
51
51
Seats won
62
62
62
Seat change
Popular vote
5,985,454
5,985,454
5,985,454
Percentage
22.0%
22.0%
22.0%
Swing
pp
pp
pp
Colours denote the winning party, as shown in the main table of results.
* Indicates boundary change – so this is a nominal figure
‡ Figure does not include the Speaker , Michael Martin
1997 Labour Party leadership election
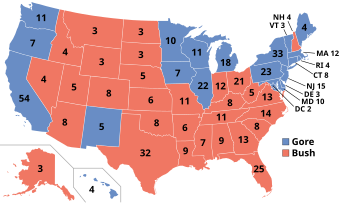
2000 United States presidential election Turnout 51.2%[6] pp
Presidential election results map.
Red denotes states won by Bush/Cheney and
blue denotes those won by Gore/Lieberman. One of D.C.'s three electors
abstained from casting a vote for president or vice president. Numbers indicate
electoral votes cast by each state and the District of Columbia.
2004 United States presidential election Turnout 56.7%[7] pp
Presidential election results map.
Red denotes states won by Bush/Cheney and
blue denotes those won by Kerry/Edwards. Numbers indicate
electoral votes cast by each state and the District of Columbia.
Faithless elector : John Edwards 1 (
MN )
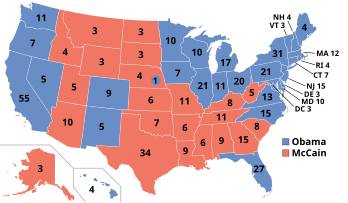
2008 United States presidential election Opinion polls Turnout 58.2%[10] pp
Presidential election results map.
Blue denotes states won by Obama/Biden and
red denotes those won by McCain/Palin. Numbers indicate
electoral votes cast by each state and the District of Columbia.
1995 Conservative Party leadership election
{{Infobox election
| election_name = 1939 United Kingdom general election
| country = United Kingdom
| type = parliamentary
| ongoing = no
| previous_election = 1922 United Kingdom general election
| previous_year = 1924
| outgoing_members = List of MPs elected in the United Kingdom general election, 1922
| next_election = 1924 United Kingdom general election
| next_year = 1945
| seats_for_election = All 500 seats in the House of Commons | majority_seats = 251
| elected_members = List of MPs elected in the United Kingdom general election, 1923
| election_date = 6 December 1939
| turnout = 71.1%, File:Neville Chamberlain (cropped).jpg Neville Chamberlain
| leader_since1 = 16 November 1939
| party1 = Conservative Party (UK)
| leaders_seat1 = Birmingham Ladywood
| last_election1 = 412 seats, 46.8%
| seats1 = 265
| seat_change1 =
| popular_vote1 = 10,025,083
| percentage1 = 47.8%
| swing1 =
| image3 =
| leader3 = Richard Acland
| leader_since3 = 11 November 1939
| party3 = Labour Party (UK)
| leaders_seat3 = Gravesend
| last_election3 = 151 seats, 33.3%
| seats3 = 40
| seat_change3 =
| popular_vote3 = 2,519,646
| percentage3 = 11.9%
| swing3 =
| image2 = Winston Churchill
| leader_since2 = 13 November 1939
| party2 = Liberal Party (UK)
| leaders_seat2 = Woodford
| last_election2 = 33 seats, 6.5%
| seats2 = 195
| seat_change2 =
| popular_vote2 = 7,984,988
| percentage2 = 38.0%
| swing2 =
| title = Prime Minister
| posttitle = Prime Minister after election
| before_election = Lord Mountbatten
| before_party = Reconstruction Authority
| after_election = Neville Chamberlain
| after_party = Conservative Party (UK)
}
1945 Commonwealth of Britain election Turnout 55.7%[14] pp
}
2005 Conservative Party leadership election
Candidate
David Davis Kenneth Clarke
First ballot
56 (28.3%)
62 (31.3%)
Second ballot
90 (45.5%)
57 (28.8%)
Members' vote
134,446 (67.6%)
64,398 (32.4%)
Candidate
Liam Fox
David Cameron
First ballot
42 (21.2%)
38 (19.2%)
Second ballot
51 (25.7%)
Eliminated
Members' vote
Eliminated
Eliminated
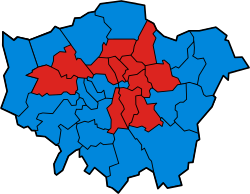
2008 London mayoral election Turnout 45.3%
First preference votes by London borough. Blue boroughs are those with most first preference votes for David Cameron and red those for Ken Livingstone
2012 London mayoral election Turnout 38.1% pp
Result of voting by London borough. Blue boroughs are those with most votes for David Cameron and red those for Ken Livingstone.
References [ edit ]
^ "Presidents" . whitehouse.gov . Washington, D.C.: White House . Retrieved February 20, 2020 .^ "Chronological List of Presidents, First Ladies, and Vice Presidents of the United States" . , Washington, D.C.: Prints and Photographs Division, Library of Congress . Retrieved February 20, 2020 .^ Kelly, Martin (February 17, 2020). "Chart of the Presidents and Vice Presidents" . thoughtco.com . New York, New York: Dotdash . Retrieved February 20, 2020 . ^ "The May 2015 UK elections: Report on the administration of the 7 May 2015 elections, including the UK Parliamentary general election" (PDF) . p. 3.^ "1995: Major wins Conservative leadership" . BBC News . 4 July 1995.^ "Voter Turnout in Presidential Elections" . Presidency.ucsb.edu . Archived from the original on September 24, 2018. Retrieved August 18, 2016 .^ "Voter Turnout in Presidential Elections" . Presidency.ucsb.edu . Retrieved 2016-08-18 .^ a b "Federal Elections 2004: Election Results for the U.S. President, the U.S. Senate and the U.S. House of Representatives" (PDF) . Federal Election Commission. May 2005. Retrieved November 20, 2012 .^ One Minnesota elector voted for Edwards for both president and vice president. During the counting of the vote in Congress, Rep. Stephanie Tubbs Jones (D-Ohio) and Sen. Barbara Boxer (D-Calif.) raised objections to the Ohio Certificate of Vote alleging that the votes were not regularly given. Both houses voted to override the objection, 74 to 1 in the Senate and 267 to 31 in the House of Representatives. See the 2004 presidential election results from the National Archives and Records Administration .
^ "Official 2008 Presidential General Election Results" (PDF) . fec.gov . Retrieved 2017-03-31 .^ "Federal Elections 2012: Election Results for the U.S. President, the U.S. Senate and the U.S. House of Representatives" (PDF) . Federal Election Commission. p. 5. Retrieved August 1, 2020 .^ "Federal Elections 2012: Election Results for the U.S. President, the U.S. Senate and the U.S. House of Representatives" (PDF) . Federal Election Commission. p. 5. Retrieved August 1, 2020 .^ "FEDERAL ELECTIONS 2016 -- Election Results for the U.S. President, the U.S. Senate and the U.S. House of Representatives" (PDF) . Federal Elections Commission . December 2017. Retrieved August 12, 2020 .^ ("Official 2016 Presidential General Election Results" (PDF) . Federal Election Commission . December 2017. Retrieved February 12, 2018 ."Voting and Registration in the Election of November 2016" . United States Census Bureau . May 2017. Retrieved November 10, 2017 .
Cite error: There are <ref group=lower-alpha> tags or {{efn}} templates on this page, but the references will not show without a {{reflist|group=lower-alpha}} template or {{notelist}} template (see the help page ). Cite error: There are <ref group=note> tags on this page, but the references will not show without a {{reflist|group=note}} template (see the help page ). Cite error: There are <ref group=n> tags on this page, but the references will not show without a {{reflist|group=n}} template (see the help page ).

.jpg)
.jpg)
.jpg)

.jpg)


.jpg)


.jpg)
.jpg)


.jpg)


.jpg)
.jpg)

_(cropped).jpg)


.jpg)


.jpg)
.jpg) | leader2 = Winston Churchill
| leader_since2 = 13 November 1939
| party2 = Liberal Party (UK)
| leaders_seat2 = Woodford
| last_election2 = 33 seats, 6.5%
| seats2 = 195
| seat_change2 =
| popular_vote2 = 7,984,988
| percentage2 = 38.0%
| swing2 =
| title = Prime Minister
| posttitle = Prime Minister after election
| before_election = Lord Mountbatten
| before_party = Reconstruction Authority
| after_election = Neville Chamberlain
| after_party = Conservative Party (UK)
}
| leader2 = Winston Churchill
| leader_since2 = 13 November 1939
| party2 = Liberal Party (UK)
| leaders_seat2 = Woodford
| last_election2 = 33 seats, 6.5%
| seats2 = 195
| seat_change2 =
| popular_vote2 = 7,984,988
| percentage2 = 38.0%
| swing2 =
| title = Prime Minister
| posttitle = Prime Minister after election
| before_election = Lord Mountbatten
| before_party = Reconstruction Authority
| after_election = Neville Chamberlain
| after_party = Conservative Party (UK)
}

.jpg)


.jpg)
.jpg)