
Talk:Climate change/Archive 78
| This is an archive of past discussions. Do not edit the contents of this page. If you wish to start a new discussion or revive an old one, please do so on the current talk page. |
| Archive 75 | Archive 76 | Archive 77 | Archive 78 | Archive 79 | Archive 80 | → | Archive 85 |
Captions, and figures near top of article
@RCraig09: Nice work simplifying the captions! In this way technical notes are indeed not necessary. I think the caption and / or the map figure is a bit off or problematic. It now says that some areas have cooled, implying that we can see some type of trend in this figure. Pedantically, this is incorrect. We have a comparison of two snapshots, where the second one only covers a 5 year window. If you look at trends (with all data), most of the blue regions have actually warmed iirc. We need to find a better figure here that averages over a longer period. Femke Nijsse (talk) 09:48, 21 September 2019 (UTC)

.png)
- I've simplified the heat map's caption to remove the incorrect implication. Wikimedia Commons doesn't seem to have a recent heat map in Categories Climate_change_diagrams or Climate_change or Climate_diagrams or Global_warming_graphs or Global_warming_diagrams etc. . . . I plan to search NASA.gov etc. since a heat map (especially a GIF or movie) conveys more than the existing single line graph. A third graph as you suggested (similar to "Options to reduce GHG emissions..." above), is also a good idea. —RCraig09 (talk) 17:49, 21 September 2019 (UTC) Update: new NASA heat map animation, 1880—2018, has been posted. —RCraig09 (talk) 03:47, 22 September 2019 (UTC)
- Yes, that is precisely the kind of problem that must be dealt with to avoid miscommunication. The original figure had a scale showing the coloration being plus and minus of a certain temperature, but I don't recall if it specified that temperature (the average global temperature over that period?), or why it is the basis. For illustration, consider how a line graph could show the average global trend, and then how the variances, even when the lag behind the trend, are (in most cases?) still increasing. For doing something like this with the warming stripes, you could (e.g.) take the average global temperature (or each region's temperature?) at the start of the period, with blue, and red, and redder showing regions that have gotten cooler, warmer, and much warmer. The caption could say something like "Increases (red) or decreases (blue) in average temperature since ...." ♦ J. Johnson (JJ) (talk) 22:16, 21 September 2019 (UTC)
.png)
- Generating warming stripe diagrams is a non-trivial project (plopping data into a spreadsheet is only the beginning), so I propose avoiding the above problems by replacing the current line chart with the "Rosetta Stone"-ish (composite) chart on the right. The line+stripe graphic avoids the need to explain "baseline" temperature, and avoids "smoothing" (because similarly-colored stripes visually "smooth" the choppy line chart). The original data (from Berkeley Earth) is reliable. —RCraig09 (talk) 03:47, 22 September 2019 (UTC) Make suggested changes to the caption here, rather than the article page. —RCraig09 (talk) 12:21, 22 September 2019 (UTC)
- If it was trivial someone else would have already done it, right? ♦ J. Johnson (JJ) (talk) 20:34, 22 September 2019 (UTC)
- I don't know where publicly available data is, for separate regions/continents, which makes your 22:16, 21 Sept region-related suggestion essentially impossible for me.
- P.S. If I understand the last part of your region-related suggestion correctly, the closest thing to a solution would be the comprehensive color-array graphic that has already been removed from this GW article once (shown at right). —RCraig09 (talk) 02:36, 25 September 2019 (UTC)
- I think you misunderstand. My suggestion is regarding the basis for calculating the variances. Your original graphic (and all subsequent revisions?) appear to calculate the variance (intensity of color) from an average calculated over the entire period, which might be considered a mid-point. (The equivalent line graph might show a horizontal line for this average value.) My suggestion is that the basis be the initial global average temperature. Initially some regions are warmer than that, some are colder. And further on some regions might even show cooling spells that drop them into "blue". But the overall trend would be as seen: red, and redder. ♦ J. Johnson (JJ) (talk) 21:30, 25 September 2019 (UTC)
- There are no warming stripes "rules" per se, but FYI: Ed Hawkins' graphics use a baseline temperature that is an average over a reference period (often 30 years long, e.g., 1951-1980). Temps below the baseline are blue, those above are red; a two-color graphic was probably chosen as being more demonstrative. (This one by RSJones is single-colored.) —RCraig09 (talk) 22:10, 25 September 2019 (UTC)
_Richard_Selwyn_Jones.png)
- I don't understand why should have any data problem, as it is the same data you are already using (right?). Even if it is only the variances, they can still be adjusted to use the initial global average as the basis. ♦ J. Johnson (JJ) (talk) 21:30, 25 September 2019 (UTC)
- The comprehensive color array(196 countries x 118 years = 23,128 data points) was made by Ed Hawkins, not by me. I've laboriously made some simpler warming stripes diagrams, like the one with yellow dots, above. —RCraig09 (talk) 22:10, 25 September 2019 (UTC)
- Ah, I see. I thought you were cranking these out yourself, and had a broad range of options. ♦ J. Johnson (JJ) (talk) 22:41, 25 September 2019 (UTC)
- The comprehensive color array(196 countries x 118 years = 23,128 data points) was made by Ed Hawkins, not by me. I've laboriously made some simpler warming stripes diagrams, like the one with yellow dots, above. —RCraig09 (talk) 22:10, 25 September 2019 (UTC)
- I don't understand why should have any data problem, as it is the same data you are already using (right?). Even if it is only the variances, they can still be adjusted to use the initial global average as the basis. ♦ J. Johnson (JJ) (talk) 21:30, 25 September 2019 (UTC)
Subsection: Figures near top of article
- — I think that to make the public understand the basics of global warming, we should provide, grouped together, a set of three successive line charts of temperature that would provide all-important context for recent temperature increases:
- 1. A temperature graph like the one in this 800,000 year NASA chart, or this NOAA chart], or this EPA chart or similar,
- 2. Milena's 2,000 year chart File:Temperature reconstruction last two millennia.svg), presently in the "Observed temperature changes" section,
- 3. The current 1880-2018 line chart File:Global Temperature Anomaly.svg, also shown a few inches above.
- — The trio could go either at the top, or where Milena's 2,000 year chart is in the "Observed temperature changes" section.
- — If the trio goes in the "Observed temperature changes" section, then the above composite linechart/warming stripe graphic File:20190705 Warming stripes BEHIND line graph - Berkeley Earth (world).png, (above, with yellow dots) would be a good color match to the snazzy updated NASA heat map animation at the top.
- — I could combine the three graphics into a single file, also.
- — I'm not married to the details. Your thoughts? Better sources? Suggestions? I'm willing to generate new chart(s), but want to get some consensus, so the work isn't wasted effort. —RCraig09 (talk) 02:32, 25 September 2019 (UTC)
- Confirming I've read, but will reply when I'm actually awake. Barely slept last night :(.
- More awake now! Thanks again for your proposals :). For me, in choosing which graphics to use, I'm primarily concerned with what other comprehensive sources do. My preference is that this page is primarily drawn from scientific sources, with addition of the political and societal aspects from other sources. As such, for scientific figures, I'm looking mostly at what summaries of scientific assessments use in their report. For assessing suitability I've looked at two comprehensive scientific sources, as well as comprehensive sources for science communication:
- A) IPCC AR5 Summary for policymakers Synthesis report
- B) Executive report of National (US) Climate Assessment
- C) NASA's climate site
- D) Met office
- I think that, especially for the lede, we should restrict ourselves to the type of graphs that these sources use, and none of them use figures of paleoclimate to talk about current climate change, except for the CO2 figure. If we were to give those more prominence in our article, we'd give them WP:Undue weight in my opinion. Also, for the 'observed temperature changes (which might become observed climate system changes or smth), one paleofigure is probs sufficient. The 2000 yr graph, I think, is better known in public perception (considering the whole Hockey stick controversy), so I have a slight preference for that one. I do like your NOAA chart as well, but it's almost too smooth and good. I'd expect a weaker correlation, especially since they've not taken the logarithm of the CO2 concentration. (Our theory says temperature change is approximately proportional to log(CO2), not to CO2 itself.). Does that make sense? Femke Nijsse (talk) 18:55, 27 September 2019 (UTC)
- It does seem to make sense. (Perhaps a fool's delusion?)
- Off-hand I can't speak to how the experts approach this. But it seems to me the essential and most central point in all of this is not so much how warm the climate is getting, but how fast it is warming. That is, the unprecedentedly rapid rise of temperature. (Well, except for one Bad Day For Dinosaurs.) And I think a suitable graph of paleo-temperature over some period best illustrates that. So if we have any figures in the lead there should be at least of such figure. ♦ J. Johnson (JJ) (talk) 20:17, 27 September 2019 (UTC)
- Yes, what you say makes sense, Femke Nijsse.
- Sadly(in my opinion) this Wikipedia article focuses on the informal/popular use of the term global warming (rather than its literal interpretation), and(just as sadly) even reliable scientific references also focus mainly on the most recent 150-170 years, avoiding comparisons to earlier (slower) periods of warming.
- After reading your comments (Femke), I can now see how juxtaposing an 800,000-year chart with two shorter-term charts (my suggestion) might raise issues of WP:SYNTHESIS—even though I think readers should see the "recent" (~170 year) warming in that broader context in order to truly understand the overall phenomenon.
- J. Johnson (JJ), I agree completely about showing how fast temps are changing, but the current 150-year warming would be almost invisible on an 800,000-year chart (example), so its main purpose would be to show by juxtaposition with shorter-term charts how fast the globe is warming now.
- Bottom line: I personally favor three juxtaposed charts,(or a combination chart I could make) but I understand that opinion conflicts with how this article has(unfortunately) evolved to surrender to the popular (narrow) definition of the term "global warming".
- Interestingly, Femke's link to the UK Met Office page (here) shows a climate spiral and warming stripes, their designer Ed Hawkins (scientist) being British. —RCraig09 (talk) 21:48, 27 September 2019 (UTC)
- An 800,000-year chart of temperature is not suitable for showing either the amount or rate of current warming. The hockey-stick figure shows these, but doesn't show that this is unprecedented at paleo scale. What we need is a figure showing the rate of change of temperature) in (say) the past 800,000 years. I don't know if anyone has done that. Lacking that, I believe CO2 levels have been used as a millennial-scale proxy. The problem with that is explaining to the generality of readers how that demonstrates "unprecedented". ♦ J. Johnson (JJ) (talk) 23:03, 27 September 2019 (UTC)
- True. For there to exist a paleoclimate rate-of-temperature-change(first derivative, or slope) graph to exist—and I've never seen one—one would need proxies or record-keeping in relatively short time intervals (much less than 150-year intervals, going back ~500,000 years). I don't think Fred Flintstone & Barney Rubble were up to the task! The best we can do is compare different-timespan charts, explain the evidence in words, and hope readers get it. —RCraig09 (talk) 01:10, 28 September 2019 (UTC)
- Well, temperature follows the CO2 levels, and with the removal rate of CO2 being about a thousand years it would seem there's a footprint big enough to catch at millennial scale.
- "Words" is where lot of people stumble, which is why we need good graphics. (A "small matter of graphic design".) Lacking those, the words need very careful attention. After I get the citations shaped up I'd like look into the scientific basis for "unprecedented". Perhaps I'll find a good graphic! ♦ J. Johnson (JJ) (talk) 22:10, 28 September 2019 (UTC)

● Middle chart: Global average temperature was in a cooling trend for thousands of years before fossil fuel based industrialization. Since then, it has increased about a full 1°C—in a time period less than 1/3,000th the width of the top chart.
● Bottom chart: This 1°C increase, commonly called global warming, accelerated since 1980—a period less than 1/20,000th the width of the top chart.
(new version with neutral colors uploaded October 14, 2019)
Hot off the press. After much inspiration and even more perspiration, I boldly propose the figure at right to convey GW within the perspective of geologic time periods. Its graphics and caption are designed to emphasize—in quickly understandable terms—how unusual the current warming is. I think it should replace the current 1880-2018 chart that's at the top of the article. (The animated heat map should stay, so we would show AGW over both time and space.) Let me know your thoughts on the substance. Aside: now that I have the raw data, I can explore rate-of-change over time. —RCraig09 (talk) 22:14, 4 October 2019 (UTC)
- Hmm, I think I like it. [I also moved the figure down so it's next to the current comments.] ♦ J. Johnson (JJ) (talk) 23:24, 4 October 2019 (UTC)
- Thanks for your hard work! Per my previous comment, I don't think we should tackle paleoclimatology more than we do now in an article about current climate change. Could you remove the green background and change the colour of the arrows? To me, they come over as shouty. Femke Nijsse (talk) 09:42, 5 October 2019 (UTC)
- (Two small scientific side-notes for claims about unprecedentedness. Note that the IPCC doesn't say warming is unprecedented over the last 800 000 years. As far as I understand this is partially because we don't have a high enough resolution. If we only have data points 500 years apart, we don't know how fast they were warming. Second one: please don't do OR with taking the rate of warming. Taking the rate of warming from an uncertain time series is actually a COMPLETE FIELD OF SCIENCE because uncertainties propagate in difficult ways. Just taking the difference won't do if you have missing data). Femke Nijsse (talk) 07:17, 5 October 2019 (UTC)
- Thanks for your always-thoughtful responses. You're absolutely correct about resolution; the caption describes time frames and avoids rates of change. The chart shows current (A)GW with the perspective of paleoclimatology. Sources with paleo-charts: NASA, NASA, EPA, NOAA.
- (P.S. I can adjust colors if we agree on content; I purposely used complementary colors for the general audience, but kept the graphs mostly black/white="scientific". Blue=cool, red=warm, purple=red+blue=alternating during paleo.)
- I agree we should not tackle paleclimatology, because the topic of this article is (as should be) the current change of climate. But even though "unprecedented" applies only "
over decades to millennia
", it might be appropriate to show the longer term (800 millennia) background. Or not; I am undecided.
- I agree we should not tackle paleclimatology, because the topic of this article is (as should be) the current change of climate. But even though "unprecedented" applies only "
- RC: There is a problem with scaling, as some of the details are too small to see. (I suspect these charts were designed for a full page display.) I have done a little tweak with
|upright=to get a size slightly larger than the default "thumb" size; you might want to play around with that. ♦ J. Johnson (JJ) (talk) 21:00, 5 October 2019 (UTC)
- RC: There is a problem with scaling, as some of the details are too small to see. (I suspect these charts were designed for a full page display.) I have done a little tweak with
- I'm not "tackling" paleoclimatology; the charts simply put current GW in perspective timewise, unlike the current 1880-2018 basic chart. (P.S. The large white legends and the basic shape of the graphs tell the story; readers can click on image to get details.) —RCraig09 (talk) 22:08, 5 October 2019 (UTC)
- In my browser (YMMV) clicking on the image doesn't make it bigger, because the height already fills the screen. I can make it bigger, but this gets back to the problem of how much work a reader has to do to get the details, especially if they are not familiar with their browser's features. ♦ J. Johnson (JJ) (talk) 23:09, 5 October 2019 (UTC)
- @J. Johnson: Click on the image three consecutive times... it should become full-sized (1500 pixels wide). Let me know if there's still a problem. —RCraig09 (talk) 15:43, 6 October 2019 (UTC)
- Huh? I don't quite know what you mean by three clicks. At first I thought it was browser-specifc behavior (and therefore YMMV). But on trying this from Chromium same result: the size of the image is constrained to fit its height within the browser window. (That is controlled by the WikiMedia Media Viewer.) The only way I have found to get full size is download the image (which takes four clicks in the right spots), and display it locally with my own tools. Nice as these graphs are, there are details unreadable at size presented. Like I said earlier, they appear to have been designed for full-page display. As a comparison, see the map I did at 1976 Tangshan earthquake#Damage: by design it has no text smaller than the surrounding text when displayed at the intended size. While the graphs here are a bit tight at this scale (I think I set
|upright=to 1.2, where 1.3, or even 1.4, might be preferable), the titles and labels do need to be bigger to be readable. ♦ J. Johnson (JJ) (talk) 20:58, 6 October 2019 (UTC)
- Huh? I don't quite know what you mean by three clicks. At first I thought it was browser-specifc behavior (and therefore YMMV). But on trying this from Chromium same result: the size of the image is constrained to fit its height within the browser window. (That is controlled by the WikiMedia Media Viewer.) The only way I have found to get full size is download the image (which takes four clicks in the right spots), and display it locally with my own tools. Nice as these graphs are, there are details unreadable at size presented. Like I said earlier, they appear to have been designed for full-page display. As a comparison, see the map I did at 1976 Tangshan earthquake#Damage: by design it has no text smaller than the surrounding text when displayed at the intended size. While the graphs here are a bit tight at this scale (I think I set
- @Femkemilene: @J. Johnson: Would you agree with a TWO-chart image (with ONLY the 2,000-year and 1880-2018 charts)? That image would essentially replace two images that are already near the top. Joining the two charts in one image provides extremely valuable perspective for current AGW. I see only ONE mention of paleoclimatology in the article and think that all three charts provide the best perspective (links below, to four 800,000 year charts by NASAx2, NOAA, EPA), but joining two charts seems a reasonable compromise here. —RCraig09 (talk) 15:44, 6 October 2019 (UTC)
- Femke: do you have specific suggestions re colo(u)rs? I use NON-gray complementary colors to be "friendlier" for non-scientists. —RCraig09 (talk) 15:44, 6 October 2019 (UTC)
- I agree that somewhere we should provide the broader million-year context, but I think that need not, and likely best not, be in the lead. ♦ J. Johnson (JJ) (talk) 21:00, 6 October 2019 (UTC)
- Providing one two-panel figure for paleocontext is fine with me, but still not entirely convinced that they should be combined. In terms of design: note that colours are meant for drawing the eye to a certain aspect of the graph. That's why you want to have very mute for the background, such as white, black, off-white, off-black. For inspiration, Google infographics (definitely meant for lay audience), to see what they're doing. All of the background (except one ugly one) are mute colours. Femke Nijsse (talk) 08:08, 7 October 2019 (UTC)
Alrighty then! I've (essentially) combined Femke's 2,000-year chart with the existing 1880-2018 chart to show CurrentAGW in perspective. It's gray and black, with blue indicating cool and red indicating warm. I've used simple language in the captions; maybe sourcing would add weight to the captions. I hope you'll all continue to consider that a third (800,000-year) chart would best emphasize how unusual CurrentAGW is, but this compromise is better than nothing. +In view of my not finding an updated free-use causation/attribution chart anywhere, I've also added File:Climate Change Attribution.png to the top. In 2019, attribution/Causation is still critical. —RCraig09 (talk) 20:39, 8 October 2019 (UTC)
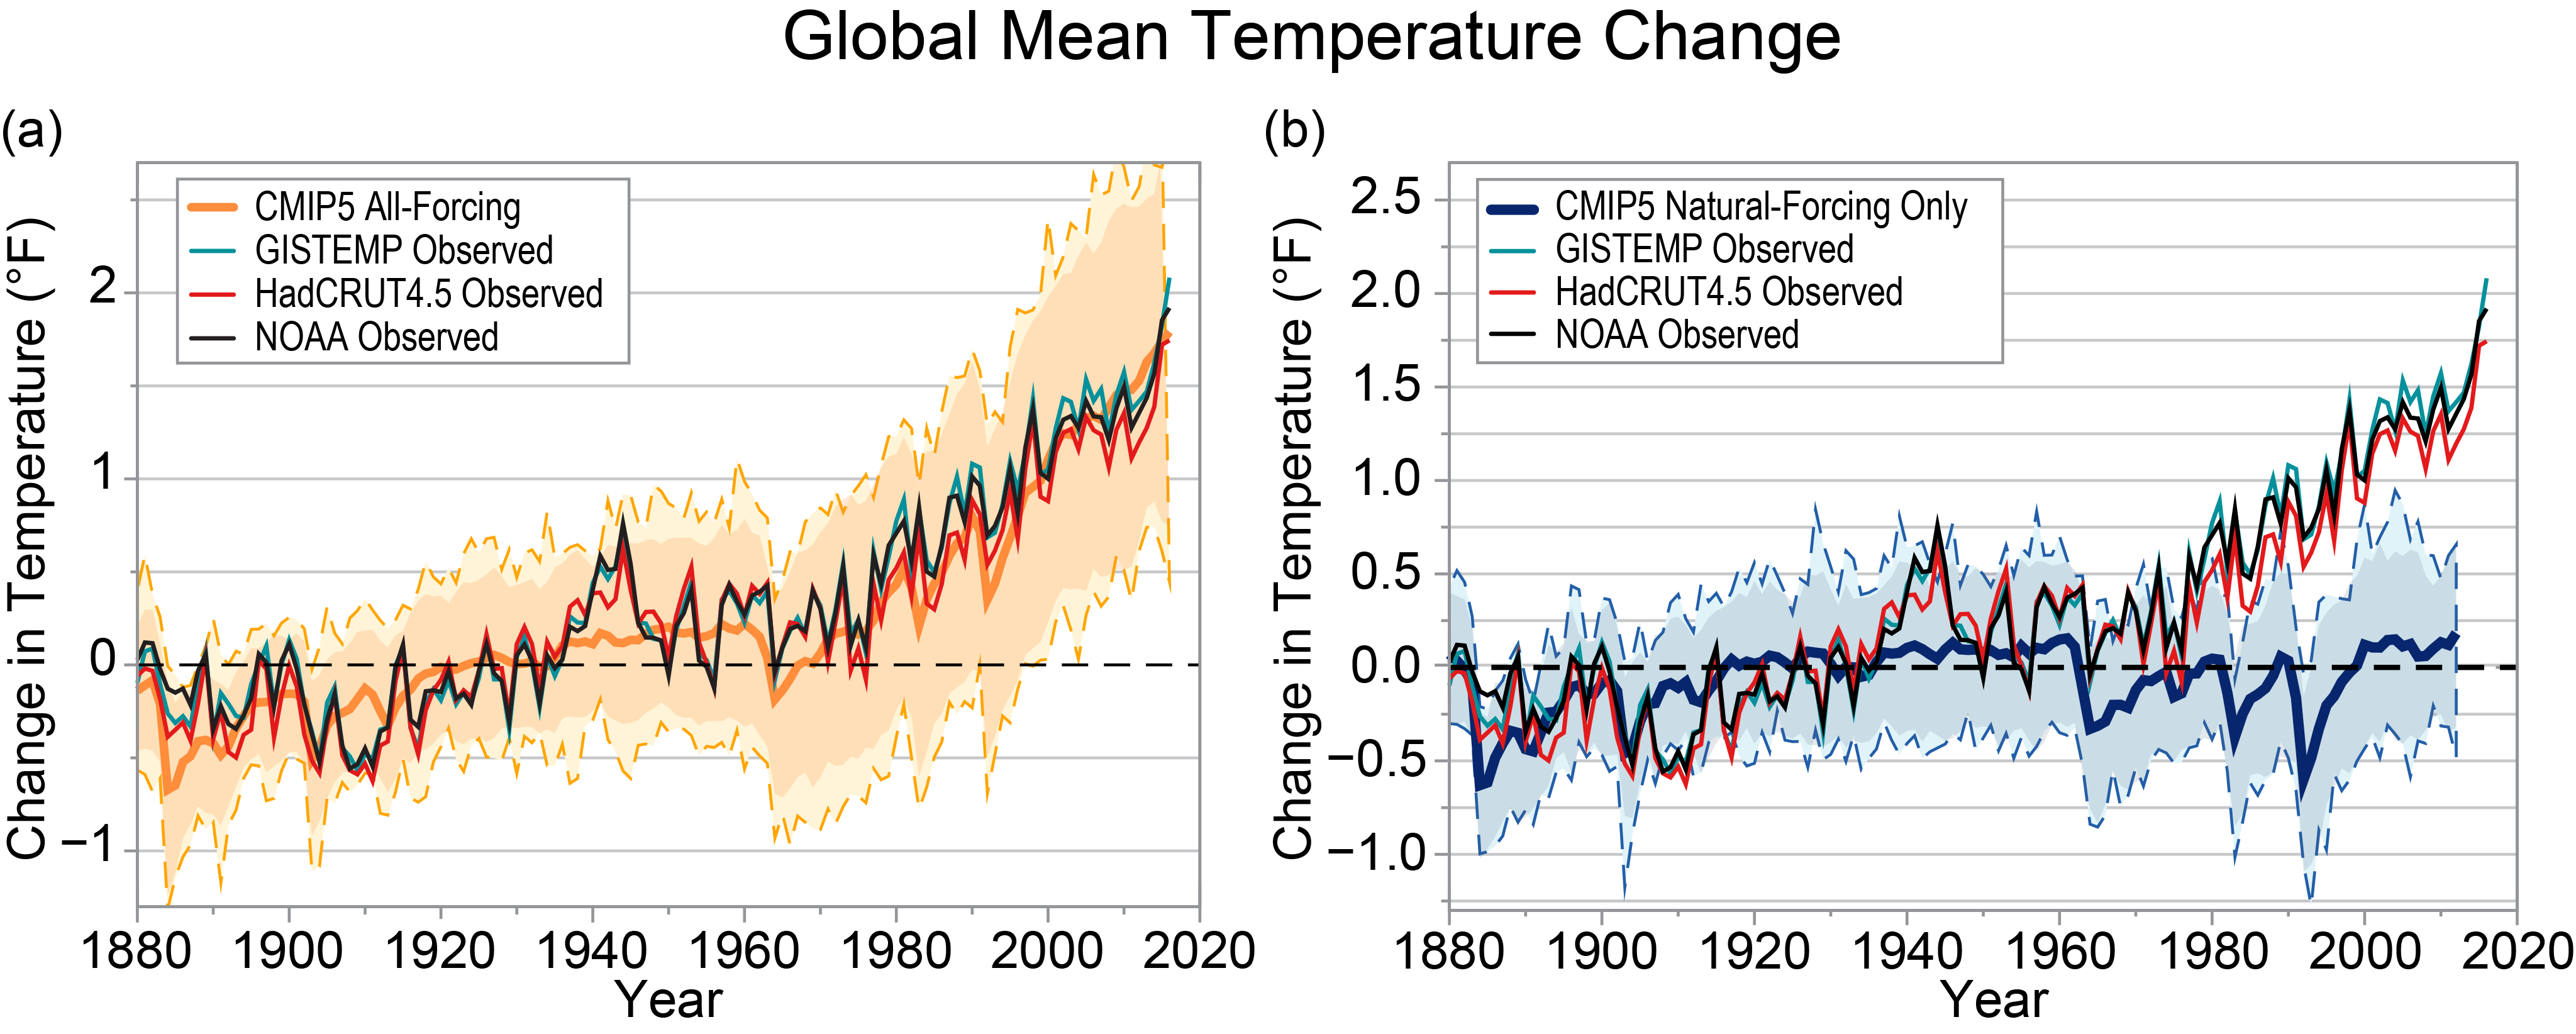
- Attribution charts found. I've just discovered at https://science2017.globalchange.gov/chapter/3/ two "attribution" charts (probably public domain from U.S. government Fourth National Climate Assessment), similar to what I want:
- https://science2017.globalchange.gov/img/figure/figure3_1.png (right side; has clutter)
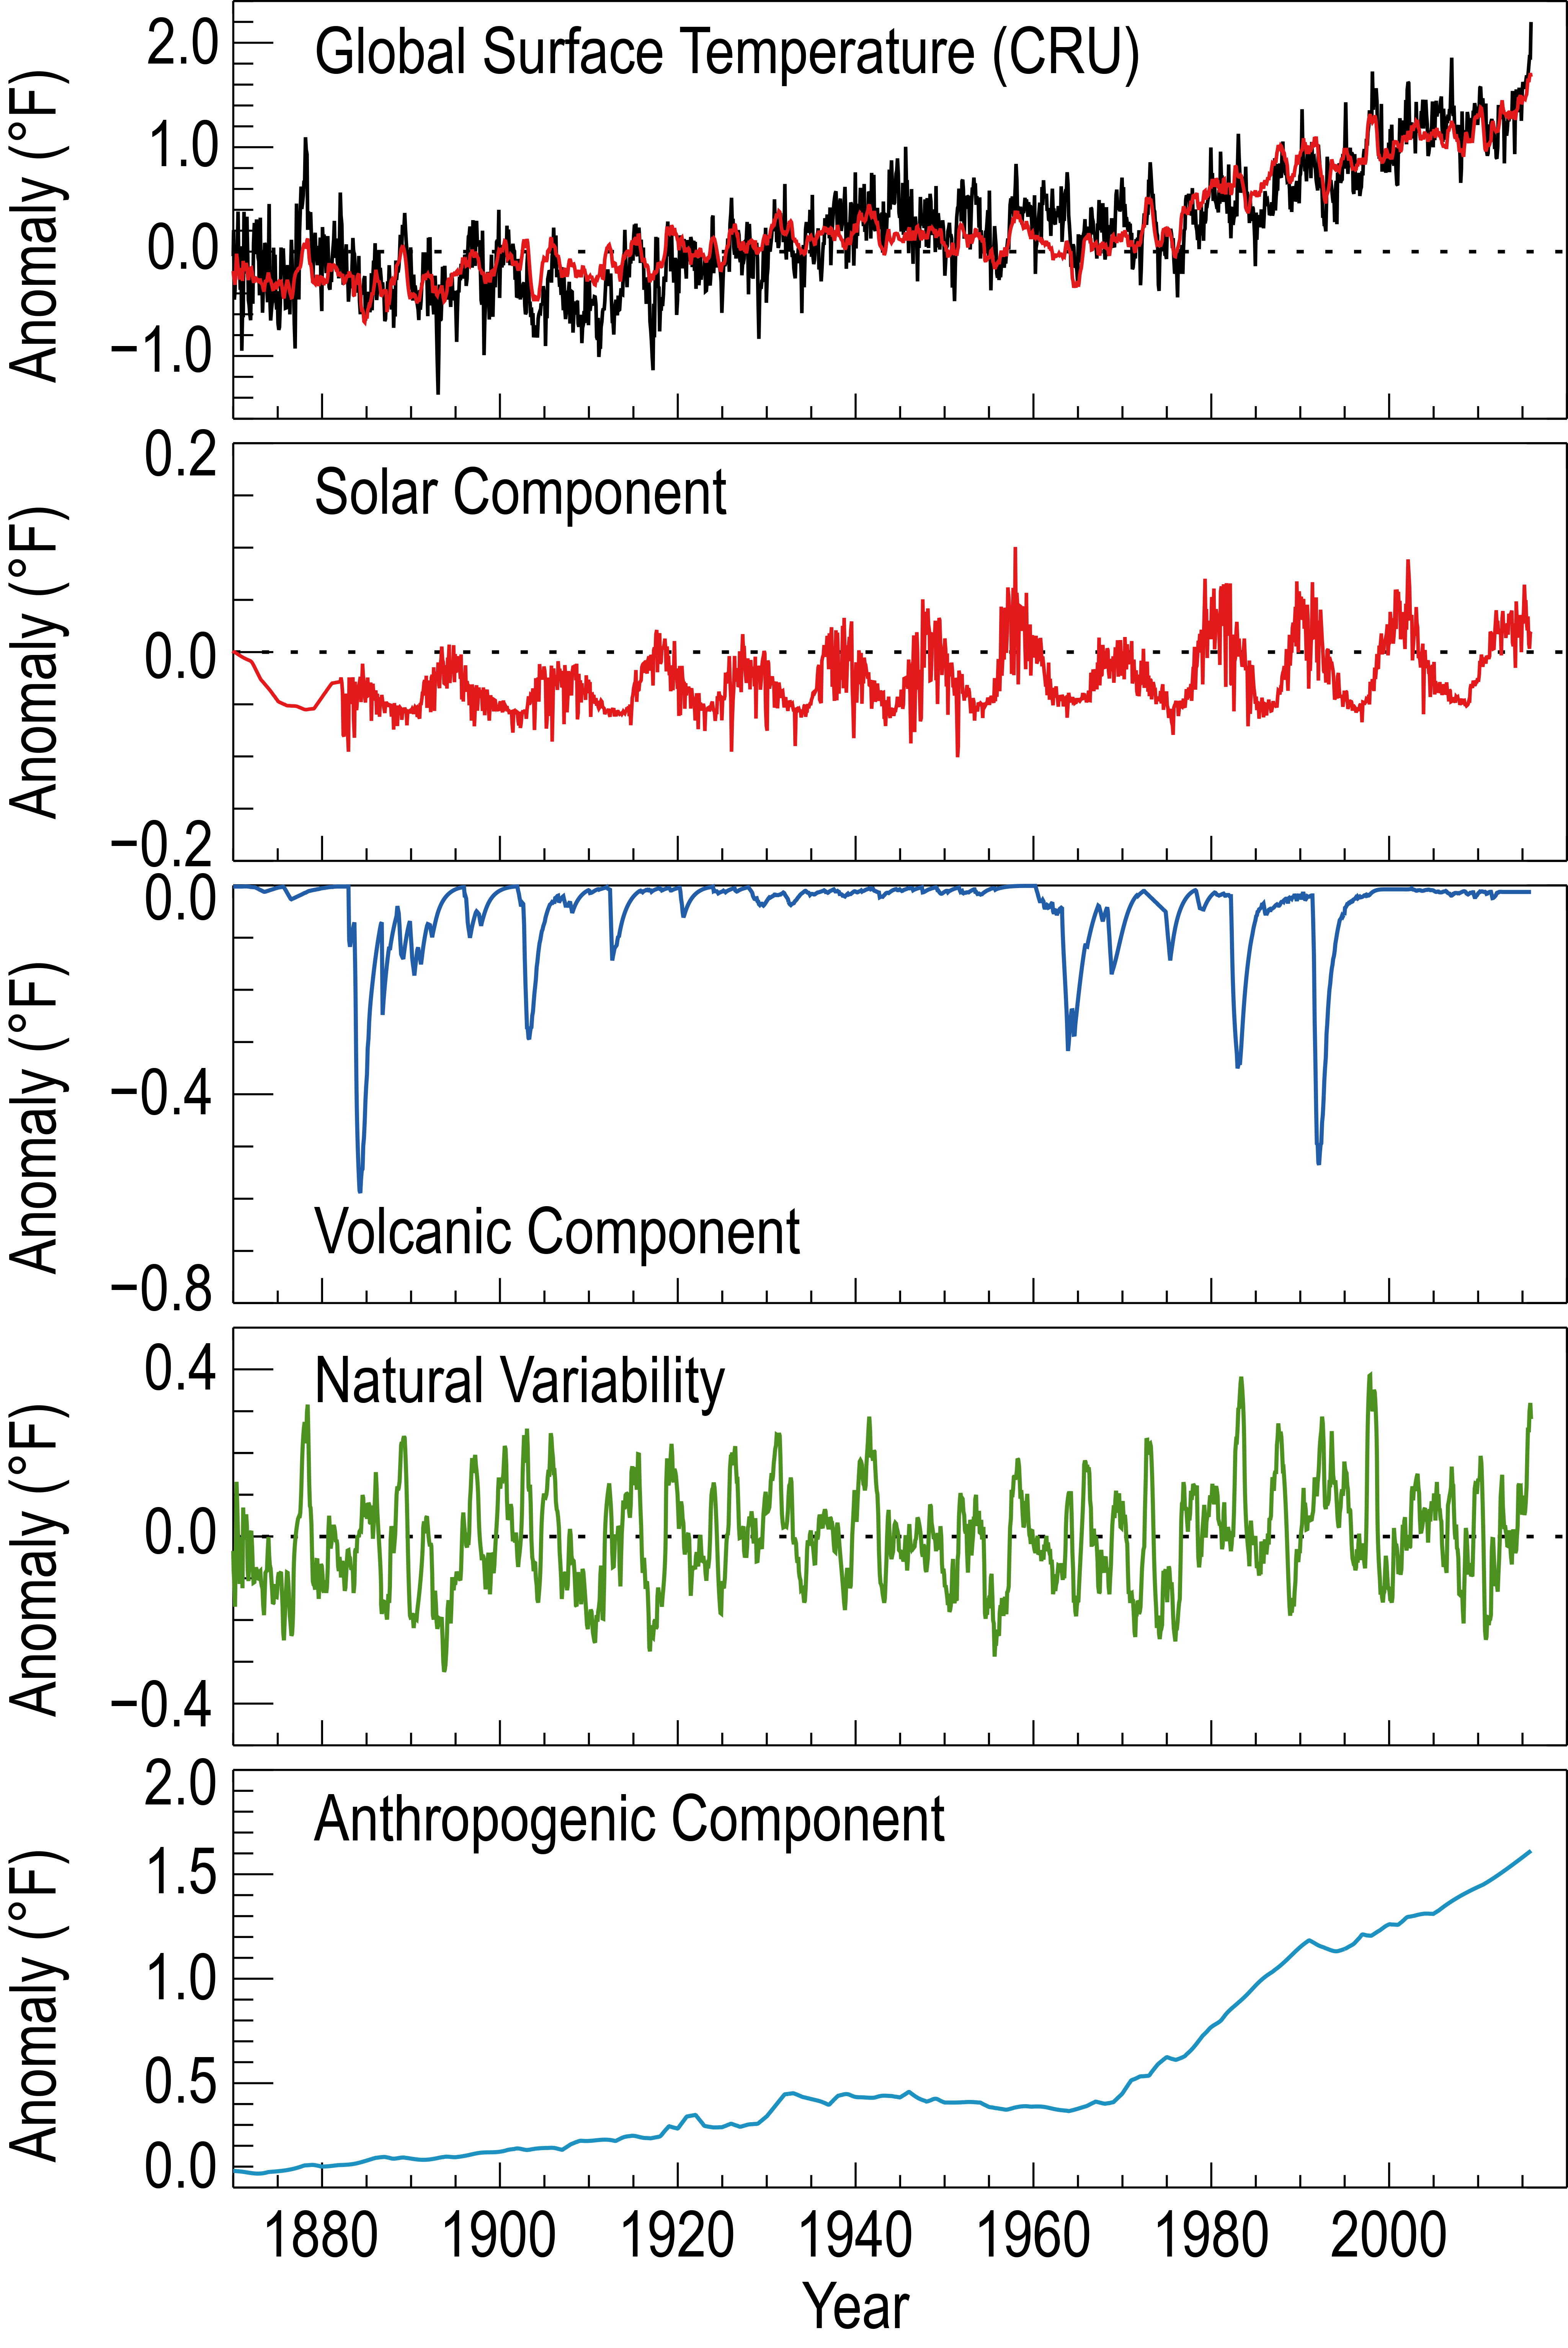
- https://science2017.globalchange.gov/img/figure/figure3_3.png (separate charts take up space)
- I'm considering converting to Wikiacceptability & uploading. Thoughts? —RCraig09 (talk) 22:13, 8 October 2019 (UTC)
- The figure3_3.png stacked charts are rather nice, except for the matter of different scales, that make the contribution due to (e.g.) solar (barely reaches 0.1{{deg} F. once) and natural variability (never reaches 0.4° F.) seem comparable in size to the 1.5° anthropogenic component. Rhode's "Climate Change Attribution" chart is much better. We should definitely use that one, though perhaps it is not the best for the lead. ♦ J. Johnson (JJ) (talk) 23:28, 8 October 2019 (UTC)
- I've asked Robert A Rohde on his user talk page if he knows of any updated charts. Separately, I will take a stab at merging the "stacked" NCA4 graphs into a common vertical scale (won't be trivial in Photoshop). I strongly favor showing attribution/causality in the lead, because the issue is so critical, as shown by the lead's long-existing text. —RCraig09 (talk) 15:44, 9 October 2019 (UTC)
- I agree that the lead should address both aspects (former issues?) of reality and cause. I am not entirely convinced that addressing both in the same figure is best. My experience (more with managers than scientists, and strongly influenced with the KISS principle) is that each figure should address exactly one point. I think Rhode's graph (updated or not) is excellent, and the span appropriate, for comparing contributions. But showing that the current GW is anomalous really needs a longer time span, which suggests a separate figure. Keep in mind the lead is supposed summarize the article, and that addressing these points does not mean a detailed explication, which should be done in the appropriate section. ♦ J. Johnson (JJ) (talk) 19:46, 9 October 2019 (UTC)
- The point of the composite (two-chart) image is to show current AGW in perspective, which is critical; plus, I've blue/red color-coded the two charts. Question: By "...needs a longer time span" were you implying the 800,000-year chart should be introduced (separately) or merged (into a three-chart image) or otherwise? —RCraig09 (talk) 22:08, 9 October 2019 (UTC)
- No, I think the 2,000 year chart is suitable for that. ♦ J. Johnson (JJ) (talk) 23:50, 9 October 2019 (UTC)

- I've used Photoshop to manually adjust the varied vertical (temperature) scales in the NCA4 Vol.I Ch.3 Fig.3.3 (2017), and manually merged them to form the composite attribution chart I just uploaded and inserted into the article (File:2017 Global warming attribution - based on NCA4 Fig 3.3.png) to replace the outdated (1990s) attribution chart. —RCraig09 (talk) 17:50, 12 October 2019 (UTC)
- Very nice. Even better than Rhode's chart. Let's use it. But one little quibble: the subscripts to the labels are too small. Are they really needed? I reckon most readers will understand that the color of label indicates which line. ♦ J. Johnson (JJ) (talk) 20:25, 13 October 2019 (UTC)
- Merci, danke, bedank, tack, grazie & gracias. The red "solar" trace is hard to distinguish from the other traces in which it is entwined, so I added the "(red)" sub-label for it, and added the other "(color)" sub-labels to be consistent. I purposely made the sub-labels smaller for the reason you mentioned: that most people will deduce the traces are color-coded. —RCraig09 (talk) 20:54, 13 October 2019 (UTC)
- New version with only one tiny label — "(red)" for Solar forcing — has been uploaded to Wikimedia Commons. —RCraig09 (talk) 05:14, 14 October 2019 (UTC)
- Very nice. Even better than Rhode's chart. Let's use it. But one little quibble: the subscripts to the labels are too small. Are they really needed? I reckon most readers will understand that the color of label indicates which line. ♦ J. Johnson (JJ) (talk) 20:25, 13 October 2019 (UTC)
Renaming of climate change
There has been a long unease on Wikipedia about the distinction between global warming and climate change. Bold proposals have been put forward, but no consensus was ever obtained for to rename global warming into climate change. I've launched a less bold proposal now: making climate change into a redirect to global warming and renaming that article. With the terminology of current climate change shifting from global warming to climate change, the confusion of our (somewhat arbitrary) distinction between the two terms is becoming larger. Feel free to participate in the discussion at Talk:Climate change#Renaming this article to solve confusion. Femke Nijsse (talk) 20:21, 9 October 2019 (UTC)
- Ah, you have anticipated me. Excellent. I'll start studying this tonight. ♦ J. Johnson (JJ) (talk) 21:01, 9 October 2019 (UTC)
- Discussions of the different options has concluded and a proposal has been put forward to rename to climate change (general concept). The proposal will stay up for at least seven days. Femke Nijsse (talk) 15:09, 18 October 2019 (UTC)
Feasibility of showing temperature rate-of-change: ideas needed!
My goal: To find or create a graph that conveys the present rate of warming (slope of the temperature graph: bottom chart) compared to historical norms or historical extremes (even if not provably "unprecedented").
Background: I used the 800,000-year ice core data (used in the top chart) to study temperature rate-of-change issues. There are >5,800 ice core data points. There are >80 points for the most recent millennium, but only 2, 1 or even 0 data points for some of the oldest millennia. Therefore, to make the chart, I had my spreadsheet average the data points within each millennium to arrive at the 800 points for the top (purple) trace. To estimate millennial-average rate of change, I merely subtracted the (n-1)th value from the nth value; it's like a first derivate/slope.
Findings:
- From bottom chart: the temperature change in the last 50 years is about +0.9°C, which extrapolates to about 18°C per millennium. NOAA says it's 0.17°C/decade --> 17°C/millennium and NASA says 0.15-0.20°C per decade --> 15-20°C/millennium.
- In the ice core data: temperature anomalies relative to most recent millennium's average ranged from -10.58°C to +5.46°C, with millennium-average temperatures rounding the extremes down to -9.8°C to +3.89°C respectively. Therefore, ice age cycles for 800,000 year cover only <17°C between extremes.
- In the ice core data, the temperature difference between some adjacent datapoints extrapolates to -287°C to +260 (12.7°C average absolute value) per millennium!!! As @Femkemilene: described at 07:17, 5 Oct 2019, "uncertainties propagate" from "low resolution" datasets (ones that have substantial gaps).
- The millennium-average rate of change that my spreadsheet calculated, varies from -2.25°C to +3.14°C per millennium (0.54°C/millennium average absolute value).
Conclusion: The current 15-20°C rate per millennium far surpasses the "maximum normal" millennium-average change (≤3.14°C), though it's uncertain if more extreme changes (>3.14°C/millennium) have occurred naturally.
Ideas needed: How can one show the exceptional nature of recent temperature growth? I've seen texts describing the temperature climb, but no really convincing graphics. I've considered simple bar charts showing the above comparisons, but they might approach WP:No original research. Does anyone have comments, critiques, ideas, suggestions, or specific links? —RCraig09 (talk) 20:41, 15 October 2019 (UTC)
- Update: I'm going to experiment with superimposing graphs of global average temperature over various different time frames, onto a common degrees-per-unit-time vertical axis and proportional time axis, so slopes can (hopefully) be compared. —RCraig09 (talk) 23:15, 15 October 2019 (UTC)
- Cool project, but let me reinstate that I'm against including any figures that are not typically found in summary documents about climate change. Femke Nijsse (talk) 08:00, 16 October 2019 (UTC)
- Femke Nijsse, many images here are not taken directly from Global Warming/Climate Change (GW/CC) reliable sources (RS); many are WikiMedia "Own work" (examples: works from Robert Rohde and yourself, or graphs made directly from RS data). Definitely, substantive content should have a basis in GW/CC sources, but is there a Wikipedia policy/guideline that formally states that WP images should also be based on sources' images? —RCraig09 (talk) 22:40, 16 October 2019 (UTC)
- Cool project, but let me reinstate that I'm against including any figures that are not typically found in summary documents about climate change. Femke Nijsse (talk) 08:00, 16 October 2019 (UTC)
- I'm perfectly okay with not taking images directly from sources about climate change RSs. However, I do want the data to be in line with the presentation of the data in RSs. Take as an example the figure about the last 2000 years, or the Hockey stick graph. A variant of this figure is used in many summary documents about climate change. I'm just making a Wikipedia variant of it. If you start computing rate of change of data, you start doing OR in my view. Computing rate of change is difficult if your data is uncertain AND there is autocorrelation in the uncertainty. I'm not aware of any WP guidelines whatsoever specifically about images, so we'll have to rely on WP:OR and WP:COMMONSENSE to decide where the boundary lies. Femke Nijsse (talk) 07:46, 17 October 2019 (UTC)
- I moved the current version of these images down off the top summary level of the article because the top level needs to be understandable at a glance on a smartphone or as a thumbnail on Google and other services. The graphics you are working on (which I think are great) fit perfectly into the section on "Observed temperature changes". That offers an opportunity for more detailed exploration of how current changes vary from the rate of change shown in the geological record.Efbrazil (talk) 17:28, 17 October 2019 (UTC)
- We should distinguish between images generally (including photos), and the somewhat more restricted sense of figures, which includes charts (visual depections of data) and similar kinds of illustrations (such as maps, etc.). I think I have seen some guidance on this somewhere, but it is quite incomplete. A significant problem in using many expert-derived, data-based figures from peer-reviewd materials is that the published version is copyrighted. However, data is not copyrightable, so we are allowed to create similar charts that replicate, and are in accord with, the expert-derived, peer-reviewed original. Beyond that it is quite murky as to what might be OR.
- Femke: are your "summary documents" only the IPCC's explicitly titled "Summary for Policymakers"? Or would you allow a broader scope? Indeed, as the IPCC's oeuvre is entirely secondary (or even tertiary), it is fairly considered a summary of scientific knowledge. While use in a SPM (or similar) suggests high value, I think that should not be a limiting criterion.♦ J. Johnson (JJ) (talk) 20:00, 17 October 2019 (UTC)
- No, every document or website from a highly reliable source will do: the Met Office, NASA, European commission... But not the figure that is on page 1435 of a technical report. We want to communicate what RSs generally communicate to the public and not some obscure angle what we believe is of most scientific interest. Femke Nijsse (talk) 21:51, 17 October 2019 (UTC)
- Thanks for the clarification. Your "technical report" (I presume) refers to the primary literature. And just because something was published doesn't mean the scientific community has accepted it, which is why we are (and should be) somewhat diffident about using such sources. ♦ J. Johnson (JJ) (talk) 23:34, 17 October 2019 (UTC)
- No, every document or website from a highly reliable source will do: the Met Office, NASA, European commission... But not the figure that is on page 1435 of a technical report. We want to communicate what RSs generally communicate to the public and not some obscure angle what we believe is of most scientific interest. Femke Nijsse (talk) 21:51, 17 October 2019 (UTC)
Suggestion: Thanks for all the interest, but to avoid consuming your time, maybe we should wait for me to construct a particular chart—this one will take a couple of days. —RCraig09 (talk) 20:52, 17 October 2019 (UTC)
- I was sort of hoping to prevent you putting effort into this if it doesn't get major support. But it's an interesting exercise and maybe maybe we can use it on a different page. Or maybe you can convince me something like it is being used currently by RS to communicate the science. Femke Nijsse (talk) 21:51, 17 October 2019 (UTC)

Discouraging update (for those interested): As noted above (and consistent with NASA and NOAA), the recent warming rates extrapolate to about 15°C/millennium (recent few decades) or 7°C/millennium (last 140-170 years). However, using the ice-core data sourcing the top chart of File:800,000-, 2,000-, 139-year global average temperature.png, I have since found that, in steep warming segments recovering from the most recent ice age, from ~17,400 to ~14,300 years ago the average rate was 2.4°C/millennium, and for ~12,500 to ~11,700 years ago the average rate was 5.6°C/millennium — not as dramatically different from recent decadal rises, especially considering "recent" rises were over shorter time spans. Plotting the different curves on a common graph is very messy and not very illuminating, so I've given up on that specific project. I have made a nice graph of ice-core-derived temperatures from 20,000 to 10,000 years ago (data points plotted at 20-year intervals; includes the recovery from most recent ice age), which I can upload on the chance it might become useful somewhere, somehow. which I have uploaded (shown at right). If you have thoughts or suggestions, enter them below. Thanks. —RCraig09 (talk) 20:52, 20 October 2019 (UTC) Adding image. —RCraig09 (talk) 06:08, 21 October 2019 (UTC)
- I had hopes for an illustrative rate-of-change graph, but perhaps the data is too messy for that. And while there might be some way of doing that, I would say that you gave it good try, so the odds of that are not great. (Or as I once heard someone tell her kids: no bears under that blanket!) It's not effort lost, as now we know what's not there. Thanks for looking into the possibilities. ♦ J. Johnson (JJ) (talk) 22:02, 22 October 2019 (UTC)
- Thanks, JJ. I want to emphasize that rate-of-change comparisons "can" be made, but the overlapping graphs look like a plate of spaghetti, and, more important, along lines Femke Nijsse has noted, older-era data (example: ice age data points are about 50 years apart) doesn't have the resolution of recent instrumental readings (1 year apart), so it's not possible to confidently compare 1980-2018 A.D. to 11,780-11,818 years ago. In the older-era data, certain adjacent data points imply a >250°C change per millennium (>0.25°C change per year)! —RCraig09 (talk) 22:36, 22 October 2019 (UTC)
Edit notice
I think we are about ready to implement an edit notice that advises editors of the citation standards applicable here. Any suggestions how that should be worded? ♦ J. Johnson (JJ) (talk) 22:56, 20 September 2019 (UTC)
- I'd say something like this might be sufficient: Note that this article has agreed on a set of citation standards. Please follow those or ask help on the talk page when adding any reference. Femke Nijsse (talk) 12:47, 22 September 2019 (UTC)
That might work. I was thinking along the lines of: Per WP:CITEVAR: this article has established citation standards ("style") to which all edits should conform. See Talk:Global warming/Citation standards for details.
I don't want to say "reference" (as that would reinforce a bad usage), but I think a small "<ref>" icon might serve to indicate what this mainly about. I just spent half an hour searching, but couldn't find anything suitable. I may explore this further tonight. Or maybe just do text, with some kind of highlighting. ♦ J. Johnson (JJ) (talk) 20:00, 22 September 2019 (UTC)
I'm not entirely satisfied with either of our formulations, so still hoping for more suggestions or comments. (Edit notices are not as readily changeable as other templates, so it is preferable to try to get this good at the outset.) As a side matter: I haven't found a suitable icon (yet?). I can make one, but have forgotten how get a transparent background in svg format. A background task. ♦ J. Johnson (JJ) (talk) 20:06, 26 September 2019 (UTC)
This might work:
WP:CITEVAR caution: please see this article's established citation standards regarding the addition or modification of citations ("references").
And perhaps with a catchy "<ref>" icon. ♦ J. Johnson (JJ) (talk) 21:50, 6 October 2019 (UTC)
- Caution = poison and downed power lines. How about inspiring the reader to think "These people will appreciate my citation effort even if I make a mistake" instead of making them think "Oh my god, what if I fuck up?" NewsAndEventsGuy (talk) 22:46, 6 October 2019 (UTC)
- HELP!! Editors have done a TON of work to clean up the citations and standardize their formatting. We would be really grateful if you fit your own work into that system. It's not hard; if you need help, just ask! For starters, please read [Talk:Global warming/Citation standards|citation standards]] NewsAndEventsGuy (talk) 22:49, 6 October 2019 (UTC)
- Caution = poison and downed power lines. How about inspiring the reader to think "These people will appreciate my citation effort even if I make a mistake" instead of making them think "Oh my god, what if I fuck up?" NewsAndEventsGuy (talk) 22:46, 6 October 2019 (UTC)
- You're thinking of "danger"; I don't see "caution" as so extreme. But it could also be: "Per WP:CITEREF: ...." And note that it does say "please".
- A general consideration here is to have the most concise effective message, to avoid eating up screen space. While that tends towards brusqueness, what I have proposed is no more brusque than "
Content that violates any copyrights will be deleted
", etc. ♦ J. Johnson (JJ) (talk) 23:35, 6 October 2019 (UTC)
- I agree with the slight modification of removing the word caution. Femke Nijsse (talk) 08:19, 7 October 2019 (UTC)
- @JJ, it's a poor analogy. Copyvio is a legal issue that we are compelled to obey. Cite standards are optional. Being pushy about them is counterproductive to recruiting new editors and cultivating the cooperative culture that makes this more fun. Yours without the caution would be acceptable bu this would be better and use less screenspaceNewsAndEventsGuy (talk) 10:33, 7 October 2019 (UTC)
Working with references? Please help us maintain the agreed citation standards for this page
NewsAndEventsGuy (talk) 10:33, 7 October 2019 (UTC)
- I haven't heard of anyone being electrocuted for copyvio. Even so, "will be deleted" could be stated much more gently. And the following non-legal requirement that "
content must be verifiable
" could also be cast into your "We would be really grateful
" format – but it isn't.
- The problem with the "nice" "
Please help us ...
" approach is that many editors are oblivious to that. As a case in point, just today Cosmicseeds has again added a full citation in a note, despite being previously advised/asked nicely multiple times (here) to not do so. It's fine with me if you want to take on persuading editors to comply, or to clean-up after them when they won't, and the current case would be a fine place to start. But lacking that, I think we need to state a little stronger that consistency with the standards is not 'entirely voluntary on your part and we are fine if you can't be bothered to do so'. ♦ J. Johnson (JJ) (talk) 22:13, 7 October 2019 (UTC)
- NewsAndEventsGuy How about "inspiring" Cosmicseeds to abide with the citation standards? Or to clean up after him? ♦ J. Johnson (JJ) (talk) 21:55, 11 October 2019 (UTC)
- We need a template for flagging petty bickering NewsAndEventsGuy (talk) 21:58, 11 October 2019 (UTC)
- You are being non-responsive. (Do we need a template for that?) I have pointed to a problem, and am asking how you would like to respond. If the matter is too petty for your response I will deal with it as I see fit, and don't bother complaining about that later when you didn't respond now. ♦ J. Johnson (JJ) (talk) 23:59, 12 October 2019 (UTC)
Femke: what do you think about this:
Per WP:CITEVAR: before adding or modifying citations ("references") please see the citation standards established for this article.
Does that work for you? ♦ J. Johnson (JJ) (talk) 23:01, 13 October 2019 (UTC)
- Yes!! The edit notice is in, and everyone editing the article is now advised of the citation standards. Hopefully we won't have to keep cleaning up after editors that weren't aware of them. ♦ J. Johnson (JJ) (talk) 20:39, 28 October 2019 (UTC)
- Great, and despite my pushback on the "vibe" thanks for all the hard work you've put in on it. I do hope others (A) pay attention and then (B) show appreciation by trying to do follow it! On the other hand, I've seen many comments in WP space questioning how well people pay attention to edit notices, and especially new people. So I'm doubtful this will erradicate the disease. Did you (we?) already discuss a supplemental DONTBITE instructional template for user talk, when the inevitable good faith editor doesn't pay attention and does things the old fashioned way? NewsAndEventsGuy (talk) 21:21, 28 October 2019 (UTC)
Current citation work (October, 2019)
The citations for SRCCL (Climate Change and Land) are now available at WP:IPCC_citation/SR. As before these are for the "FINAL DRAFT" versions, which are still subject to "trickleback" and copy-editng, and of course the pagination won't be done until all that is finished. The author and editor lists are also yet to be finalized. When all that is finished and published I will update those citations.
I am about tackle implementation of the edit notice. I am also working on getting our missing "In"s in (there's a bit of resistance). ♦ J. Johnson (JJ) (talk) 22:32, 13 October 2019 (UTC)
And there's a new ![]() icon. ♦ J. Johnson (JJ) (talk) 20:48, 14 October 2019 (UTC)
icon. ♦ J. Johnson (JJ) (talk) 20:48, 14 October 2019 (UTC)
- Great, thanks :). Bonus civility is always a way to decrease resistance. Femke Nijsse (talk) 08:06, 16 October 2019 (UTC)
- Glad you like it.
- Another way of reducing resistance is to just boldly do stuff, without asking for input. But do take a look at what I think is the "keeper" text at #Edit notice. ♦ J. Johnson (JJ) (talk) 19:57, 16 October 2019 (UTC)
Several months ago I had hoped to be done with the bulk of the citation work by now. But alas, it's not. (For the benefit of anyone looking back at this: we've all been largely occupied regarding the rename of "Climate change" to Climate change (general concept).) So, the work will continue into November. Eventually it will be substantially done. ♦ J. Johnson (JJ) (talk) 22:05, 31 October 2019 (UTC)
Foote note
As discussed at #Peer review? above, I've rewritten the Global warming#History of the science section to show context, and avoid undue weight to false claims that the greenhouse effect was "discovered in 1856 by Eunice Newton Foote". Her research got very little attention until a 2011 paper proposed that other scientists had conspired to hide her research. As more recent sources show, her 1856 experiments used [glass] cylinders filled with different gases heated by sunlight, an apparatus which could not distinguish the infrared greenhouse effect. There's no evidence she was noticed by subsequent researchers, so even debunking the claim gives her attention which has to be balanced by showing at least some of those who are known to have influenced the science. At the same time, because sexism, it's worthy to give her a mention, so I've worked on that basis. Sources still to be added to match the citations, in particular Huddleston, Amara (17 July 2019). "Happy 200th birthday to Eunice Foote, hidden climate science pioneer". NOAA Climate.gov. Retrieved 8 October 2019., Calel, Raphael (19 February 2014). "The Founding Fathers v. The Climate Change Skeptics". The Public Domain Review. Retrieved 16 September 2019. {{cite web}}: Invalid |ref=harv (help) and Fleming, James Rodger (1998). Historical Perspectives on Climate Change. Oxford University Press. ISBN 978-0-19-507870-1. {{cite book}}: Invalid |ref=harv (help) . . . dave souza, talk 11:20, 11 October 2019 (UTC) (note: references now added. . . 19:43, 11 October 2019 (UTC))
- Thank you for taking such a skillful interest in a needed area NewsAndEventsGuy (talk) 12:23, 11 October 2019 (UTC)
- Thanks! Difficult to condense, so hope have struck a reasonable balance. . . dave souza, talk 19:43, 11 October 2019 (UTC)
- Likewise. And I love the header. ♦ J. Johnson (JJ) (talk) 21:26, 11 October 2019 (UTC)
- Thanks. Good flow, perfect sourcing, interesting. BUT.. I feel is highly disproportianate in terms of length. If you compare it to the section on adaptation to climate change, the section on the climate movement, the section on the effect on the biosphere, all section that are at least as important in my opinion, it does not work. To decide what is due weight to a given perspective, I try (which is difficult) to find some 10-page summary of the entire topic by another source. Many of the sources you've added were not general sources, but specialist sources on the history of science. I'm sure general sources don't have Adolphe Brongniart, de Saussure and all those other people. I've been thinking of removing ALL names out of the section, just rough time periods and when the different lines of evidence were first discovered, but maybe that is too drastic. With the expansion of this section, we're over the 'arbitrary' prose size of 50,000 indicating that the article might be on the long size. A long article per se is not a bad thing when discussing climate change, but I think we should be extra sharp on the WP:SUMMARY style when we are above this threshold. My ideal section length would be about 1/6th to 1/3th of the current section. Femke Nijsse (talk) 18:48, 13 October 2019 (UTC)
- Fair enough, tend to agree and hope we can cover the main thread more concisely: Adolphe Brongniart is useful context for Foote, but rather think she can be dealt with in a footnote. For the greenhouse effect, de Saussure provided the (hotbox rather than greenhouse) analogy for Fourier, whose work was central at that phase. Think it's good to note the Greek origins and the 17th century ideas, otherwise readers may think everyone before the 19th century thought climate was fixed as created. Will treat the current version as a resource, which will feed into other articles. . . dave souza, talk 19:45, 13 October 2019 (UTC)
- Sounds good. ♦ J. Johnson (JJ) (talk) 20:01, 13 October 2019 (UTC)
- Fair enough, tend to agree and hope we can cover the main thread more concisely: Adolphe Brongniart is useful context for Foote, but rather think she can be dealt with in a footnote. For the greenhouse effect, de Saussure provided the (hotbox rather than greenhouse) analogy for Fourier, whose work was central at that phase. Think it's good to note the Greek origins and the 17th century ideas, otherwise readers may think everyone before the 19th century thought climate was fixed as created. Will treat the current version as a resource, which will feed into other articles. . . dave souza, talk 19:45, 13 October 2019 (UTC)
- Thanks. Good flow, perfect sourcing, interesting. BUT.. I feel is highly disproportianate in terms of length. If you compare it to the section on adaptation to climate change, the section on the climate movement, the section on the effect on the biosphere, all section that are at least as important in my opinion, it does not work. To decide what is due weight to a given perspective, I try (which is difficult) to find some 10-page summary of the entire topic by another source. Many of the sources you've added were not general sources, but specialist sources on the history of science. I'm sure general sources don't have Adolphe Brongniart, de Saussure and all those other people. I've been thinking of removing ALL names out of the section, just rough time periods and when the different lines of evidence were first discovered, but maybe that is too drastic. With the expansion of this section, we're over the 'arbitrary' prose size of 50,000 indicating that the article might be on the long size. A long article per se is not a bad thing when discussing climate change, but I think we should be extra sharp on the WP:SUMMARY style when we are above this threshold. My ideal section length would be about 1/6th to 1/3th of the current section. Femke Nijsse (talk) 18:48, 13 October 2019 (UTC)
@Dave souza: When do you reckon you have time to do this? Parallel to the naming discussion, I'd like to do the final touches in preparation for a long-postponed review. Imo, this is the only section in need of a big overhaul still. You might want to consider copying some of it to CC(GenCon), as it also touched upon other causes of change. Femke Nijsse (talk) 15:36, 8 November 2019 (UTC)
- Hi, was diverted by the redirect / article naming issue, and have been struggling a bit for time, but have started off-wiki and hope to get something done by the start of next week. . dave souza, talk 08:12, 12 November 2019 (UTC)

- Done! See Global warming#History of the science for current version, much trimmed. Doubtless further improvements can be made. Next up, I'll aim to put appropriate detail into a new article on de Saussure's 1774 apparatus which measured heat from the sun, then the main history article needs revision. One urgent task which I don't have software to do: File:Macrobian climatic zones.gif needs redrawn as a SVG file, see info on the image page. . . dave souza, talk 20:44, 17 November 2019 (UTC)
Current citation work (November, 2019)
The way I have set up the IPCC citations has one little anomaly: because the editors of the work (i.e., the WG report) are not cited at the level of the chapter, the cs1|2 software omits the "in:" that signals that the chapter is part of a larger work. There is a simple way to fix that, which I have requested. But one editor does not like it, so has refused to make that change. I have worked long and hard to convince him, but no way. At this point matters are at a stand-off, and my request will just wither away unless others join in. So I put to everyone here that might want to make this article as good as possible: are the IPCC citations currently "good enough" without the normal and expected "in:"? Alternately, would any one join me in pushing for this fix? I think two or three additional voices might be enough to carry matter through. ♦ J. Johnson (JJ) (talk) 23:04, 20 November 2019 (UTC)
- Sorry, don't have the expertise, nor time for this. Femke Nijsse (talk) 19:16, 2 December 2019 (UTC)
- I don't really have the time for this, either, but I think it is necessary. The basic "expertise" needed would be: in your experience as a "consumer" of citations, is including "in:" important, or not? ♦ J. Johnson (JJ) (talk) 01:06, 3 December 2019 (UTC)
Citation standards reminder?
@François Robere and Cosmicseeds: in your recent edits did you two perhaps forget about our agreed upon Talk:Global_warming/Citation_standards? ♦ J. Johnson (JJ) (talk) 22:14, 29 November 2019 (UTC)
@Femkemilene: Re your last edit: are we abandoning our citation standards? If you won't set a good example how can we get anyone else to follow them? ♦ J. Johnson (JJ) (talk) 23:50, 8 December 2019 (UTC)
- No, just adding them in small steps, currently busy with life and work. If you have energy/time, please put in into the standard again. (I am regretting the complicated scheme we agreed on, but there's no turning back). Femke Nijsse (talk) 18:48, 9 December 2019 (UTC)
- I think the only complicated part is setting
|ref=, and only for periodicals. (The IPCC cites are prepackaged (just copy), and for the rest just set|ref=harv.) But the important part is setting a good example, and if experienced editors like you and I don't can't be bothered with this then no one else will, and we might as well get used to crappy citations. Which rather undercuts trying for FA. ♦ J. Johnson (JJ) (talk) 23:45, 9 December 2019 (UTC)
- I think the only complicated part is setting
- For many of our colleagues, it requires them to (a) fail trying with the visual editor (b) learn source editing first (c) and only then having to figure out how our source editing is different from the normal (in your words sloppy?) way of referencing. I regret having put that burden on our co-editors, but I will abide by our standards. Please don't complain if I do it in small steps, first adding the sentence and later switching to source editing, I am but human with limited energy. I don't think we're in any danger of losing our FA and I've never noticed people at TFA complaining about references, except for when there's dead links in them. Femke Nijsse (talk) 17:16, 10 December 2019 (UTC)
- I know. Thank you. As to Visual Editor: yeah, well, there are reasons many of us dislike it, one of them being that it's part of the problem of why citation practice on WP is so difficult. I strongly recommend not using VE. ♦ J. Johnson (JJ) (talk) 21:19, 10 December 2019 (UTC)
Proposed changes to land use subtopic
Dtetta (talk) 13:16, 30 November 2019 (UTC)I wanted to propose the following changes to the “Physical drivers of recent climate change” > “Land use change” sub topic. I’m trying to get the following ideas communicated by the edits I propose: 1)describe the current global patterns of land use, and the principal land-use changes that are driving the biogeochemical and biophysical processes leading to global warming, 2)clarify how these land use changes affect both global and regional/local conditions, and 3)provide a brief segue to the subsequent subtopic on land use related feedbacks. I realize this new text is more extensive than the paragraph it would replace, and I have attempted to maintain some of the original text from that paragraph where I was able to. I think the significant issues and nuances of this topic merit this additional context and explanation. Apologies to the original contributors for the significant revisions that I’m proposing.
I wasn't certain the extent to which I should follow the citation standards in this talk discussion, so I have simply listed the url for citations I would be using in this proposed text. I would of course follow those standards when actually editing the article.
Below is the proposed text.
Land Use
Today habitable land occupies 71% of the total land surface; land features such as glaciers and deserts constitute the remainder. Agriculture takes up 50% of the world’s habitable land, while 37% is forests.https://ourworldindata.org/land-use As mentioned in the greenhouse gas subtopic above, deforestation is the most significant aspect of land use affecting global warming. Current assessments of deforestation/forest cover changes vary widely; some note a significant decrease in the rate of deforestation https://pdfs.semanticscholar.org/e026/3e7189cbc7dc9598cf473fc77add52c15965.pdf > Page 11, even a net forest cover increase in recent years https://phys.org/news/2018-08-global-forest-loss-years-offset.html, while others emphasize a continued and significant rate of forest destruction https://www.sustainabilityconsortium.org/2018/09/one-fourth-of-global-forest-loss-permanent-deforestation-is-not-slowing-down/. The main drivers of global forest loss are: deforestation through permanent land use change for commodity production (27%), forestry (26%), shifting agriculture (24%), and wildfire (23%). Of these, commodity production is most strongly associated with permanent forest loss. https://science.sciencemag.org/content/361/6407/1108/tab-figures-data https://www.wri.org/blog/2018/09/when-tree-falls-it-deforestation
Land use changes such as forest loss affects global warming in a variety of ways. In addition to its role as a source of GHG emissions (described in the previous Greenhouse gases subtopic), current global land use conditions act as a net carbon sink for CO2, resulting in an estimated removal of 11-12 billion tonnes annually. “https://www.ipcc.ch/site/assets/uploads/2019/08/4.-SPM_Approved_Microsite_FINAL.pdf > Page 9” Soil processes and photosynthesis are the principal means through which this carbon sink functions on land.
Land use also affects global warming through a variety of biophysical dynamics. Changing the type of vegetation in a region impacts temperature by changing how much sunlight gets reflected back into space, called albedo, and how much heat is lost by evaporation. For instance, the change from a dark forest to grassland makes the surface lighter, causing it to reflect more sunlight. Deforestation can also contribute to warming or cooling by affecting the release of aerosols and biogenic volatile organic compounds, which can affect cloud formation; and changing the roughness of Earth’s surface, which can affect wind speed. https://www.wri.org/blog/2019/08/forests-ipcc-special-report-land-use-7-things-know These biophysical effects operate both globally and locally. Globally, they are estimated to have led to a slight cooling, dominated by an increase in surface albedo. https://www.ipcc.ch/site/assets/uploads/2019/08/2c.-Chapter-2_FINAL.pdf Page 2-54. Regional/local effects are more variable; in high-latitude boreal regions, the net effect of deforestation is cooling, because the albedo effect dominates—snow cover reflects sunlight; tree cover absorbs it. In temperate zones, forest loss generally causes warming, although the effect is more variable. Deforestation in the tropics clearly leads to warming, with biophysical effects amplifying already-significant emissions effects. https://www.wri.org/blog/2019/08/forests-ipcc-special-report-land-use-7-things-know
Land use change effects on global warming also have a seasonal component. In temperate regions for example, deforestation leads to summer warming and winter cooling.  https://www.ipcc.ch/site/assets/uploads/2019/08/2c.-Chapter-2_FINAL.pdf Page 2-63
Global warming itself produces land cover and land-use changes, which in turn affect the biogeochemical and biophysical effects described above. These feedback effects are discussed in the Climate change feedback topic below. Dtetta (talk) 13:16, 30 November 2019 (UTC)
- Thanks for joining us. It appears you are a brand new user, so you need to get up to speed on various standards, practices, etc. in the Wikipedia environment. I'll add some links to your Talk page you should check out. Note that we through around a lot of acronyms, generally "wikilinked", with which you should become familiar. E.g. click on WP:TPG to find out about Talk Page Guidelines.
- Citation on Wikipedia tends to be more tangled and confused than necessary, so you may want to proceed with care. But is a key element of editing, so you should proceed. You might find it convenient to copy this text to your "sandbox" and work on it there, particularly with the citations. Do ask if you have questions (here, on your talk page, or come to my talk page).
- On this particular suggestion: I'm not certain if it going to get a lot of attention. You may have noted we're having a long-running (well, sometimes we run :-) discussion on the proper name for this article, so that is taking most of the energy. Feel free to join that discussion, but perhaps read WP:TPG first. ♦ J. Johnson (JJ) (talk) 22:19, 30 November 2019 (UTC)
- Thanks for your suggestion. Firstly, don't feel obliged at all to delve into the talk page guidelines, you're doing exactly what you're supposed to do here. I think I wrote the original and I'm not that much of an expert on land-use change, so there is probably something that can be improved. Note that it's not only land use change that is covered in a WP:SUMMARY style, but the rest of the article as well. The article is already quite long, and the global net effect of LUC not that big, so to me the amount of space dedicated to this section is roughly right. Another thing to keep in mind is the audience. We've been trying to make this article mostly understandable to 16-yr olds, as it's likely they will read this article as well. The word biophysical might be on the difficult side for that audience.
- Would you be willing to make a less drastic proposal that is closer in size to what's already there? (And echoing J. Johnson, you might want to leave a comment on the naming discussion that we find ourselves busy with) Femke Nijsse (talk) 08:40, 2 December 2019 (UTC)
Thanks for that suggestions. I’ve made some revisions to this original proposal, and wanted to present it to people for consideration using an underline/strikeout approach; underline shows proposed additions while strikeout shows proposed deletions. Reasons for the proposed changes are in italics. You can see how these changes look with all of the citations and references at: User:Dtetta/GlobalWarming-Land-use-change. One change/addition I did not make was to include a couple of sentences about how future population and economic pressures will affect future land-use conditions, and in turn the effect of that on global warming. I think this would be an important addition to round out the subtopic, but for brevity’s sake I decided not to attempt that with these edits.
I realize all this makes the article longer than is being suggested, and I did make a few modifications aimed at brevity and simplicity of language. I guess another way of looking at it is that issues around restorative agriculture and reforestation are going to be a critical part of many countries' commitments in areas like NetZero, so this topic will help support readers who want some background for those issues. Two areas I think I could trim this would be to: 1) eliminate the sentences dealing with rates and causes of deforestation, and 2)eliminate the last two sentences dealing with seasonal/temporal aspects of land use caused global warming. But I thought I would show the complete set of changes with their justification, and then see what people thought. In terms of relative coverage, I do think this deserves as much text as the aerosols and soot subtopic immediately below it, but I admit I am not an expert in either of these areas.
Thanks for your attention to this, I realize you are working on a lot of other things as well.
Humans change the land surface mainly to create more agricultural land.[1]Today habitable land occupies 71% of the total land surface; land features such as glaciers and deserts constitute the remainder. Agriculture takes up 50% of the world’s habitable land, while 37% is forests.[2] Deforestation is the most significant aspect of land use change affecting global warming. Current assessments of deforestation/forest cover changes vary; some highlight a recent decrease in the rate of deforestation, [3] while others emphasize a continued and significant rate of forest destruction. [4]The main drivers of global forest loss are: deforestation through permanent land use change for commodity production (27%), forestry (26%), shifting agriculture (24%), and wildfire (23%). Of these, commodity production is most strongly associated with permanent forest loss.[5] This paragraph was added to introduce current global patterns of land use and land use change, which are important in giving context to how land-use change is affecting Global Warming .
Land use changes such as forest loss affect global warming in a variety of ways. While some cause significant GHG emissions (described above), current global land use conditions also act as a carbon sink for CO2, resulting in an estimated removal of 11-12 billion tonnes annually. [6] Soil processes and photosynthesis are the principal means through which this carbon sink functions on land.This was added to highlight the fact that land use conditions act as a sink as well as a source of GHGs.
In addition to contributing to GHG emissions, lLand use changes also affect global warming through a variety of other chemical and physical dynamics. Changing the type of vegetation in a region impacts temperature by changing how much sunlight gets reflected back into space, called albedo, and how much heat is lost by evaporation. For instance, the change from a dark forest to grassland makes the surface lighter, causing it to reflect more sunlight. Deforestation can also contribute to warming or cooling by affecting the release of aerosols and biogenic volatile organic compounds, which can affect cloud formation; and by changing the roughness of the land surface, which can affect wind speed.[7] Although albedo and evapotranspiration are more significant, this sentence was added to provide a more complete description of the range of biogeochemical and biophysical effects. Since the pre-industrial era, albedo has increased due to land use change, which has a cooling effect on the planet. Other processes linked to land use change however have had the opposite effect, so that the net effect remains unclear.[8]Globally, these effects are estimated to have led to a slight cooling, dominated by an increase in surface albedo. [9] Regional/local effects are more variable; in high-latitude boreal regions, the net effect of deforestation is cooling. In temperate latitudes, forest loss generally causes warming, although the effect is variable. Models show a clear warming effect from tropical deforestation. [10] Land use change effects on global warming can also have a seasonal component. In temperate regions, for example, deforestation leads to summer warming and winter cooling.[11] These three sentences replace the one immediately before in order to provide more updated information along with regional and temporal specifics.
I'll end by saying thanks to J.Johnson, who spent a lot of time helping me with this, particularly in terms of getting the cites and references properly formatted.Dtetta (talk) 00:07, 14 December 2019 (UTC)
- Something we didn't get to before: when ever you create notes – the "<ref>" constructs – on a talk page you need to also add "{{reflist-talk}}" at the bottom of the section (as I have done here) to catch those notes. Otherwise they go to the bottom of the page, or in a reflist somewhere else, which can be very confusing when the seem to pop up out of nowhere in a different section. ♦ J. Johnson (JJ) (talk) 00:34, 14 December 2019 (UTC)
Sources
- ^ Duveiller, Hooker & Cescatti 2018.
- ^ Ritchie & Roser 2018.
- ^ UN FAO 2016, p. 3.
- ^ TSC Webmaster 2018.
- ^ Curtis et al. 2018.
- ^ IPCC SRCCL DRAFT Summary for Policymakers 2019, p. 7: The natural response of land to human-induced environmental change caused a net sink of around 11.2 GtCO2 yr-1 during 2007-2016 (equivalent to 29% of total CO2 emissions) (medium confidence)
- ^ Seymour & Gibbs 2019.
- ^ Andrews et al. 2016; IPCC AR5 WG1 Technical Summary 2013.
- ^ IPCC SRCCL DRAFT 2019, p. 2-54:The global biophysical cooling alone has been estimated by a larger range of climate models and is -0.10 ± 0.14°C; it ranges from - 0.57°C to +0.06°C .........This cooling is essentially dominated by increases in surface albedo: historical land cover changes have generally led to a dominant brightening of land as discussed in AR5
- ^ Seymour & Gibbs 2019.
- ^ IPCC SRCCL DRAFT 2019, p. 2-63.
- moved here from different topic by FN Per Femke Nijsse's suggestion., I just wanted to note that I updated my suggestions for edits to the land use change subtopic, and would be interested in reactions to them.Dtetta (talk) 00:06, 14 December 2019 (UTC)
- Thanks for your suggestions and lending your expertise! I think the biggest improvement in your suggested edit compared to what I wrote before are the drivers of land-use change & the updated science. It's more than only agriculture. I'll go over your suggestions line by line.
- Today habitable land occupies 71% of the total land surface; land features such as glaciers and deserts constitute the remainder. Agriculture takes up 50% of the world’s habitable land, while 37% is forests. --> try keeping the language accessible to non-native speakers and youngsters:
consitute the remaindermake up the rest. For brevity's sake I think neither sentence is essential, but I won't object to inserting them either. - Deforestation is the most significant aspect of land use change affecting global warming. Perfect sentence.
- Current assessments of deforestation/forest cover changes vary; some highlight a recent decrease in the rate of deforestation, while others emphasize a continued and significant rate of forest destruction. -> I'd say too detailed.
- The main drivers of global forest loss are: deforestation through permanent land use change for commodity production (27%), forestry (26%), shifting agriculture (24%), and wildfire (23%). Of these, commodity production is most strongly associated with permanent forest loss. --> First sentence is good. Do we have an easier synonym for commodity? Second sentence also alright, but slightly doubting if sufficiently prominent.
- Land use changes such as forest loss affect global warming in a variety of ways. While some cause significant GHG emissions (described above), current global land use conditions also act as a carbon sink for CO2, resulting in an estimated removal of 11-12 billion tonnes annually. --> Remove the term described above, readers have just read this. Working in the world of GW&CC I still don't have a feeling for what a billion ton of CO2 is. Can you use other units? For instance, percentage of human emissions.
- Soil processes and photosynthesis are the principal means through which this carbon sink functions on land. --> I know how important soil processes are for GW, but not sure if to a general reader this comes over as too vague. If we keep it, the sentence could be rephrased as. The land is a carbon sink mainly because of soil processes and increased photosynthesis. This omits the science-speak of principal means
- Land use changes also affect global warming through a variety of other chemical and physical dynamics. -->Yes!
- . Deforestation can also contribute to warming or cooling by affecting the release of aerosols and biogenic volatile organic compounds, which can affect cloud formation; and by changing the roughness of the land surface, which can affect wind speed. --> While completely true, I'd think these are details that don't belong to this article. Our readers won't know what VOCs are, nor what we mean by saying the roughness of a surface has increased. If we want to include something like it, let's simplify. Iirc, VOCs are aerosols, right? No need for introducing new difficult word then. Also, aerosols & all influence clouds in various ways, not only formation, but also persistance and optical depth. Deforestation can also contribute to changing temperatures by affecting the release of aerosols
and biogenic volatile organic compounds, which can affect clouds; and can change wind patterns when the surface has different obstacles. - Globally, these effects are estimated to have led to a slight cooling, dominated by an increase in surface albedo. Important update
- Regional/local effects are more variable; in high-latitude boreal regions, the net effect of deforestation is cooling. In temperate latitudes, forest loss generally causes warming, although the effect is variable. Models show a clear warming effect from tropical deforestation. Land use change effects on global warming can also have a seasonal component. In temperate regions, for example, deforestation leads to summer warming and winter cooling. --> I'd remove both of these sentences as they are too detailed in my opinion. The total effect of LUC isn't that big, so no need to get into the specific patterns.
- Today habitable land occupies 71% of the total land surface; land features such as glaciers and deserts constitute the remainder. Agriculture takes up 50% of the world’s habitable land, while 37% is forests. --> try keeping the language accessible to non-native speakers and youngsters:
- Femke Nijsse (talk) 08:53, 14 December 2019 (UTC)
- Thanks for your suggestions and lending your expertise! I think the biggest improvement in your suggested edit compared to what I wrote before are the drivers of land-use change & the updated science. It's more than only agriculture. I'll go over your suggestions line by line.
Wonderful suggestions! Really appreciate your taking the time to provide that thoughtful response. I will work on incorporating those ideas; I also have been thinking about ways of further revising the wording to better match the tone you describe for the article in general, as well as your original paragraph on this subtopic. I also want to make sure that a reader gets three main takeways from this section:1) although land use patterns are a significant contributor to GHG emissions, they remains a net GHG sink, 2)other “chemical and physical dynamics” provide a further, although slight, cooling effect on global temperatures, and 3)land use changes, particularly further deforestation, could alter these effects in the future. I will put another underline/strikeout/italics version of my next effort on this page before editing the article itself.Dtetta (talk) 13:31, 14 December 2019 (UTC)
Here is one last draft of my proposed changes. I hope I have adequately addressed the comments above. As before, you can see how these changes look with all of the citations and references at: User:Dtetta/GlobalWarming-Land-use-change. I will wait for a day or so before I actually post these as edits to the article. Thanks again for you help with improving this.
Humans change the land surface mainly to create more agricultural land.[1] I would suggest deleting this citation/reference; it focuses on modeling efforts to characterize land-use effects, and doesn’t really address the point of this first sentence, which seems to stand fine on its own without a citation.Today agriculture takes up 50% of the world’s habitable land, while 37% is forests,[2]and by most accounts that figure continues to decrease.[3] [4] This deforestation is the most significant aspect of land use change affecting global warming. The main causes are: deforestation through permanent land use change for agricultural products such as beef and palm oil (27%), forestry/forest products (26%), short term agricultural cultivation (24%), and wildfires (23%).[5] This paragraph was added to introduce and detail current global patterns of land use and land use change, which are important in giving context to how land-use change is affecting Global Warming .
Current patterns of land use affect global warming in a variety of ways. While some aspects cause significant GHG emissions, other land use processes act as a significant carbon sink for CO2, more than offsetting these GHG sources. The net result is an estimated removal (sink) of about 6 billion tonnes annually,[6] or about 12% of global GHG emissions. The land acts as a carbon sink via carbon fixation in the soil and increased photosynthesis.This was added to highlight the fact that land use conditions act as a sink as well as a source of GHGs.
In addition to contributing to GHG emissions, lLand use changes also affect global warming through a variety of other chemical and physical dynamics. Changing the type of vegetation in a region impacts temperature by changing how much sunlight gets reflected back into space, called albedo, and how much heat is lost by evaporation. For instance, the change from a dark forest to grassland makes the surface lighter, causing it to reflect more sunlight. Deforestation can also contribute to changing temperatures by affecting the release of aerosols and other chemical compounds, that affect clouds; and by changing wind patterns when the surface has different obstacles.[7] Although albedo and evapotranspiration are more significant, this sentence was added to provide a more complete description of the range of biogeochemical and biophysical effects. Since the pre-industrial era, albedo has increased due to land use change, which has a cooling effect on the planet. Other processes linked to land use change however have had the opposite effect, so that the net effect remains unclear.[8]Globally, these effects are estimated to have led to a slight cooling, dominated by an increase in surface albedo. [9] But there is significant geographic variation in how this works. In the tropics the net effect is to produce a significant warming, while at latitudes closer to the poles a loss of albedo leads to an overall cooling effect. [10] These two sentences replace the one immediately before in order to provide more updated information, along with regional specifics.
^Dtetta (talk) 15:56, 15 December 2019 (UTC)
- I think the paragraphs are ready for insertion now. I might tweak them later in the light of the entire text, but in essence an they are an improvement to what was there before :). Femke Nijsse (talk) 16:04, 15 December 2019 (UTC)
References
- ^ Duveiller, Hooker & Cescatti 2018.
- ^ Ritchie & Roser 2018.
- ^ {{harvnb|UN FAO|2016|p=3}.
- ^ TSC Webmaster 2018.
- ^ Curtis et al. 2018.
- ^ IPCC SRCCL DRAFT Summary for Policymakers 2019, p. 9
- ^ Seymour & Gibbs 2019.
- ^ Andrews et al. 2016; IPCC AR5 WG1 Technical Summary 2013.
- ^ IPCC SRCCL DRAFT 2019, p. 2-54:The global biophysical cooling alone has been estimated by a larger range of climate models and is -0.10 ± 0.14°C; it ranges from - 0.57°C to +0.06°C .........This cooling is essentially dominated by increases in surface albedo: historical land cover changes have generally led to a dominant brightening of land as discussed in AR5
- ^ Seymour & Gibbs 2019.
In the first time the scientists said that the commitments are enough to limit temperature rise to 2 degrees
If take not only countries NDC but also the pledges of cities, regions, bussines and most important big international coalitions. This is the first time that I hear such declaration and I think this is enough important for put it here and even in the head of the page. I explain it in the talk page because it may surprise people - it very different from what was said before.
The link to the press release of the authors.
The link to the press release of the unfccc.
--אלכסנדר סעודה (talk) 11:32, 13 December 2019 (UTC)
- And I have reverted your addition of whatever this is about because I can't quite make out what you are talking about. Perhaps you could explain more? Do note that Wikipeida is not a newspaper; we do not do "breaking news". Also please regard the standards we have established for citations. Perhaps you missed the notice at the top of your editing window? ♦ J. Johnson (JJ) (talk) 01:00, 14 December 2019 (UTC)
- Also keep in mind that the lede is a summary of the article. It doesn't make sense at all to include completely new information in the lede that isn't further discussed in the text. If you believe this to be important, work on the relevant sections first. See if it sticks, and if it does whether there is consensus to put it in de lede. Femke Nijsse (talk) 09:48, 14 December 2019 (UTC)
This is not a newspaper but an encyclopedia therfore the information should be correct. And right now it is not, so, I try to make it correct. The information that I writed is not new: it is from september.
I explain more. It is very simple: In 18 of september this year a report made by NewClimate Institute, Data-Driven Lab, PBL Netherlands Environmental Assessment Agency, German Development Institute/ Deutsches Institut für Entwicklungspolitik (DIE), Blavatnik School of Government, University of Oxford, was presented to the United Nations saying that while the pledges in the Paris agreement are not enough to limit the temperature rise to 1.5 degree and even to 2 degrees, if you add to this all the other pledges made by countries, cities, bussinesses and most important, international coalitions, it is enough to limit it to 2 degrees.
Even more than that: in the september summit more than 70 others commitments were added (see here) and in december many others (see here). So, maybe now the picture is even more optimistic but for some reason, the world completely miss this type of news. Yes of course it do not say that the work have finished but it say that there are some achievments and that people should turn more attention to check what of it is done. This is one of the main reasons why I want to write it in this page.
Now about citation. I have not missed the standart but when I try to work by the standarts it have not worked. In "sources" in the sections of reports there is a template refbegin|30em. What does it mean? It limit the number of sources to 30 so for adding I have to change it to refbegin|31em? Exept I se that even in the lede of the page there are in linecitations so I tought that it is not so important. If you that it is important I will cite by the instructions but I ask for some help in it.
About writing firstly in the relevant sections. This is at some degree right. I will do it.
--אלכסנדר סעודה (talk) 07:40, 15 December 2019 (UTC)
- I suggest, strongly, that you not edit this (or any) article directly. In the first place, your command of English is not up to the level where we can understand what you mean, let alone to the level expected for the article. Your inexperience and lack of knowledge also indicate a great liklihood of technical errors. It would be much better that you make suggestions here of any possible improvements you have in mind, where we can work out what you have in mind. And when we understand them, and if they are agreed to, someone else can do the actual writing.
- I also suggest that for any content you propose adding you prepare a full citation (using one of the {cite} templates) with all the bibliographic details.
- It seems you have missed the significance of WP:NOTNEWS, which is not all a matter of being correct, but more of timeliness. Note also that we do not include every possible bit of information, and merely being correct (or true) is not a criterion for inclusion. ♦ J. Johnson (JJ) (talk) 00:23, 16 December 2019 (UTC)
- I don't have a strong opinion on whether the added content should be there or not but I have done some small copyedits on it which I hope has made it a little clearer. Not sure if any cites in it still need fixing? If you or anyone else has any new content agreed on the talk page but is not a native English speaker feel free to contact me if you need and if I have time I will copy edit it before it is added. Chidgk1 (talk) 13:40, 18 December 2019 (UTC)
evidence based lede???
So this is in the lede:
But more accurately, global warming is the mainly human-caused increase in global surface temperatures
But one goes to the footnote and there is nothing in the source about "mainly human-caused". I thought WP was supposed to be neutral, and fact-based?
Was a bit shocked to see my search for "climate change" redirected to "global warming" frankly, given the politically loaded nature of that term.174.0.48.147 (talk) 13:41, 24 December 2019 (UTC)
- If you want to know about climate change throughout Earth's history, the article climate change (general concept) is what you're looking for. You might want to look at the source again: it say (we quoted the source in the footnote): "Global warming refers to the gradual increase, observed or projected, in global surface temperature, as one of the consequences of radiative forcing caused by anthropogenic emissions". We used human-caused instead of anthropogenic because we want people without a science background to understand this as well.
- When, in the past, climate change pointed to a page about other instances of climate change, we got a lot of complaints about that as well. Femke Nijsse (talk) 15:13, 24 December 2019 (UTC)
"I thought WP was supposed to be neutral, and fact-based?"
I once thought that as well. But people are not neutral, nor always fact based in their views. So Wikipedia can't actually be. Fxmastermind (talk) 03:27, 31 December 2019 (UTC)
- Strictly speaking, Wikipedia is based on reliable sources. As an encyclopedia we let the experts decide what the "facts" are. If you find an error of fact in an article please mention that on the talk page. But note: your own, personal sense of what is factual has no sway here; you need to cite reliable sources. If you are simply griping because you don't agree with any part of the article, sorry, but as it says at the top of this page: "
This is not a forum for general discussion of the article's subject.
" ♦ J. Johnson (JJ) (talk) 00:28, 1 January 2020 (UTC)- I think following guidelines and policies would help here. Too many editors seem to ignore guidelines and get caught up in discussions about material that should clearly not be included because they ignore guidelines. Lightningstrikers (talk) 13:00, 10 January 2020 (UTC)
Semi-protected edit request on 10 January 2020
This edit request to Global warming has been answered. Set the |answered= or |ans= parameter to no to reactivate your request. |
Please add "One of the physical drivers for global warming is technology, as the development, manufacturing, distribution, and subsequent use of Information and communications technology devices contributes to energy consumption which in turn increases CO2 emissions, in other words, creates cyber warming.” section to the first paragraph of "Global warming" Wikipedia article. Like in below:
Global warming is the long-term rise in the average temperature of the Earth's climate system. It is a major aspect of climate change and has been demonstrated by direct temperature measurements and by measurements of various effects of the warming.[5][6] Global warming and climate change are often used interchangeably.[7] But more accurately, global warming is the mainly human-caused increase in global surface temperatures and its projected continuation,[8] while climate change includes both global warming and its effects, such as changes in precipitation.[9] While there have been prehistoric periods of global warming,[10] many observed changes since the mid-20th century have been unprecedented over decades to millennia.[5][11] One of the physical drivers for global warming is technology, as the development, manufacturing, distribution, and subsequent use of Information and communications technology devices contributes to energy consumption which in turn increases CO2 emissions, in other words, creates cyber warming.” KaRagn (talk) 16:38, 10 January 2020 (UTC)
 Not done You have to understand that for anyone to add this kind of text, you'll need to provide at least one solid, reliable source to reference your text. L293D (☎ • ✎) 19:38, 10 January 2020 (UTC)