Temperature measurement
This article needs additional citations for verification. (August 2010) |

Temperature measurement (also known as thermometry) describes the process of measuring a current temperature for immediate or later evaluation. Datasets consisting of repeated standardized measurements can be used to assess temperature trends.
History[edit]
Attempts at standardized temperature measurement prior to the 17th century were crude at best. For instance in 170 AD, physician Claudius Galenus[1]: 18 mixed equal portions of ice and boiling water to create a "neutral" temperature standard. The modern scientific field has its origins in the works by Florentine scientists in the 1600s including Galileo constructing devices able to measure relative change in temperature, but subject also to confounding with atmospheric pressure changes. These early devices were called thermoscopes. The first sealed thermometer was constructed in 1654 by the Grand Duke of Tuscany, Ferdinand II.[1]: 19 The development of today's thermometers and temperature scales began in the early 18th century, when Gabriel Fahrenheit produced a mercury thermometer and scale, both developed by Ole Christensen Rømer. Fahrenheit's scale is still in use, alongside the Celsius and Kelvin scales.
Technologies[edit]
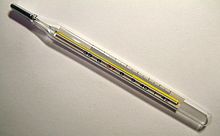
Many methods have been developed for measuring temperature. Most of these rely on measuring some physical property of a working material that varies with temperature. One of the most common devices for measuring temperature is the glass thermometer. This consists of a glass tube filled with mercury or some other liquid, which acts as the working fluid. Temperature increase causes the fluid to expand, so the temperature can be determined by measuring the volume of the fluid. Such thermometers are usually calibrated so that one can read the temperature simply by observing the level of the fluid in the thermometer. Another type of thermometer that is not really used much in practice, but is important from a theoretical standpoint, is the gas thermometer.
Other important devices for measuring temperature include:
- Thermocouples
- Thermistors
- Resistance temperature detector (RTD)
- Pyrometer
- Langmuir probes (for electron temperature of a plasma)
- Infrared thermometer
- Other thermometers
One must be careful when measuring temperature to ensure that the measuring instrument (thermometer, thermocouple, etc.) is really the same temperature as the material that is being measured. Under some conditions heat from the measuring instrument can cause a temperature gradient, so the measured temperature is different from the actual temperature of the system. In such a case the measured temperature will vary not only with the temperature of the system, but also with the heat transfer properties of the system.
What thermal comfort humans, animals and plants experience is related to more than temperature shown on a glass thermometer. Relative humidity levels in ambient air can induce more or less evaporative cooling. Measurement of the wet-bulb temperature normalizes this humidity effect. Mean radiant temperature also can affect thermal comfort. The wind chill factor makes the weather feel colder under windy conditions than calm conditions even though a glass thermometer shows the same temperature. Airflow increases the rate of heat transfer from or to the body, resulting in a larger change in body temperature for the same ambient temperature.
The theoretical basis for thermometers is the zeroth law of thermodynamics which postulates that if you have three bodies, A, B and C, if A and B are at the same temperature, and B and C are at the same temperature then A and C are at the same temperature. B, of course, is the thermometer.
The practical basis of thermometry is the existence of triple point cells. Triple points are conditions of pressure, volume and temperature such that three phases are simultaneously present, for example solid, vapor and liquid. For a single component there are no degrees of freedom at a triple point and any change in the three variables results in one or more of the phases vanishing from the cell. Therefore, triple point cells can be used as universal references for temperature and pressure (see Gibbs phase rule).
Under some conditions it becomes possible to measure temperature by a direct use of the Planck's law of black-body radiation. For example, the cosmic microwave background temperature has been measured from the spectrum of photons observed by satellite observations such as the WMAP. In the study of the quark–gluon plasma through heavy-ion collisions, single particle spectra sometimes serve as a thermometer.
Non-invasive thermometry[edit]
During recent decades, many thermometric techniques have been developed. The most promising and widespread non-invasive thermometric techniques in a biotech context are based on the analysis of magnetic resonance images, computerized tomography images and echotomography. These techniques allow monitoring temperature within tissues without introducing a sensing element.[2] In the field of reactive flows (e.g., combustion, plasmas), laser induced fluorescence (LIF), CARS, and laser absorption spectroscopy have been exploited to measure temperature inside engines, gas-turbines, shock-tubes, synthesis reactors[3] etc. The capability of such optical-based techniques include rapid measurement (down to nanosecond timescales), notwithstanding the ability to not perturb the subject of measurement (e.g., the flame, shock-heated gases).
US (ASME) Standards[edit]
- B40.200-2008: Thermometers, Direct Reading and Remotes Reading.[4]
- PTC 19.3-1974(R2004): Performance test code for temperature measurement.[5]
Air temperature[edit]

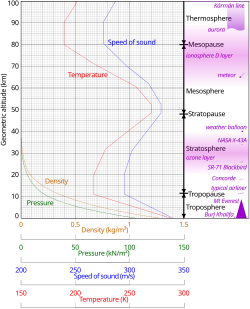
Atmospheric temperature is a measure of temperature at different levels of the Earth's atmosphere. It is governed by many factors, including incoming solar radiation, humidity, and altitude. The abbreviation MAAT is often used for Mean Annual Air Temperature of a geographical location.

Standards[edit]
The American Society of Mechanical Engineers (ASME) has developed two separate and distinct standards on temperature Measurement, B40.200 and PTC 19.3. B40.200 provides guidelines for bimetallic-actuated, filled-system, and liquid-in-glass thermometers. It also provides guidelines for thermowells. PTC 19.3 provides guidelines for temperature measurement related to Performance Test Codes with particular emphasis on basic sources of measurement errors and techniques for coping with them.
Satellite temperature measurement[edit]
Satellite temperature measurements are inferences of the temperature of the atmosphere at various altitudes as well as sea and land surface temperatures obtained from radiometric measurements by satellites. These measurements can be used to locate weather fronts, monitor the El Niño-Southern Oscillation, determine the strength of tropical cyclones, study urban heat islands and monitor the global climate. Wildfires, volcanos, and industrial hot spots can also be found via thermal imaging from weather satellites.
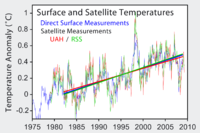
Weather satellites do not measure temperature directly. They measure radiances in various wavelength bands. Since 1978 microwave sounding units (MSUs) on National Oceanic and Atmospheric Administration polar orbiting satellites have measured the intensity of upwelling microwave radiation from atmospheric oxygen, which is related to the temperature of broad vertical layers of the atmosphere. Measurements of infrared radiation pertaining to sea surface temperature have been collected since 1967.
Satellite datasets show that over the past four decades the troposphere has warmed and the stratosphere has cooled. Both of these trends are consistent with the influence of increasing atmospheric concentrations of greenhouse gases.See also[edit]
- Timeline of temperature and pressure measurement technology
- Conversion of scales of temperature
- Color temperature
- Planck temperature
- Temperature data logger
References[edit]
- ^ a b T. J. Quinn (1983). Temperature. London: Academic Press. ISBN 978-0-12-569680-7.
- ^ "Hyperthermal Procedure". Measurements and Biomedical Instrumentation Lab. Università Campus Bio-Medico di Roma. Archived from the original on 2014-07-14. Retrieved 2014-07-10.
- ^ Chrystie, Robin S. M.; Feroughi, Omid M.; Dreier, Thomas; Schulz, Christof (2017-03-21). "SiO multi-line laser-induced fluorescence for quantitative temperature imaging in flame-synthesis of nanoparticles". Applied Physics B. 123 (4): 104. Bibcode:2017ApPhB.123..104C. doi:10.1007/s00340-017-6692-0. ISSN 1432-0649. S2CID 125569546.
- ^ "ASME". American Society of Mechanical Engineers. Retrieved 13 May 2015.
- ^ "ASME". American Society of Mechanical Engineers. Archived from the original on 2015-09-08. Retrieved 13 May 2015.
- ^ Geometric altitude vs. temperature, pressure, density, and the speed of sound derived from the 1962 U.S. Standard Atmosphere.
- ^ Karger, D.N.; Conrad, O.; Böhner, J.; Kawohl, T.; Kreft, H.; Soria-Auza, R.W.; Zimmermann, N.E.; Linder, P.; Kessler, M. (2017). "Climatologies at high resolution for the Earth land surface areas". Scientific Data. 4 (4 170122): 170122. Bibcode:2017NatSD...470122K. doi:10.1038/sdata.2017.122. PMC 5584396. PMID 28872642.
External links[edit]
- Callendar, Hugh Longbourne (1911). . Encyclopædia Britannica. Vol. 26 (11th ed.). pp. 814–821. Another contemporaneous survey of related material.
- Callendar, Hugh Longbourne (1911). . Encyclopædia Britannica. Vol. 26 (11th ed.). pp. 821–836. A detailed contemporaneous survey of thermometric theory and thermometer design.
- A comparison of different measurement technologies Agilent Technologies, Inc. "Practical Temperature Measurements" (PDF). Archived from the original (PDF) on 2017-11-16. Retrieved 2018-11-19.
[We] explore the more common temperature monitoring techniques and introduce procedures for improving their accuracy.


