
File:Typical CSTR RTD curve.svg

Size of this PNG preview of this SVG file: 500 × 400 pixels. Other resolutions: 300 × 240 pixels | 600 × 480 pixels | 960 × 768 pixels | 1,280 × 1,024 pixels | 2,560 × 2,048 pixels.
Original file (SVG file, nominally 500 × 400 pixels, file size: 6 KB)
| This is a file from the Wikimedia Commons. Information from its description page there is shown below. Commons is a freely licensed media file repository. You can help. |
Summary
| Description |
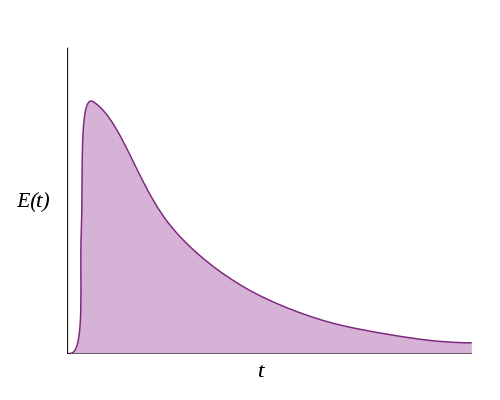
English: A typical residence time distribution (RTD) curve that would be produced by a pulse experiment on a mixed-flow (CSTR) reactor. The shape is approximately exponential, but there is an initial lag due to the reality of physical mixing vs. an ideal CSTR. |
| Date | |
| Source | self-made in Inkscape |
| Author | Andrew Hawryluk Hawryluka |
Licensing
| I, the copyright holder of this work, release this work into the public domain. This applies worldwide. In some countries this may not be legally possible; if so: I grant anyone the right to use this work for any purpose, without any conditions, unless such conditions are required by law. |
File history
Click on a date/time to view the file as it appeared at that time.
| Date/Time | Thumbnail | Dimensions | User | Comment | |
|---|---|---|---|---|---|
| current | 16:05, 19 September 2007 | | 500 × 400 (6 KB) | Hawryluka~commonswiki | {{Information |Description= {{en|A typical residence time distribution (RTD) curve that would be produced by a pulse experiment on a mixed-flow (CSTR) reactor. The shape is approximately exponential, but there is an initial lag due to the reality of physi |
File usage
The following pages on the English Wikipedia use this file (pages on other projects are not listed):
Global file usage
The following other wikis use this file:
- Usage on es.wikipedia.org
- Usage on fr.wikipedia.org