
File:Total CO2 by Region.svg

Size of this PNG preview of this SVG file: 800 × 568 pixels. Other resolutions: 320 × 227 pixels | 640 × 455 pixels | 1,024 × 727 pixels | 1,280 × 909 pixels | 2,560 × 1,819 pixels | 960 × 682 pixels.
Original file (SVG file, nominally 960 × 682 pixels, file size: 36 KB)
| This is a file from the Wikimedia Commons. Information from its description page there is shown below. Commons is a freely licensed media file repository. You can help. |
Summary
| Description |
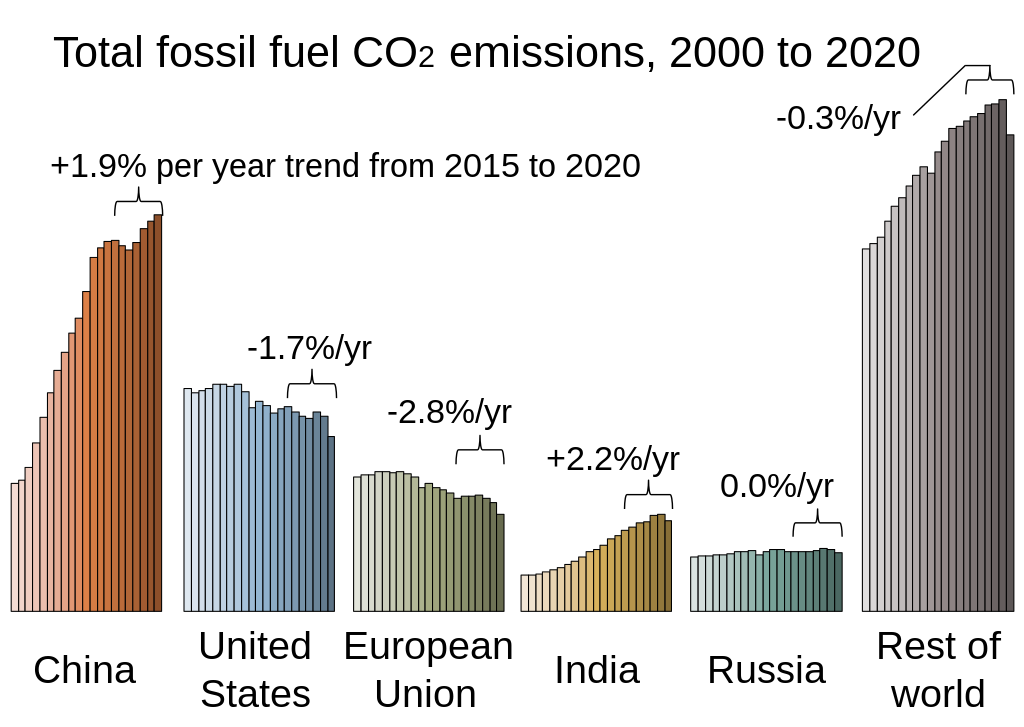
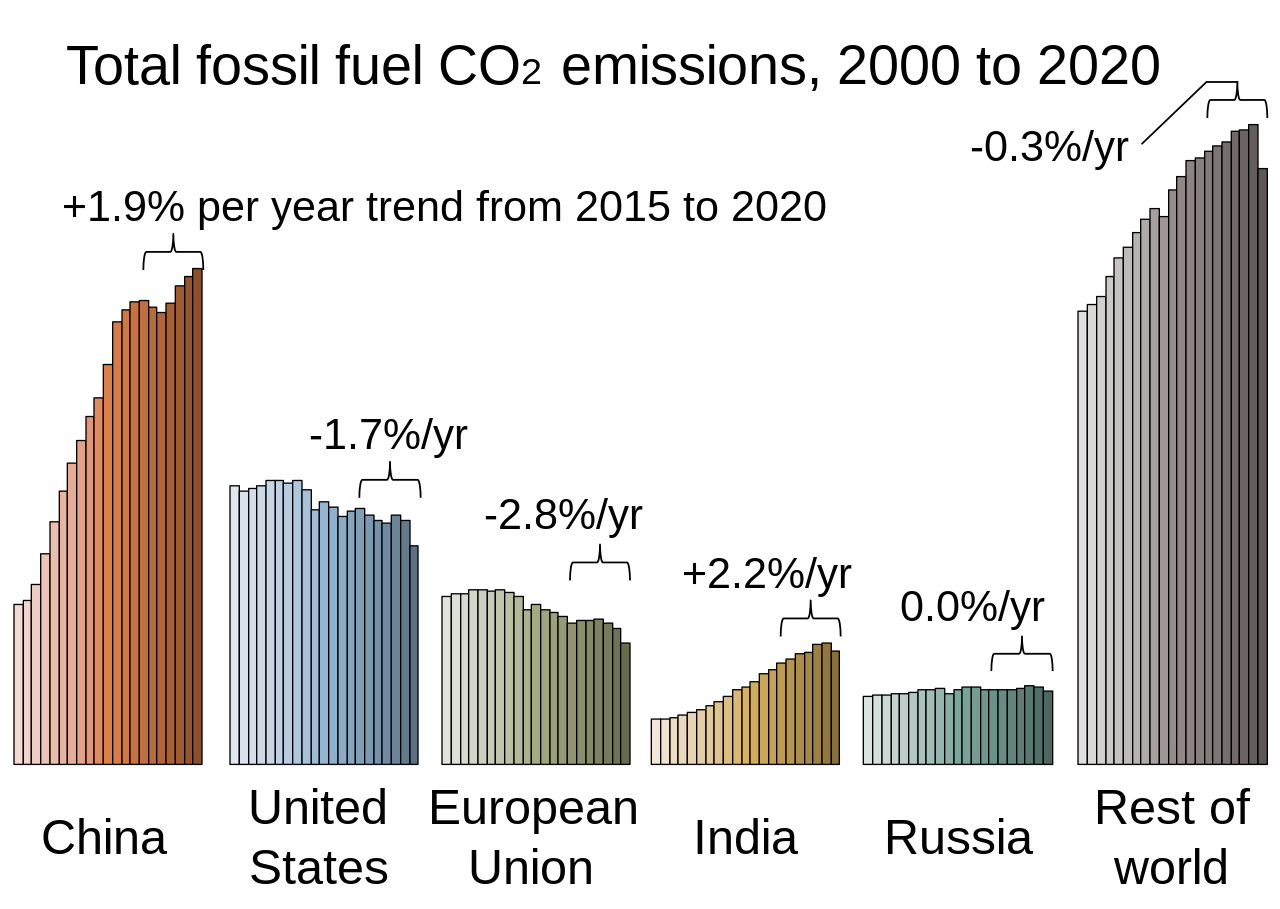
English: To track the largest emitters of carbon dioxide from burning fossil fuels, this chart shows emissions per region from 2000 to 2020. The trend since 2015 is also highlighted in this adaptation of a chart from the Global Carbon Project. The specific source is [1] (distributed under Creative Commons Attribution 4.0 License), based primarily on the image "Global CO2 emissions by region", with russian data aggregated in.
العربية: رسمٌ بياني يُوضّح انبعاثات غاز ثاني أكسيد الكربون من حرقِ الوقود الأحفوري في عددٍ من الدول وذلك من عام 2000 حتى عام 2020. |
| Date | |
| Source | Own work |
| Author | Efbrazil |
Licensing
I, the copyright holder of this work, hereby publish it under the following license:
This file is licensed under the Creative Commons Attribution-Share Alike 4.0 International license.
- You are free:
- to share – to copy, distribute and transmit the work
- to remix – to adapt the work
- Under the following conditions:
- attribution – You must give appropriate credit, provide a link to the license, and indicate if changes were made. You may do so in any reasonable manner, but not in any way that suggests the licensor endorses you or your use.
- share alike – If you remix, transform, or build upon the material, you must distribute your contributions under the same or compatible license as the original.
File history
Click on a date/time to view the file as it appeared at that time.
| Date/Time | Thumbnail | Dimensions | User | Comment | |
|---|---|---|---|---|---|
| current | 19:48, 29 December 2021 | | 960 × 682 (36 KB) | Efbrazil | Refreshed for 2020 data (released 11/21) |
| 16:15, 13 July 2021 |  | 960 × 682 (152 KB) | Amitchell125 | text style amended | |
| 22:30, 17 January 2021 |  | 960 × 682 (34 KB) | Efbrazil | Updated to include 2019 data (released Dec 2020) | |
| 16:05, 13 May 2020 |  | 960 × 682 (37 KB) | Nyq | Decapitalized common nouns | |
| 17:26, 30 March 2020 |  | 960 × 682 (37 KB) | Efbrazil | Removed "for china" to be consistent with other graphics | |
| 17:45, 13 March 2020 |  | 960 × 682 (37 KB) | Efbrazil | Added /yr to rightmost percent label (text fix) | |
| 20:08, 10 March 2020 |  | 960 × 682 (37 KB) | Efbrazil | Minor height shrink | |
| 20:03, 10 March 2020 |  | 960 × 699 (37 KB) | Efbrazil | Added russia, plus native chart rendering | |
| 21:05, 5 March 2020 |  | 960 × 731 (204 KB) | Efbrazil | Fixing CO2 subscript in font hopefully | |
| 20:34, 5 March 2020 |  | 960 × 731 (204 KB) | Efbrazil | Centered title |
File usage
The following pages on the English Wikipedia use this file (pages on other projects are not listed):
Global file usage
The following other wikis use this file:
- Usage on ar.wikipedia.org
- Usage on az.wikipedia.org
- Usage on bn.wikipedia.org
- Usage on cy.wikipedia.org
- Usage on es.wikipedia.org
- Usage on ga.wikipedia.org
- Usage on ka.wikipedia.org
- Usage on ko.wikipedia.org
- Usage on mk.wikipedia.org
- Usage on pnb.wikipedia.org
- Usage on pt.wikipedia.org
- Usage on rw.wikipedia.org
- Usage on tr.wikipedia.org
- Usage on ur.wikipedia.org