
File:Timeline of daily new confirmed COVID-19 deaths worldwide per million people.png

Size of this preview: 800 × 565 pixels. Other resolutions: 320 × 226 pixels | 640 × 452 pixels | 1,024 × 723 pixels | 1,280 × 904 pixels | 2,560 × 1,807 pixels | 3,400 × 2,400 pixels.
Original file (3,400 × 2,400 pixels, file size: 587 KB, MIME type: image/png)
| This is a file from the Wikimedia Commons. Information from its description page there is shown below. Commons is a freely licensed media file repository. You can help. |

|
This graph image could be re-created using vector graphics as an SVG file. This has several advantages; see Commons:Media for cleanup for more information. If an SVG form of this image is available, please upload it and afterwards replace this template with
{{vector version available|new image name}}.
It is recommended to name the SVG file “Timeline of daily new confirmed COVID-19 deaths worldwide per million people.svg”—then the template Vector version available (or Vva) does not need the new image name parameter. |
Summary
| Description |
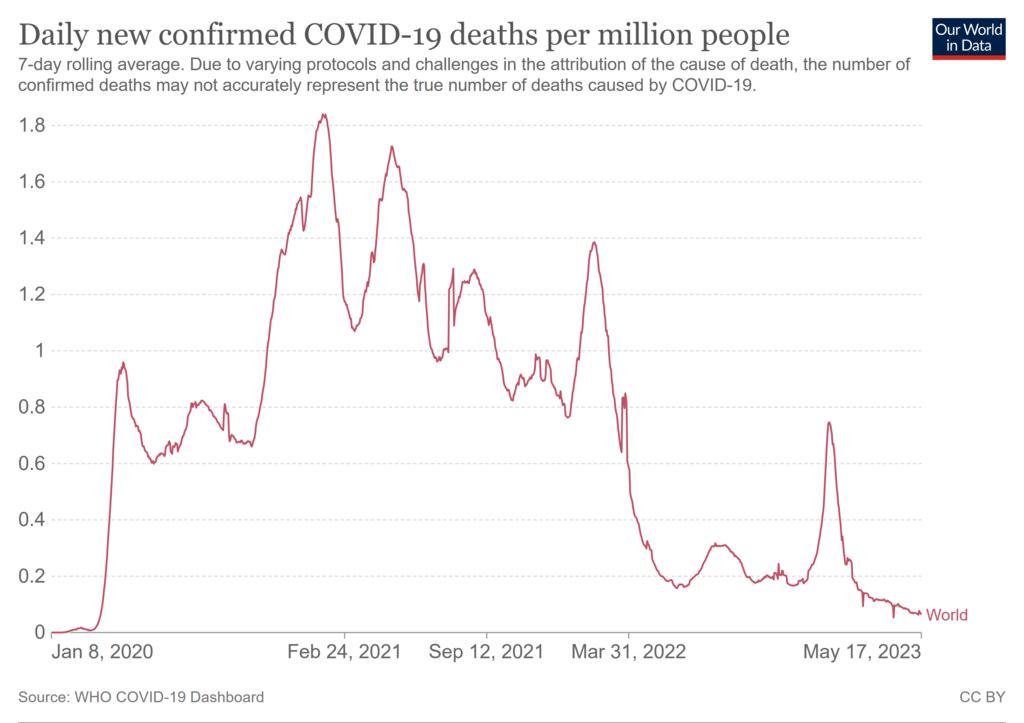
English: Timeline of daily new confirmed COVID-19 deaths worldwide per million people. Rolling 7-day average. See end date on graph. Go to the source link below. The sources tab there links to: COVID-19 Data Repository by the Center for Systems Science and Engineering (CSSE) at Johns Hopkins University. The table tab has exact numbers by country. Drag its timeline for numbers by date. The graph at the source is interactive and provides more detail. For example; run your cursor over the graph for the date and rate. For daily world death totals see: File:Timeline of daily new confirmed COVID-19 deaths worldwide.svg and its source for the latest numbers. |
| Date | 11 June 2021 is the date of the first upload to the Commons. See the file history below for the most recent upload date. Please upload new versions. Use the upload link at the end of the file history list. |
| Source | Our World in Data (OWID). https://ourworldindata.org/explorers/coronavirus-data-explorer?Metric=Confirmed+deaths&Interval=7-day+rolling+average&Relative+to+Population=true&Align+outbreaks=false&country=~OWID_WRL - Click on the download tab. There is an SVG and a PNG version to download. |
| Author | Our World In Data. See Wikipedia: Our World in Data. |
Licensing
This file is licensed under the Creative Commons Attribution 4.0 International license.
- You are free:
- to share – to copy, distribute and transmit the work
- to remix – to adapt the work
- Under the following conditions:
- attribution – You must give appropriate credit, provide a link to the license, and indicate if changes were made. You may do so in any reasonable manner, but not in any way that suggests the licensor endorses you or your use.
File history
Click on a date/time to view the file as it appeared at that time.
| Date/Time | Thumbnail | Dimensions | User | Comment | |
|---|---|---|---|---|---|
| current | 03:03, 19 May 2023 | | 3,400 × 2,400 (587 KB) | Timeshifter | Latest |
| 04:59, 14 January 2023 |  | 3,400 × 2,400 (563 KB) | Timeshifter | Latest graph | |
| 15:17, 11 December 2022 |  | 3,400 × 2,400 (558 KB) | Timeshifter | latest graph from source. | |
| 10:04, 23 October 2022 |  | 3,400 × 2,400 (509 KB) | Timeshifter | latest graph from source. | |
| 00:03, 7 October 2022 |  | 3,400 × 2,400 (507 KB) | Timeshifter | Latest map from source. | |
| 13:02, 23 August 2022 |  | 3,400 × 2,400 (533 KB) | Timeshifter | Latest graph from source. | |
| 12:30, 29 June 2022 |  | 3,400 × 2,400 (505 KB) | Timeshifter | latest graph from source. | |
| 04:02, 13 June 2022 |  | 3,400 × 2,400 (504 KB) | Timeshifter | latest graph from source. | |
| 20:53, 5 May 2022 |  | 3,400 × 2,400 (504 KB) | Timeshifter | latest graph from source. | |
| 06:29, 22 April 2022 |  | 3,400 × 2,400 (548 KB) | Timeshifter | Latest graph from source |
File usage
The following pages on the English Wikipedia use this file (pages on other projects are not listed):
Global file usage
The following other wikis use this file:
- Usage on az.wikipedia.org
- Usage on ha.wikipedia.org
- Usage on ml.wikipedia.org
- Usage on vi.wikipedia.org