
File:Standard deviation diagram.svg

Size of this PNG preview of this SVG file: 400 × 200 pixels. Other resolutions: 320 × 160 pixels | 640 × 320 pixels | 1,024 × 512 pixels | 1,280 × 640 pixels | 2,560 × 1,280 pixels.
Original file (SVG file, nominally 400 × 200 pixels, file size: 17 KB)
| This is a file from the Wikimedia Commons. Information from its description page there is shown below. Commons is a freely licensed media file repository. You can help. |
Summary
| Description |
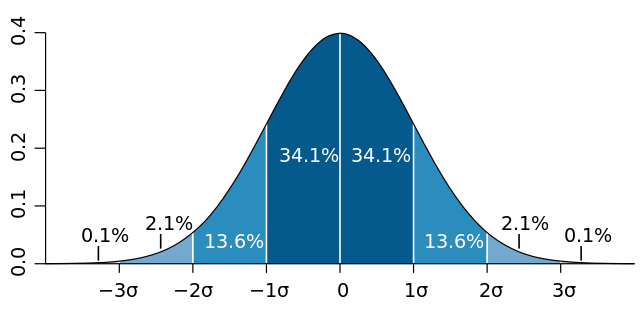
English: Normal distribution curve that illustrates standard deviations. Each band has 1 standard deviation, and the labels indicate the approximate proportion of area (note: these add up to 99.8%, and not 100% because of rounding for presentation.)
Français : Courbe de distribution normale montrant l'écart type. Chaque bande verticale a une largeur d'un écart type et les pourcentages indiquent leur valeur approximative rapportée à la population totale. Note : du fait des arrondis, le total est de 99,8 % au lieu de 100%. |
| Date | |
| Source | Own work, based (in concept) on figure by Jeremy Kemp, on 2005-02-09 |
| Author | M. W. Toews |
| Other versions |
|
.svg)
Licensing
This file is licensed under the Creative Commons Attribution 2.5 Generic license.
- You are free:
- to share – to copy, distribute and transmit the work
- to remix – to adapt the work
- Under the following conditions:
- attribution – You must give appropriate credit, provide a link to the license, and indicate if changes were made. You may do so in any reasonable manner, but not in any way that suggests the licensor endorses you or your use.
File history
Click on a date/time to view the file as it appeared at that time.
| Date/Time | Thumbnail | Dimensions | User | Comment | |
|---|---|---|---|---|---|
| current | 02:06, 15 January 2015 | | 400 × 200 (17 KB) | GliderMaven | Average is now zero not mu |
| 11:08, 7 April 2007 |  | 400 × 200 (14 KB) | Petter Strandmark | == Summary == Standard deviation diagram, based an original graph by Jeremy Kemp, in 2005-02-09 [http://pbeirne.com/Programming/gaussian.ps]. This figure was started in R using: <pre> x <- seq(-4,4,.1) plot(x,dnorm(x),type |
File usage
More than 100 pages use this file. The following list shows the first 100 pages that use this file only. A full list is available.
- Jitter
- Moment problem
- Normal distribution
- One- and two-tailed tests
- Percentile
- Probability distribution
- Quality of life (healthcare)
- Quasiconvex function
- Reference range
- Sample maximum and minimum
- Shape of a probability distribution
- Standard deviation
- Standard error
- Threshold model
- Zener cards
- Talk:Intellectual giftedness/Archive 1
- Talk:Labiaplasty/Archive 1
- Talk:Volcanic winter of 536
- User:007fan28
- User:Apie~enwiki
- User:Apple1976
- User:Arsenalfan2
- User:Asitgoes/Normdis
- User:BYMAstudent
- User:Barrera marquez/more userboxes
- User:Bcartolo
- User:Bh28
- User:Bookgirl1231
- User:CS46/Sandbox
- User:Chrispynz
- User:Coolcool2012
- User:DanielSlaughter
- User:Darkinho
- User:Duncan/Oldpage
- User:Dwalton32
- User:Dynamitejoe
- User:ElfLady64
- User:Fabioli2010
- User:FastLizard4/Userpageuserboxes
- User:Fmiddleton
- User:Foetusized
- User:Frozen Mists
- User:G.C.E. Galotta
- User:GGByte
- User:Gill110951/User Seminormal
- User:Godlvall2/UserBoxes
- User:Googolme
- User:Hazratemahmood
- User:Hidayisfriday
- User:Hughesdarren
- User:I'm your Grandma.
- User:Jamrb
- User:JeffTL
- User:JosVan
- User:JosieSmosie
- User:Junh1024
- User:Justarandomgeek
- User:Justlearninghowtosmile
- User:Keepstherainoff
- User:Koyuki267
- User:Lamb Ham Jam Man
- User:Lds/Userboxes
- User:Llewelyn MT
- User:Lord Ics
- User:Luis Espejel
- User:Maurice Carbonaro
- User:Max613
- User:Michael Z Freeman
- User:Misosoup7
- User:My sable hats
- User:Normallydistributed
- User:Notime2cry
- User:PSnP
- User:PSnP/Userboxes/Normal
- User:Palasso
- User:PhillipR
- User:Philosophy.dude
- User:Qitaana
- User:Qui1che/About me
- User:Rachelopolis
- User:Ramon4
- User:Ravid0520
- User:Ryper
- User:SaiyanEmperor2008
- User:Sarindam7
- User:Silent Method
- User:Srpbm
- User:Sundostund
- User:The Genealogy Guy
- User:TimothyPilgrim
- User:Toolnut/sandbox
- User:Tyklink
- User:UBX/Userboxes/Humor
- User:VectorCell
- User:WeeIlya
- User talk:Gill110951
- Wikipedia:Picture peer review/Archives/Jul-Dec 2007
- Wikipedia:Picture peer review/StandardDeviationDiagram
- Wikipedia:Requests for bureaucratship/MBisanz
- Wikipedia:Userboxes/Mathematics
View more links to this file.
Global file usage
The following other wikis use this file:
- Usage on af.wikipedia.org
- Usage on ar.wikipedia.org
- Usage on ast.wikipedia.org
- Usage on as.wikipedia.org
- Usage on ba.wikipedia.org
- Usage on be-tarask.wikipedia.org
- Usage on bg.wikipedia.org
- Usage on bn.wikipedia.org
- Usage on bs.wikipedia.org
- Usage on ca.wikipedia.org
- Usage on cbk-zam.wikipedia.org
- Usage on cs.wikipedia.org
- Usage on cv.wikipedia.org
- Usage on cy.wikipedia.org
- Usage on dag.wikipedia.org
- Usage on da.wikipedia.org
- Usage on de.wikipedia.org
- Usage on de.wikiversity.org
- Usage on el.wikipedia.org
- Usage on en.wikibooks.org
- Usage on es.wikipedia.org
- Usage on et.wikipedia.org
View more global usage of this file.