
File:Radar-bright-band.png
No higher resolution available.
Radar-bright-band.png (791 × 449 pixels, file size: 263 KB, MIME type: image/png)
| This is a file from the Wikimedia Commons. Information from its description page there is shown below. Commons is a freely licensed media file repository. You can help. |
Summary
| Description |
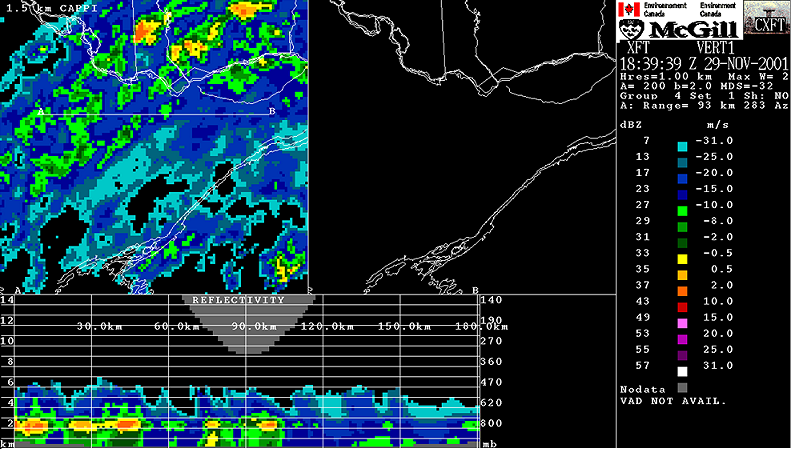
Français : En haut, CAPPI de 1,5km d'altitude montrent de forts échos radar, en jaune, parmi des échos plus faibles en vert. Dans la partie du bas, la coupe verticale à travers les données radar montre que ces intensités sont dues à la présence d'une zone de réflectivité plus intense se situant entre 1,5 km à 2,5 km d'altitude. Cette bande brillante est causée par de la neige fondante.
English: Snow falling through the freezing level will melt and reach the ground as rain. On this image, at the top we can see a CAPPI of precipitations. At the bottom, there is a cross-section of the radar data from ground to 15 km. One can see a level where echos are stronger: the bright-band. The melting begin to occur just above this band and continue until its lower part. This effect is due to the fact that the reflectivity depend on the 6th power of the diameter of targets multiplied by its ability to reflect. Snow flakes are much larger than rain drops but they reflect much less so echos from snow and rain have intensities relatively close. However, when snow melt, it keeps its diameter for a while and get coated with water. The radar beam sees something similar to a very larger water dropplet and the return is producing this very strong band. |
| Date | 1839 UTC |
| Source |
English: Meteorological Service of Canada (Environment Canada). Redistribution allowed if source mentionned |
| Author |
Français : Ce radar est opéré par Environnement Canada. La sortie radar est produite par le logiciel développé par l'Observatoire radar J.S. Marshall de l'Université McGill en collaboration avec EC. |
Licensing

|
The copyright holder of this file allows anyone to use it for any purpose, provided that the copyright holder is properly attributed. Redistribution, derivative work, commercial use, and all other use is permitted. |
|
|
File history
Click on a date/time to view the file as it appeared at that time.
| Date/Time | Thumbnail | Dimensions | User | Comment | |
|---|---|---|---|---|---|
| current | 15:20, 8 May 2006 | | 791 × 449 (263 KB) | Pierre cb | Snow falling through the freezing level will melt and reach the ground as rain. On this image, at the top we can see a CAPPI of precipitations. At the bottom, there is a cross-section of the radar data from ground to 15 km. On can see a level where echos |
File usage
The following pages on the English Wikipedia use this file (pages on other projects are not listed):
Global file usage
The following other wikis use this file:
- Usage on es.wikipedia.org
- Usage on fr.wikipedia.org
- Usage on he.wikipedia.org
- Usage on ja.wikipedia.org