
File:Psychometric chart example of Salt Lake City.png

Size of this preview: 800 × 479 pixels. Other resolutions: 320 × 192 pixels | 640 × 383 pixels | 1,024 × 613 pixels | 1,280 × 766 pixels | 3,379 × 2,023 pixels.
Original file (3,379 × 2,023 pixels, file size: 849 KB, MIME type: image/png)
| This is a file from the Wikimedia Commons. Information from its description page there is shown below. Commons is a freely licensed media file repository. You can help. |

|
This physics image could be re-created using vector graphics as an SVG file. This has several advantages; see Commons:Media for cleanup for more information. If an SVG form of this image is available, please upload it and afterwards replace this template with
{{vector version available|new image name}}.
It is recommended to name the SVG file “Psychometric chart example of Salt Lake City.svg”—then the template Vector version available (or Vva) does not need the new image name parameter. |
Summary
| Description |
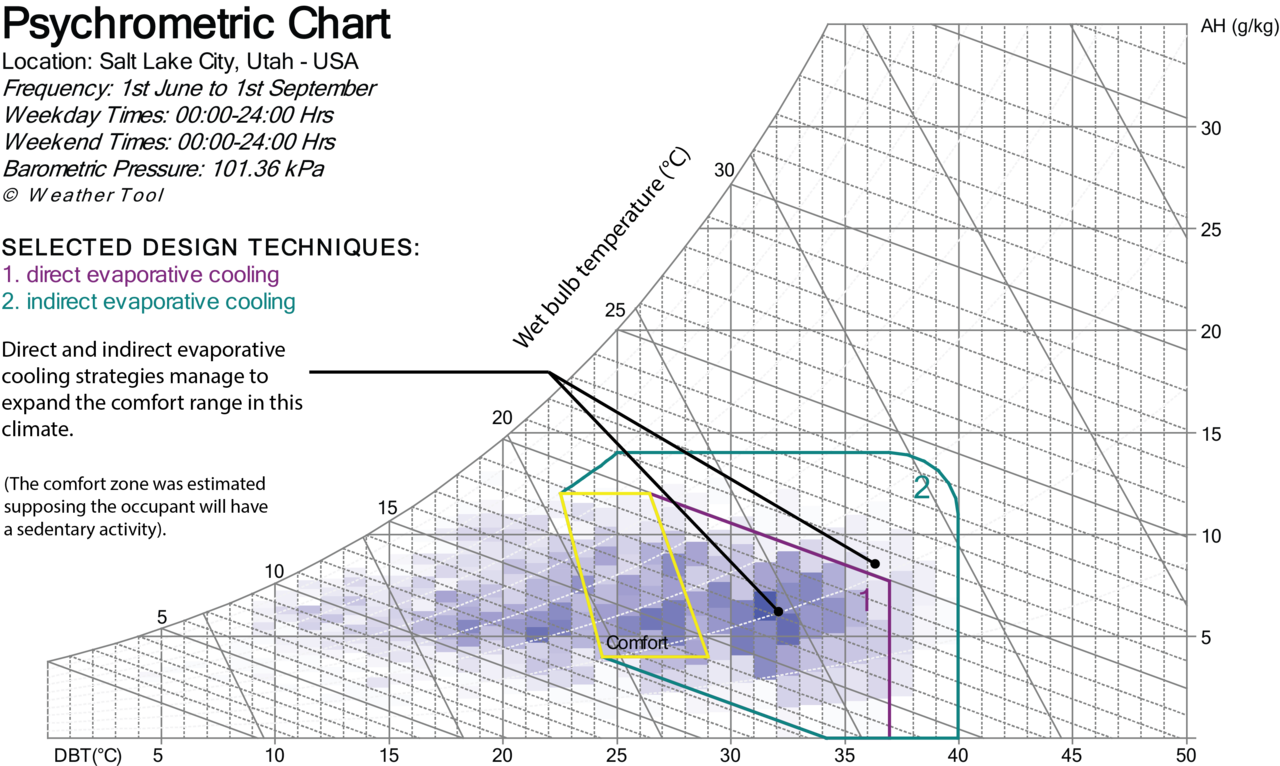
English: Psychrometric chart example of Salt Lake City from Autodesk Ecotect. The blue cells represent distribution of typical annual climate. Acceptable climate conditions for direct and indirect evaporative cooling are outlined in green and purple, respectively. |
| Date | |
| Source | Autodesk Weather Tool software |
| Author | Soazig Kaam |
The graph has been generated using Autodesk Weather Tool software.
Licensing
I, the copyright holder of this work, hereby publish it under the following licenses:

|
Permission is granted to copy, distribute and/or modify this document under the terms of the GNU Free Documentation License, Version 1.2 or any later version published by the Free Software Foundation; with no Invariant Sections, no Front-Cover Texts, and no Back-Cover Texts. A copy of the license is included in the section entitled GNU Free Documentation License. |
This file is licensed under the Creative Commons Attribution 3.0 Unported license.
- You are free:
- to share – to copy, distribute and transmit the work
- to remix – to adapt the work
- Under the following conditions:
- attribution – You must give appropriate credit, provide a link to the license, and indicate if changes were made. You may do so in any reasonable manner, but not in any way that suggests the licensor endorses you or your use.
You may select the license of your choice.
File history
Click on a date/time to view the file as it appeared at that time.
| Date/Time | Thumbnail | Dimensions | User | Comment | |
|---|---|---|---|---|---|
| current | 09:15, 3 December 2014 | | 3,379 × 2,023 (849 KB) | Soazigk | {{Information |Description ={{en|1=The graph illustrates the potential of direct and indirect evaporative cooling strategies can expand the comfort range in summer time in Salt Lake City. }} |Source =Autodesk Weather Tool software |Author... |
File usage
The following pages on the English Wikipedia use this file (pages on other projects are not listed):
Global file usage
The following other wikis use this file:
- Usage on fr.wikipedia.org
- Usage on it.wikipedia.org