
File:Prov-econ.png
Original file (1,102 × 820 pixels, file size: 129 KB, MIME type: image/png)
Summary[edit]
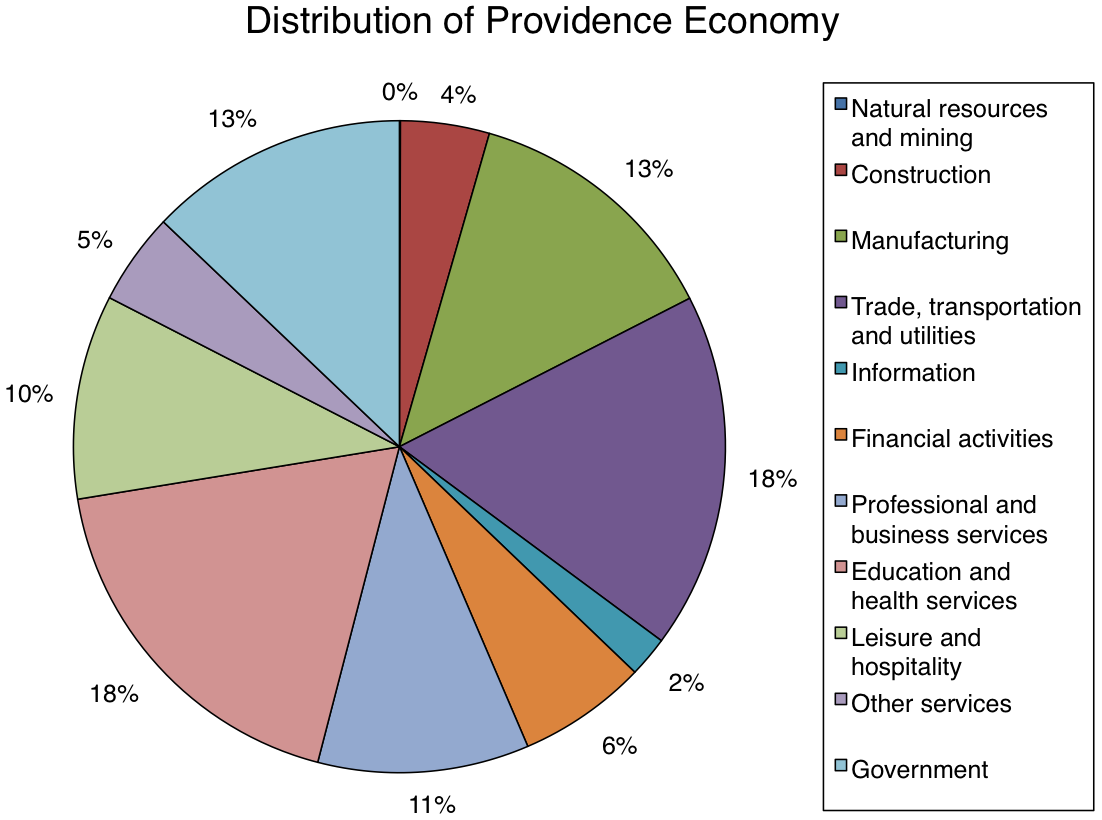
A pie chart made in Excel demonstrating the distribution of the economy of Providence, Rhode Island. Data taken from [1], using the following data:
- natural resources and mining: 300 (note that this rounds to 0%)
- construction: 25,600
- manufacturing: 75,700
- trade, transportation and utilities: 102,700
- information: 11,700
- financial activities: 37,200
- professional and business services: 60,900
- educational and health services: 106,900
- leisure and hospitality: 58,900
- other services: 26,500
- government: 74,900
Notes: Education, healthcare, trade, transportation, and utilities comprise over one third (37%) of the economy. Adding in manufacturing constitutes one half of Providence's economy.
Licensing[edit]
 | I, the copyright holder of this work, hereby grant the permission to copy, distribute and/or modify this document under the terms of the GNU Free Documentation License, Version 1.2 or any later version published by the Free Software Foundation; with no Invariant Sections, no Front-Cover Texts, and no Back-Cover Texts. |
Redone from scratch based on File:Prov-econ.JPG, which is also GFDL-self-no-disclaimers
 | This file is a candidate to be copied to Wikimedia Commons.
Any user may perform this transfer; refer to Wikipedia:Moving files to Commons for details. If this file has problems with attribution, copyright, or is otherwise ineligible for Commons, then remove this tag and DO NOT transfer it; repeat violators may be blocked from editing. Other Instructions
| ||
| |||
File history
Click on a date/time to view the file as it appeared at that time.
| Date/Time | Thumbnail | Dimensions | User | Comment | |
|---|---|---|---|---|---|
| current | 02:56, 7 June 2011 | | 1,102 × 820 (129 KB) | DMacks (talk | contribs) | tighten legend to graph, crop whole image (GIMP) |
| 02:53, 7 June 2011 |  | 1,228 × 878 (157 KB) | DMacks (talk | contribs) | larger font, clear bg | |
| 02:50, 7 June 2011 |  | 1,228 × 878 (151 KB) | DMacks (talk | contribs) | line-wrap the categories (narrows the legend) | |
| 02:39, 7 June 2011 |  | 1,228 × 815 (139 KB) | DMacks (talk | contribs) | == Summary == A pie chart made in Excel demonstrating the distribution of the economy of Providence, Rhode Island. Data taken from [http://www.city-data.com/us-cities/The-Northeast/Providence-Economy.html], using the foll |
You cannot overwrite this file.