
File:Price elasticity of demand and revenue.svg

Size of this PNG preview of this SVG file: 215 × 320 pixels. Other resolutions: 161 × 240 pixels | 322 × 480 pixels | 516 × 768 pixels | 688 × 1,024 pixels | 1,376 × 2,048 pixels.
Original file (SVG file, nominally 215 × 320 pixels, file size: 9 KB)
| This is a file from the Wikimedia Commons. Information from its description page there is shown below. Commons is a freely licensed media file repository. You can help. |
| Description |
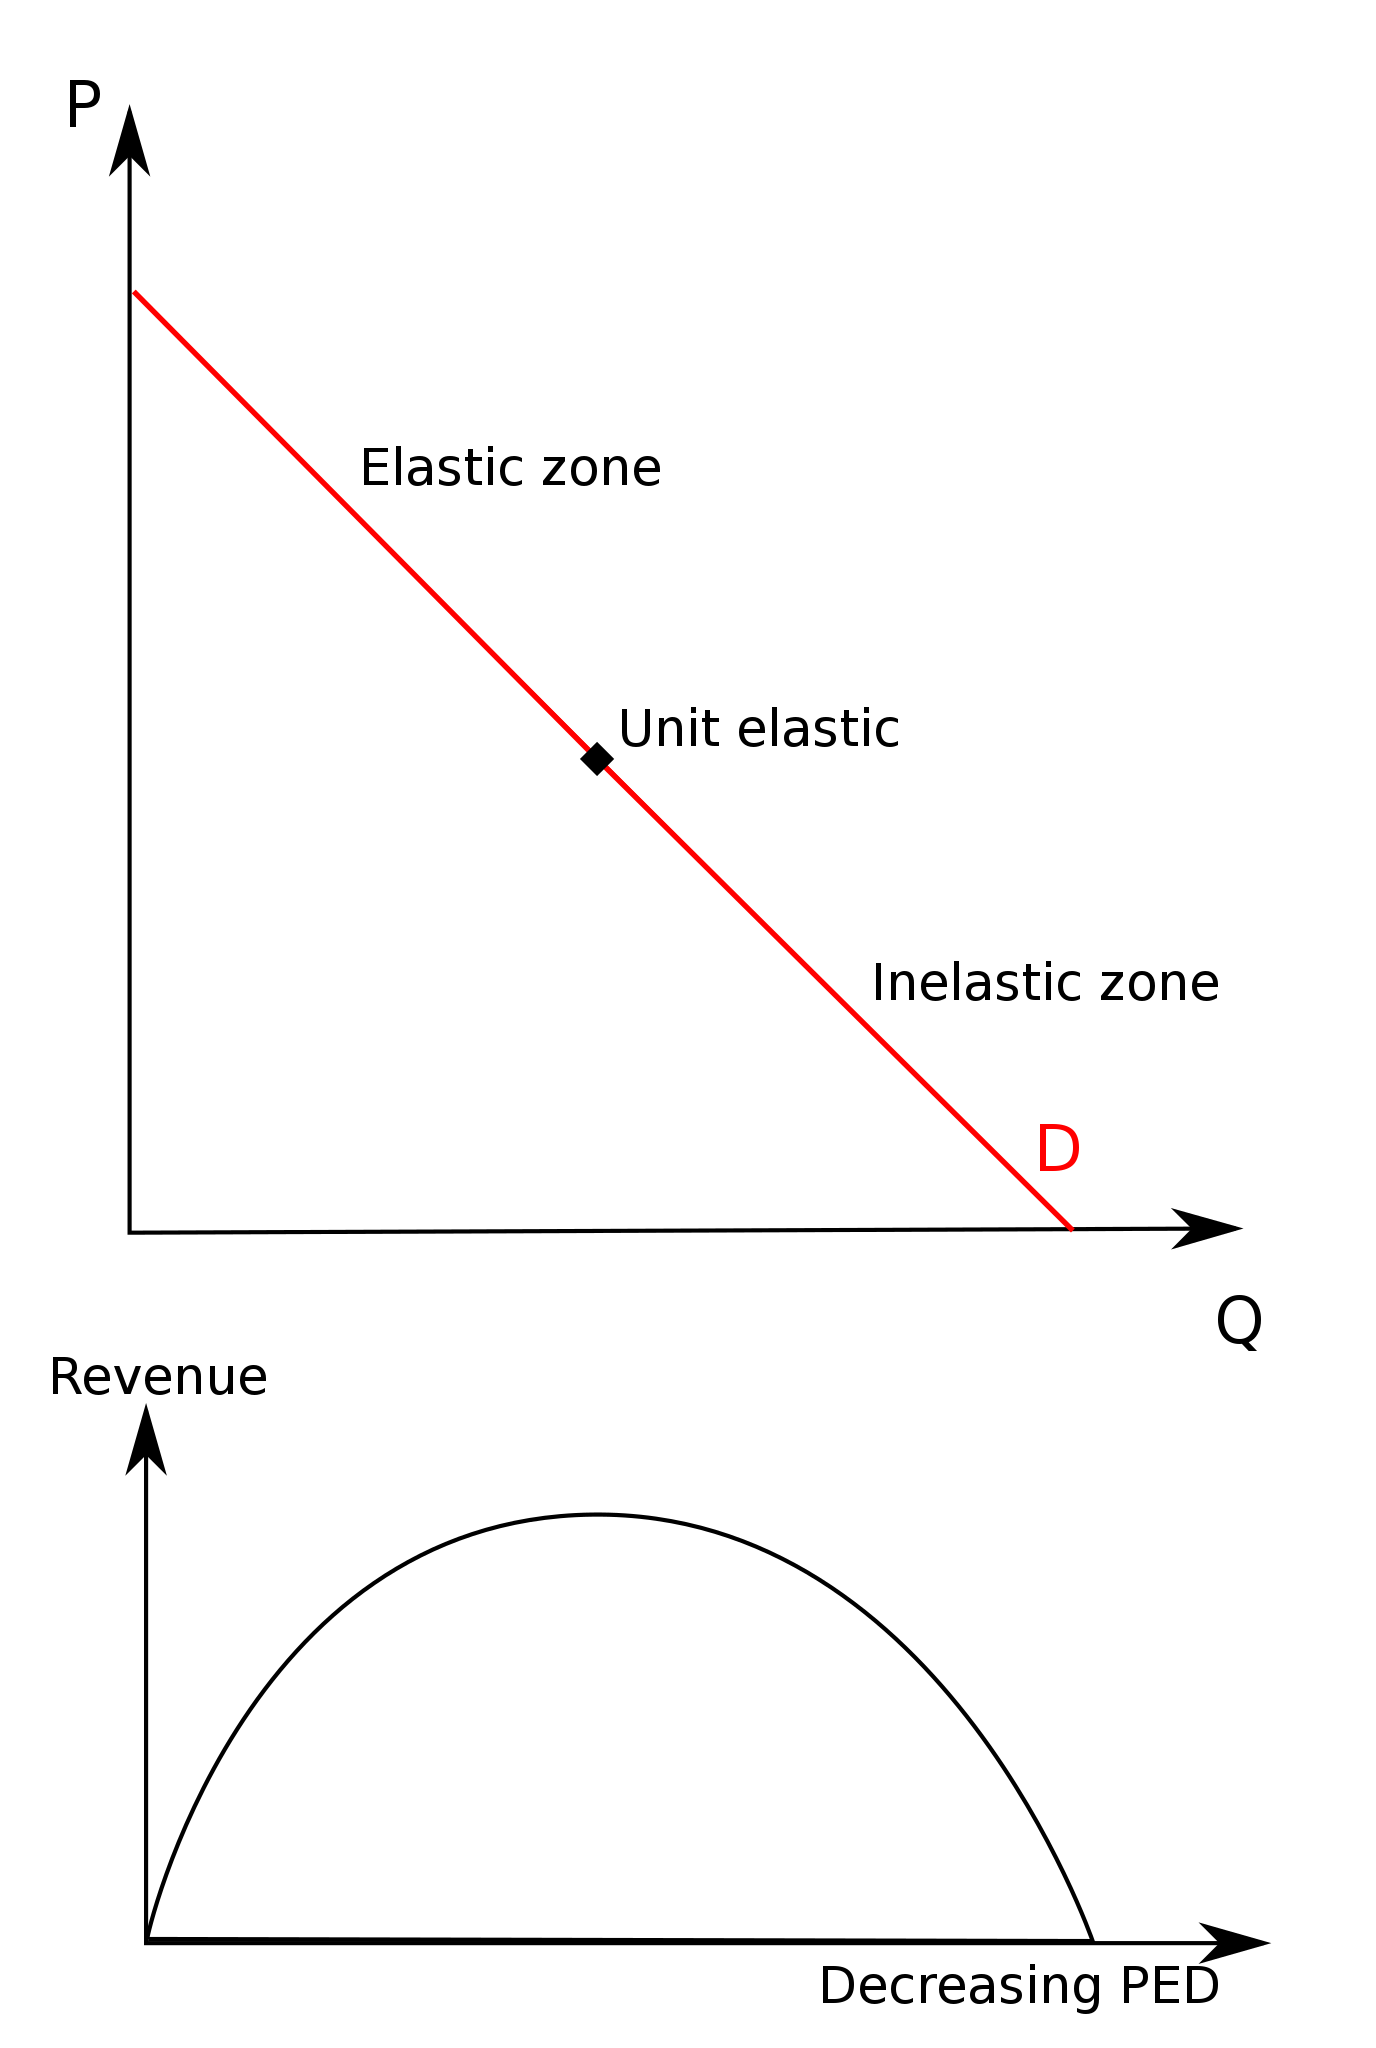
English: An SVG-ified graph showing the relationship between elasticity and revenue. Such graphs are common when explaining this relationship; for an interactive Java applet demonstrating the concept, see [1]. A chart showing total revenue (but not an associated demand curve) is also available in Pashigian, Peter B. (1998). Price Theory and Applications. McGraw-Hill. ISBN 0070487782. Note: not as strictly accurate as original file. |
| Date | (UTC) |
| Source | |
| Author |
|
I, the copyright holder of this work, hereby publish it under the following licenses:
| This file is licensed under the Creative Commons Attribution-Share Alike 3.0 Unported license. Subject to disclaimers. | ||
| ||
| This licensing tag was added to this file as part of the GFDL licensing update. |

|
Permission is granted to copy, distribute and/or modify this document under the terms of the GNU Free Documentation License, Version 1.2 or any later version published by the Free Software Foundation; with no Invariant Sections, no Front-Cover Texts, and no Back-Cover Texts. A copy of the license is included in the section entitled GNU Free Documentation License. Subject to disclaimers. |
You may select the license of your choice.
Original upload log
This image is a derivative work of the following images:
- File:Price_elasticity_of_demand_and_revenue.png licensed with Cc-by-sa-3.0-migrated, Cc-by-sa-3.0-migrated-with-disclaimers, GFDL, GFDL-en
- 2010-02-28T15:06:27Z File Upload Bot (Magnus Manske) 430x505 (7871 Bytes) {{BotMoveToCommons|en.wikipedia|year={{subst:CURRENTYEAR}}|month={{subst:CURRENTMONTHNAME}}|day={{subst:CURRENTDAY}}}} {{Information |Description={{en|A graph showing the relationship between elasticity and revenue. Made by
Uploaded with derivativeFX
File history
Click on a date/time to view the file as it appeared at that time.
| Date/Time | Thumbnail | Dimensions | User | Comment | |
|---|---|---|---|---|---|
| current | 15:22, 28 February 2010 | | 215 × 320 (9 KB) | Jarry1250 | Sorry, uploaded wrong version. This one has the correct labels. |
| 15:14, 28 February 2010 |  | 215 × 320 (7 KB) | Jarry1250 | {{Information |Description={{en|An SVG-ified graph showing the relationship between elasticity and revenue. Such graphs are common when explaining this relationship; for an interactive Java applet demonstrating the concept, see [http://www.econtools.com/j |
File usage
The following pages on the English Wikipedia use this file (pages on other projects are not listed):
Global file usage
The following other wikis use this file:
- Usage on de.wikipedia.org
- Usage on es.wikipedia.org
- Usage on ja.wikipedia.org
- Usage on pt.wikibooks.org
- Usage on pt.wikiversity.org
- Usage on si.wikipedia.org
- Usage on uk.wikipedia.org
- Usage on uz.wikipedia.org