
File:Pressure chart geostrophic flow 2.jpg
No higher resolution available.
Pressure_chart_geostrophic_flow_2.jpg (600 × 397 pixels, file size: 171 KB, MIME type: image/jpeg)
| This is a file from the Wikimedia Commons. Information from its description page there is shown below. Commons is a freely licensed media file repository. You can help. |
Summary
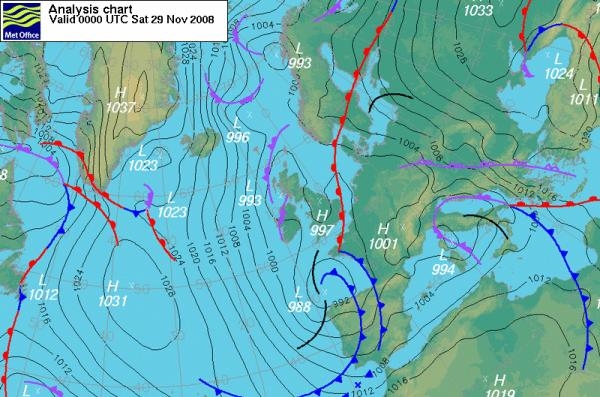
| Description |
This is a daily pressure chart of North Atlantic Ocean and Europe based on measured values (analysis). Source: http://www.metoffice.gov.uk/weather/europe/europe_forecast.html Geostrophic-flow conditions are set when the isobars are approximately parallel and equally spaced. The air masses move along the isobars like a stream flow. An air stream flows from Arctic to mid latitudes south of the 40th parallel. Higher-pressure systems are found along the right-hand side of the stream, and lower-pressure ones on its left-hand side (northern-hemisphere arrangement) |
| Source | http://www.metoffice.gov.uk/weather/europe/europe_forecast.html |
| Author |
Licensing
.svg)
|
This file is licensed under the Open Government Licence version 1.0 (OGL v1.0).
|
|---|---|
| Attribution:The Met Office | |
|
You are free to:
See the Open Government Licence page on Meta-Wiki for more information.
|
Original upload log
The original description page was here. All following user names refer to en.wikipedia.
| Date/Time | Dimensions | User | Comment |
|---|---|---|---|
| 2009-10-04 10:50:52 | 600 × 397 | Xavierstuvw | == Summary == Daily pressure chart (analysis) Sourcehttp://www.metoffice.gov.uk/weather/europe/europe_forecast.html (c) British Crown Copyright 2009, the Met Office == Licensing == {{attribution||British Crown Copyright 2009, the Met Office}} |
File history
Click on a date/time to view the file as it appeared at that time.
| Date/Time | Thumbnail | Dimensions | User | Comment | |
|---|---|---|---|---|---|
| current | 10:05, 25 February 2017 | | 600 × 397 (171 KB) | FastilyClone | Transferred from en.wikipedia (MTC!) |
File usage
The following pages on the English Wikipedia use this file (pages on other projects are not listed):
Global file usage
The following other wikis use this file:
- Usage on zh.wikipedia.org