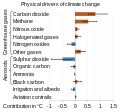
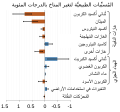
File:Physical Drivers of climate change.svg

Size of this PNG preview of this SVG file: 645 × 600 pixels. Other resolutions: 258 × 240 pixels | 516 × 480 pixels | 826 × 768 pixels | 1,101 × 1,024 pixels | 2,202 × 2,048 pixels | 960 × 893 pixels.
Original file (SVG file, nominally 960 × 893 pixels, file size: 33 KB)
File history
Click on a date/time to view the file as it appeared at that time.
| Date/Time | Thumbnail | Dimensions | User | Comment | |
|---|---|---|---|---|---|
| current | 09:03, 10 March 2024 |  | 960 × 893 (33 KB) | Hakimi97 | File uploaded using svgtranslate tool (https://svgtranslate.toolforge.org/). Added translation for ms. |
| 21:06, 18 November 2022 |  | 960 × 893 (30 KB) | Efbrazil | Renamed "Land-use changes" to "Irrigation and albedo", as land use changes contributing to CO2 emissions are not included in the bar (they are in the CO2 bar) | |
| 06:36, 30 September 2022 |  | 960 × 893 (30 KB) | আজিজ | File uploaded using svgtranslate tool (https://svgtranslate.toolforge.org/). Added translation for bn. | |
| 10:53, 10 September 2022 |  | 960 × 893 (24 KB) | Theklan | File uploaded using svgtranslate tool (https://svgtranslate.toolforge.org/). Added translation for eu. | |
| 14:29, 19 April 2022 |  | 960 × 893 (21 KB) | Jiaminglimjm | File uploaded using svgtranslate tool (https://svgtranslate.toolforge.org/). Added translation for id. | |
| 04:37, 10 January 2022 |  | 960 × 893 (17 KB) | TAKAHASHI Shuuji | File uploaded using svgtranslate tool (https://svgtranslate.toolforge.org/). Added translation for ja. | |
| 21:33, 15 August 2021 |  | 960 × 893 (13 KB) | Efbrazil | Source updated to AR6 / WG1 | |
| 15:56, 13 May 2020 |  | 960 × 807 (11 KB) | Nyq | Decapitalized common nouns | |
| 18:47, 26 March 2020 |  | 960 × 807 (11 KB) | Efbrazil | Tweaked positive color to match other chart color for consistency | |
| 21:55, 3 March 2020 |  | 960 × 807 (11 KB) | Efbrazil | Rebuilt the graphic from data. Changes: - SVG now has native text for translation and selection - Combined "other gases" into single bar - Label tweaks for easier reading (e.g. CH4 --> Methane) |
File usage
The following pages on the English Wikipedia use this file (pages on other projects are not listed):
- Atmospheric methane
- Carbon dioxide in Earth's atmosphere
- Causes of climate change
- Climate change
- Cloud feedback
- Gas venting
- Global dimming
- Greenhouse gas
- Radiative forcing
- Sulfur dioxide
- Talk:Climate change/Archive 76
- Talk:Climate change/Archive 93
- Talk:Global dimming
- Talk:Greenhouse gas
- User talk:InformationToKnowledge/sandbox
- Wikipedia:WikiProject Climate change/Figures
- Portal:Climate change
- Portal:Climate change/Selected article
- Portal:Climate change/Selected article/16
Global file usage
The following other wikis use this file:
- Usage on ar.wikipedia.org
- Usage on az.wikipedia.org
- Usage on bcl.wikipedia.org
- Usage on de.wikipedia.org
- Usage on dty.wikipedia.org
- Usage on el.wikipedia.org
- Usage on eu.wikipedia.org
- Usage on fa.wikipedia.org
- Usage on fr.wikipedia.org
- Usage on gl.wikipedia.org
- Usage on ha.wikipedia.org
- Usage on hi.wikipedia.org
- Usage on hi.wikibooks.org
- Usage on id.wikipedia.org
- Usage on ig.wikipedia.org
- Usage on is.wikipedia.org
- Usage on ko.wikipedia.org
- Usage on ms.wikipedia.org
- Usage on nl.wikipedia.org
- Usage on pt.wikipedia.org
- Usage on rw.wikipedia.org
- Usage on so.wikipedia.org
- Usage on sv.wikipedia.org
- Usage on te.wikipedia.org
- Usage on tr.wikipedia.org
- Usage on zh.wikipedia.org


