
File:Pearson type VII distribution PDF.svg

Original file (SVG file, nominally 400 × 300 pixels, file size: 74 KB)
| This is a file from the Wikimedia Commons. Information from its description page there is shown below. Commons is a freely licensed media file repository. You can help. |
Summary
| Description |
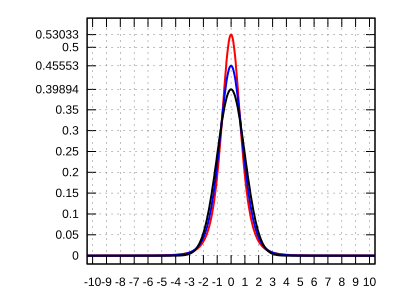
English: Probability density function of the Pearson type VII distribution
The red curve shows the limiting density with infinite kurtosis; the blue curve shows the density with kurtosis equal to 2; the black curve shows the limiting (normal) density with kurtosis identically zero. |
||||||
| Date | |||||||
| Source | MarkSweep | ||||||
| Author |
Vector: |
||||||
| Permission (Reusing this file) |
I, the copyright holder of this work, hereby publish it under the following license:
|
||||||
| Other versions |
File:Pearson_type_VII_distribution_log-PDF.svg File:Pearson_type_VII_distribution_PDF.png File:Pearson_type_VII_distribution_log-PDF.png |
||||||
| SVG development | |||||||
| Source code | Gnuplot code# the Pearson type VII log-pdf
log_p7(x,a2,m) = lgamma(m) - lgamma(m-0.5) - m*log(1+x*x/a2) - 0.5*log(a2*pi)
# the Pearson type VII log-pdf with unit variance and kurtosis k
f(x,k) = log_p7(x, 2+6.0/k, 2.5+3.0/k)
# the standard normal log-pdf (with unit variance and kurtosis 0)
n(x) = -0.5 * (x*x + log(2*pi))
# the limit of the Pearson type VII log-pdf for k -> infinity
g(x) = -2.5 * log(2 + x*x) + log(3)
set samples 1001
set grid
set xrange [-10.4:10.4]
set xtics 1
set yrange [-0.02:0.57]
set ytics (0, 0.05, 0.1, 0.15, 0.2, 0.25, 0.3, 0.35, 0.39894, 0.45553, 0.5, 0.53033)
set terminal svg size 400,300 enhanced fname 'DejaVu Sans' fsize 10 butt solid
set output 'Pearson type VII distribution PDF.svg'
plot exp(g(x)) lt 1 lw 2 notitle, \
exp(f(x,2)) lt 3 lw 2 notitle, \
exp(n(x)) lt 7 lw 2 notitle
|
Background
The Pearson type VII family of probability densities is a special case of the type IV family restricted to symmetric densities. The probability density function is given by
- Failed to parse (syntax error): {\displaystyle f(x; a^2, m) = \frac{\Gamma(m)}{\Gamma(m-1/2)\,\sqrt{a^2\,\pi}} \left(1+\frac{x^2}{a^2}\right)^{-m}. \!}
All densities in this family are symmetric with zero mean. Setting makes the variance equal to unity. Then the only free parameter is m, which controls the fourth moment (and cumulant) and hence the kurtosis. One can reparameterize with where k is the kurtosis to obtain a one-parameter leptokurtic family with zero mean, unit variance, zero skew, and arbitrary positive kurtosis k.


In the limit as one obtains the density


shown as the red curve. In the other direction as one obtains the standard normal density as the limiting distribution, shown as the black curve.

File history
Click on a date/time to view the file as it appeared at that time.
| Date/Time | Thumbnail | Dimensions | User | Comment | |
|---|---|---|---|---|---|
| current | 18:18, 26 May 2020 | | 400 × 300 (74 KB) | Andel | == {{int:filedesc}} == {{Information |description=|Description= {{en|1=Probability density function of the Pearson type VII distribution The red curve shows the limiting density with infinite kurtosis; the blue curve shows the density with kurtosis equal to 2; the black curve shows the limiting (normal) density with kurtosis identically zero.}} |date= 2020-05-26 |source=MarkSweep |author={{AutVec|{{U|MarkSweep}}|{{U|Andel}}|Pearson type VII distribution PDF.png}} |permissi... |
File usage
Global file usage
The following other wikis use this file:
- Usage on ca.wikipedia.org
- Usage on es.wikipedia.org
- Usage on no.wikipedia.org
- Usage on pt.wikipedia.org
- Usage on tr.wikipedia.org
- Usage on uk.wikipedia.org