
File:Logarithm derivative.svg

Size of this PNG preview of this SVG file: 375 × 243 pixels. Other resolutions: 320 × 207 pixels | 640 × 415 pixels | 1,024 × 664 pixels | 1,280 × 829 pixels | 2,560 × 1,659 pixels.
Original file (SVG file, nominally 375 × 243 pixels, file size: 44 KB)
| This is a file from the Wikimedia Commons. Information from its description page there is shown below. Commons is a freely licensed media file repository. You can help. |
Summary
| Description |
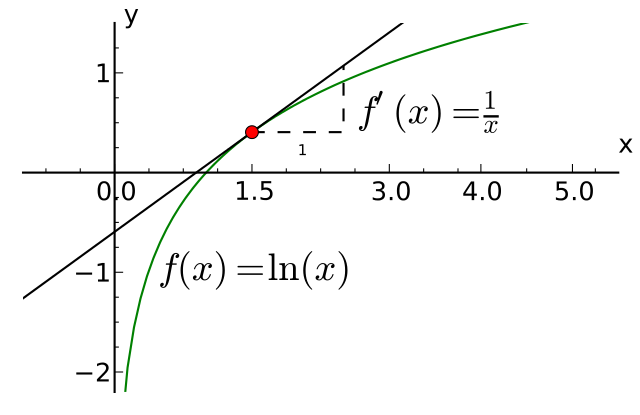
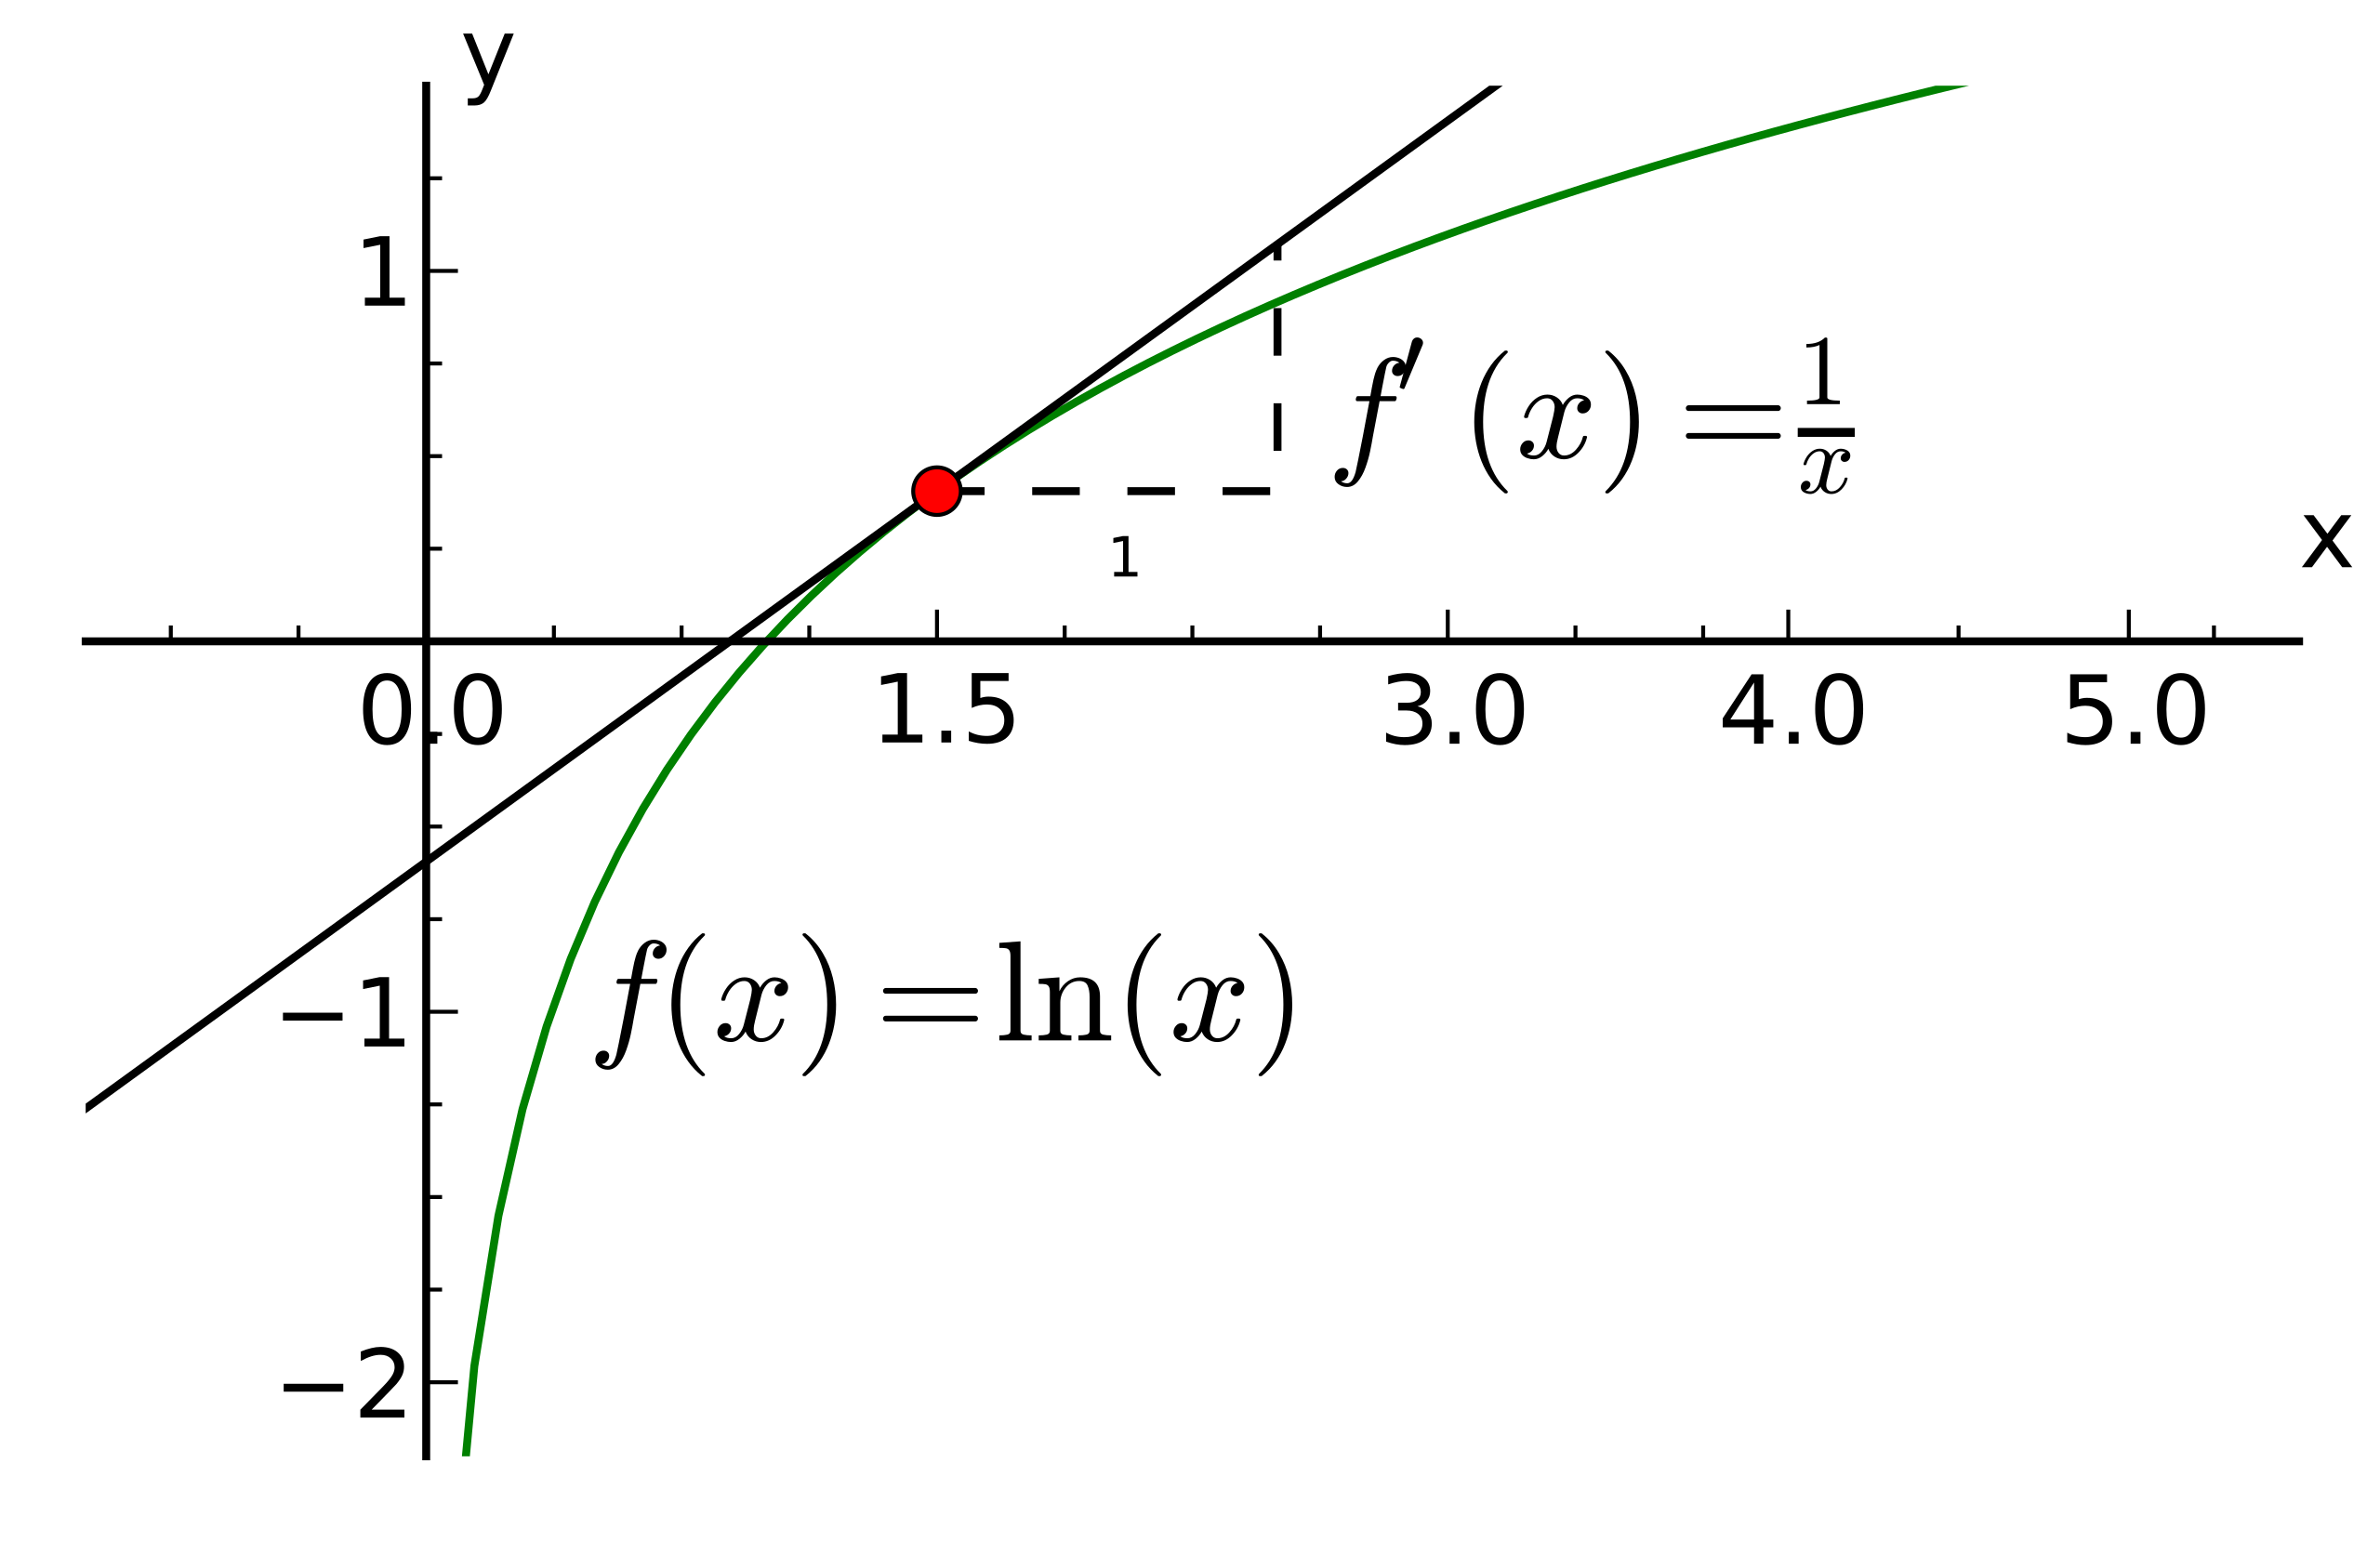
English: Graph of the logarithm and illustration of the derivative.
Created using python. from numpy import linspace,log
from matplotlib.pyplot import *
lineEQ = lambda k,a: log(a)+(k-a)/a
x1 = linspace(0,7,100)
y1 = log(x1)
x2 = linspace(-1.5,4,3)
y2 = lineEQ(x2,1.5)
x3 = [1.5,2.5,2.5]
y3 = [][0],1.5), lineEQ(x3[0],1.5), lineEQ(x3[1],1.5)]
fig = figure(figsize=(5,3))
ax = fig.add_subplot(111)
for direction in ["left","bottom"]:
ax.spines[direction].set_position('zero')
ax.spines[direction].set_smart_bounds(True)
for direction in ["right","top"]:
ax.spines[direction].set_color('none')
ax.xaxis.set_ticks_position('bottom')
ax.yaxis.set_ticks_position('left')
ax.grid(False)
ax.set_xticks([0,1.5,3,4,5])
ax.set_yticks([-2,-1,1])
ax.set_ylim(-2.2,1.5)
ax.set_xlim(-1,5.5)
ax.plot(x1,y1,'g',linewidth=1.)
ax.plot(x2,y2,'k',linewidth=1.)
ax.plot(x3,y3,'k--',linewidth=1.)
ax.plot(1.5,log(1.5),'ro')
ax.text(5.5,.2,"x")
ax.text(0.1,1.5,"y")
ax.text(4,1,r"$f(x)=\ln(x)$")
ax.text(2,.175,"1",fontsize=7)
ax.text(2.6,.5,r"$f^'(x)=\frac{1}{x}$",fontsize=12)
ax.minorticks_on()
#fig.show()
fig.savefig("Logarithm_derivative.svg",bbox_inches="tight",\
pad_inches=.15)
|
| Date | |
| Source | Own work |
| Author | Krishnavedala |
| Other versions | File:Logarithm_derivative.png |
W3C-validity not checked.
Licensing
I, the copyright holder of this work, hereby publish it under the following licenses:
This file is licensed under the Creative Commons Attribution-Share Alike 3.0 Unported license.
- You are free:
- to share – to copy, distribute and transmit the work
- to remix – to adapt the work
- Under the following conditions:
- attribution – You must give appropriate credit, provide a link to the license, and indicate if changes were made. You may do so in any reasonable manner, but not in any way that suggests the licensor endorses you or your use.
- share alike – If you remix, transform, or build upon the material, you must distribute your contributions under the same or compatible license as the original.

|
Permission is granted to copy, distribute and/or modify this document under the terms of the GNU Free Documentation License, Version 1.2 or any later version published by the Free Software Foundation; with no Invariant Sections, no Front-Cover Texts, and no Back-Cover Texts. A copy of the license is included in the section entitled GNU Free Documentation License. |
You may select the license of your choice.
File history
Click on a date/time to view the file as it appeared at that time.
| Date/Time | Thumbnail | Dimensions | User | Comment | |
|---|---|---|---|---|---|
| current | 15:25, 5 June 2011 | | 375 × 243 (44 KB) | JohnBlackburne | Make text bigger and rearrange for readability |
| 11:44, 5 June 2011 |  | 375 × 243 (32 KB) | Krishnavedala | {{Information |Description ={{en|1=Graph of the logarithm and illustration of the derivative. Created using python. <source lang="python"> from numpy import linspace,log from matplotlib.pyplot import * lineEQ = la |
File usage
The following pages on the English Wikipedia use this file (pages on other projects are not listed):
Global file usage
The following other wikis use this file:
- Usage on ast.wikipedia.org
- Usage on bg.wikipedia.org
- Usage on el.wikipedia.org
- Usage on es.wikipedia.org
- Usage on eu.wikipedia.org
- Usage on fa.wikipedia.org
- Usage on fa.wikibooks.org
- Usage on hu.wikipedia.org
- Usage on id.wikipedia.org
- Usage on mk.wikipedia.org
- Usage on pl.wikipedia.org
- Usage on pt.wikipedia.org
- Usage on ro.wikipedia.org
- Usage on vi.wikipedia.org
- Usage on vi.wikibooks.org
- Usage on zh.wikipedia.org