
File:Global Temperature And Forces.svg

Size of this PNG preview of this SVG file: 800 × 600 pixels. Other resolutions: 320 × 240 pixels | 640 × 480 pixels | 1,024 × 768 pixels | 1,280 × 960 pixels | 2,560 × 1,920 pixels | 960 × 720 pixels.
Original file (SVG file, nominally 960 × 720 pixels, file size: 24 KB)
| This is a file from the Wikimedia Commons. Information from its description page there is shown below. Commons is a freely licensed media file repository. You can help. |
Summary
| Description |
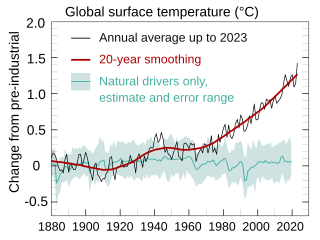
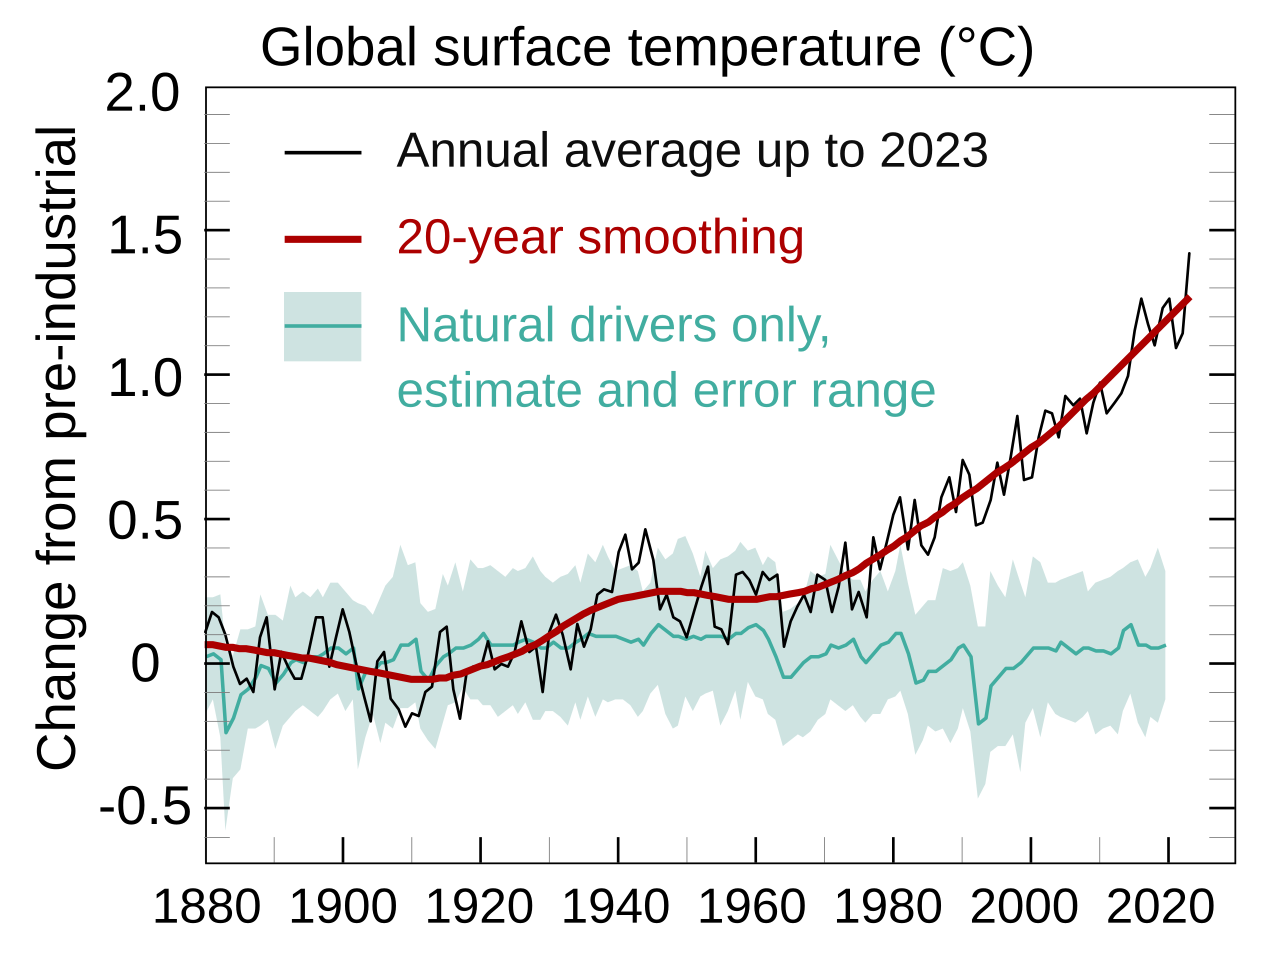
Deutsch: Veränderungen der globalen Oberflächentemperatur in den letzten 170 Jahren (schwarze Linie) im Vergleich zu 1850-1900. Temperaturangaben als Jahresdurchschnitt, verglichen mit den Resultaten der CMIP6-Klimamodell-Simulationen von menschlichen und natürlichen Einflüssen (rot) sowie nur natürlichen Einflüssen (solare und vulkanische Aktivität, grün). Die durchgezogenen farbigen Linien zeigen den Durchschnitt mehrerer Modelle und die farbigen Schattierungen zeigen die Bandbreite ("höchstwahrscheinlich") der Simulationen. Quelle: IPCC AR6 WGI, Abbildung SPM.1b, S. SPM-7.
English: Changes in global surface temperature from 1880 to 2023 (black line) relative to 1850–1900 average. Annual data from NASA here: https://climate.nasa.gov/vital-signs/global-temperature/. IPCC anomaly is 1.09 C average from 2011 to 2020 as per IPCC AR6 WG1 SPM pp5 A.1.2, so NASA data is offset to that number. Data does not go back to 1850 as datasets differ from 1850 to 1880 for NOAA, others (NASA starts in 1880, and all tend to agree from that point forward). 20-year LOWESS smooth matched to 20 year moving average as per IPCC AR6 standard for determining current warming levels. Natural influence based on CMIP6 climate model simulations of the temperature response to natural drivers only (solar and volcanic activity, green). Colored shade shows the "very likely" range of simulations. Source: IPCC AR6 WGI, Figure SPM.1b, p. SPM-7. This version has no Fahrenheit for easier localization, Fahrenheit version at File:Global Temperature And Forces With Fahrenheit.svg
Español: Cambios en la temperatura global de la superficie en los últimos 170 años (línea negra) en comparación con 1850-1900. Datos de temperatura como media anual, comparados con los resultados de las simulaciones de modelos climáticos CMIP6 de forzamientos humanos y naturales (rojo) y de forzamientos naturales solamente (actividad solar y volcánica, verde). Las líneas de color sólido muestran la media de varios modelos, y el sombreado de color muestra el rango ("muy probable") de las simulaciones. Origen: IPCC AR6 WGI, Figura SPM.1b, p. SPM-7.
Français : Changements de la température de surface mondiale lors des 170 dernières années (ligne noire) par rapport à l'ère pré-industrielle (1850-1900) et en moyenne annuelle, par rapport aux simulations du modèle climatique CMIP6 de la réponse de la température aux facteurs humains et naturels (rouge) et aux seuls facteurs naturels [soleil, volcanisme] (vert). Les lignes pleines en couleur montrent la moyenne multi-modèle ; les nuances colorées montrent la gamme de simulations ("très probable"). Source : fig SPM.1b, p. SPM-7 du GIEC AR6 WGI.
Català: Canvis de la temperatura de superfície mundial durant els últims 170 anys (línia negra) en relació amb l'època entre 1850 i 1900 i en mitjana anual, comparats amb els resultats de les simulacions de models climàtics CMIP6 de la resposta de la temperatura als factors humans i naturals (vermell) i només als factors naturals (activitat solar i volcànica, verd). Les línies sòlides de colors mostren la mitjana multi-model, i les ombres de color mostren el rang ("molt probable") de les simulacions. Font: IPCC AR6 WGI, Figure SPM.1b, p. SPM-7. |
| Date | |
| Source | Own work |
| Author | Efbrazil |
| Other versions |
|


Related file
-
 Global Temperature And Forces With Fahrenheit.svg
— has Fahrenheit scale

Licensing
I, the copyright holder of this work, hereby publish it under the following license:
This file is licensed under the Creative Commons Attribution-Share Alike 4.0 International license.
- You are free:
- to share – to copy, distribute and transmit the work
- to remix – to adapt the work
- Under the following conditions:
- attribution – You must give appropriate credit, provide a link to the license, and indicate if changes were made. You may do so in any reasonable manner, but not in any way that suggests the licensor endorses you or your use.
- share alike – If you remix, transform, or build upon the material, you must distribute your contributions under the same or compatible license as the original.
File history
Click on a date/time to view the file as it appeared at that time.
| Date/Time | Thumbnail | Dimensions | User | Comment | |
|---|---|---|---|---|---|
| current | 18:56, 16 February 2024 | | 960 × 720 (24 KB) | Efbrazil | Updated as per climate change talk page discussions, will detail changes in file description |
| 20:55, 29 January 2024 |  | 960 × 720 (26 KB) | Efbrazil | Updated to 2023, added 20-year trend line as per IPCC in place of confusing natural+human drivers CMIP calculation | |
| 13:50, 6 October 2023 |  | 960 × 720 (59 KB) | Joutbis | File uploaded using svgtranslate tool (https://svgtranslate.toolforge.org/). Added translation for ca. | |
| 05:43, 2 August 2023 |  | 960 × 720 (58 KB) | Teek36 | File uploaded using svgtranslate tool (https://svgtranslate.toolforge.org/). Added translation for fr. | |
| 14:56, 10 May 2023 |  | 960 × 720 (56 KB) | Sonne7 | Changes in german translation: 1. vertical text now 'Veränderung zu vor-industriell' (which is now more according to the English original text and includes also the '-'-sign to emphasize on the first syllable) and changed for it the vertically text position (accordingly to the now greater length of this text) + 2. headline text now extented with the postfix text '(°C)' (although now accordingly to the english original content) | |
| 18:56, 17 October 2022 |  | 960 × 720 (56 KB) | Hedgehoque | File uploaded using svgtranslate tool (https://svgtranslate.toolforge.org/). Added translation for de. | |
| 13:28, 23 January 2022 |  | 960 × 720 (54 KB) | Femke | File uploaded using svgtranslate tool (https://svgtranslate.toolforge.org/). Added translation for nl. | |
| 10:44, 8 January 2022 |  | 960 × 720 (53 KB) | TAKAHASHI Shuuji | File uploaded using svgtranslate tool (https://svgtranslate.toolforge.org/). Added translation for ja. | |
| 07:12, 8 January 2022 |  | 960 × 720 (53 KB) | TAKAHASHI Shuuji | File uploaded using svgtranslate tool (https://svgtranslate.toolforge.org/). Added translation for ja. | |
| 15:46, 24 December 2021 |  | 960 × 720 (51 KB) | Srđan | File uploaded using svgtranslate tool (https://svgtranslate.toolforge.org/). Added translation for bs. |
File usage
The following pages on the English Wikipedia use this file (pages on other projects are not listed):
Global file usage
The following other wikis use this file:
- Usage on ar.wikipedia.org
- Usage on az.wikipedia.org
- Usage on bs.wikipedia.org
- Usage on ca.wikipedia.org
- Usage on de.wikipedia.org
- Usage on fr.wikipedia.org
- Usage on ha.wikipedia.org
- Usage on it.wikipedia.org
- Usage on ja.wikipedia.org
- Usage on ka.wikipedia.org
- Usage on ko.wikipedia.org
- Usage on ku.wikipedia.org
- Usage on nds.wikipedia.org
- Usage on nl.wikipedia.org
- Usage on ro.wikipedia.org
- Usage on sv.wikipedia.org
- Usage on vi.wikipedia.org