
File:GDP depression.svg

Size of this PNG preview of this SVG file: 800 × 572 pixels. Other resolutions: 320 × 229 pixels | 640 × 458 pixels | 1,024 × 732 pixels | 1,280 × 915 pixels | 2,560 × 1,830 pixels.
Original file (SVG file, nominally 1,024 × 732 pixels, file size: 28 KB)
| This is a file from the Wikimedia Commons. Information from its description page there is shown below. Commons is a freely licensed media file repository. You can help. |
| Description |
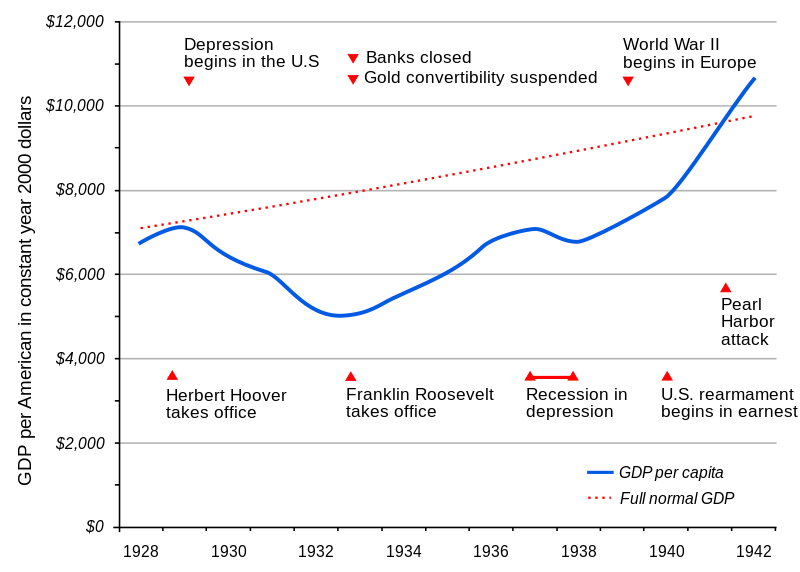
English: Chart of per-capita real GDP during the Great Depression with significant events noted. The red line shows an estimate of full-employment output for reference.
العربية: المسار العام للكساد في الولايات المتحدة، كما ينعكس في نصيب الفرد من الناتج المحلي الإجمالي الموضح بالدولار الثابت لعام 2000، بالإضافة إلى بعض الأحداث الرئيسية في تلك الفترة. خط أحمر منقط = اتجاه طويل الأمد 1920-1970. |
||
| Date | |||
| Source |
Own work. Derived from |
||
| Author | cflm (talk) | ||
| Permission (Reusing this file) |
I, the copyright holder of this work, hereby publish it under the following licenses:
This file is licensed under the Creative Commons Attribution-Share Alike 3.0 Unported license.
You may select the license of your choice. |
||
| Other versions |
  |

File history
Click on a date/time to view the file as it appeared at that time.
| Date/Time | Thumbnail | Dimensions | User | Comment | |
|---|---|---|---|---|---|
| current | 11:12, 27 August 2009 | | 1,024 × 732 (28 KB) | Cflm001 | that line was supposed to be black |
| 11:09, 27 August 2009 |  | 1,024 × 732 (30 KB) | Cflm001 | {{Information |Description={{en|1=Chart of per-capita real GDP during the Great Depression with significant events noted. The red line shows an estimate of full-employment output for reference.}} |Source=Own work. Derived from [[File:GDP depression.jpg|35 |
File usage
The following pages on the English Wikipedia use this file (pages on other projects are not listed):
Global file usage
The following other wikis use this file:
- Usage on en.wikiversity.org
- Usage on sq.wikipedia.org
- Usage on zh.wikipedia.org