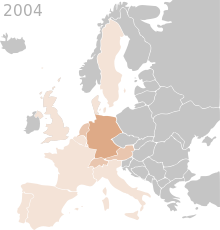
File:Europe WattPerCapita animated sequence 1992-2014.gif

Page contents not supported in other languages.
This is a file from the Wikimedia Commons
From Wikipedia, the free encyclopedia

Europe_WattPerCapita_animated_sequence_1992-2014.gif(401 × 420 pixels, file size: 497 KB, MIME type: image/gif, looped, 29 frames, 35 s)

Summary

Description
English: Animation of European growth of photovoltaics in watts per person since 1992. This is the cumulative capacity of domestic solar PV installations divided by the country's population by the end of each year. Provisional slide for year 2015 is not yet included. Capacity per capita is given in watt-peak (Wp/capita).
 <0.1 watt or unknown
   0.1–1 watt per inhabitant
   1–10 watts per inhabitant
  10–50 watts per inhabitant
  50–100 watts per inhabitant
 100–150 watts per inhabitant
 150–200 watts per inhabitant
 200–300 watts per inhabitant
 300–450 watts per inhabitant
 450–600 watts per inhabitant
Date
Source

Own work. Sources

  • EPIA, IEA-PVPS, PV Barometer
  • For detailed figures see file description for each of the listed slides below
  • alternative sources citations used in in growth of photovoltaics and country specific articles
 
This GIF graphic was created with GIMP.
Author Rfassbind
Other versions

Single frames used to create animated GIF.

  • Single frames/ yearly slides listed below.
  • Interval of animated GIF set to 1200ms.
  • Before animation, SVG images were converted into PNGs and had their transparency removed.
  • Duration 6x for final year of sequence.
  • Looped indefinitely.
MapEuropeSmall WattPerCapita 1992
MapEuropeSmall WattPerCapita 1993
MapEuropeSmall WattPerCapita 1994
MapEuropeSmall WattPerCapita 1995
MapEuropeSmall WattPerCapita 1996
MapEuropeSmall WattPerCapita 1997
MapEuropeSmall WattPerCapita 1998
MapEuropeSmall WattPerCapita 1999
MapEuropeSmall WattPerCapita 2000
MapEuropeSmall WattPerCapita 2001
MapEuropeSmall WattPerCapita 2002
MapEuropeSmall WattPerCapita 2003
MapEuropeSmall WattPerCapita 2004
MapEuropeSmall WattPerCapita 2005
MapEuropeSmall WattPerCapita 2006
MapEuropeSmall WattPerCapita 2007
MapEuropeSmall WattPerCapita 2008
MapEuropeSmall WattPerCapita 2009
MapEuropeSmall WattPerCapita 2010
MapEuropeSmall WattPerCapita 2011
MapEuropeSmall WattPerCapita 2012
MapEuropeSmall WattPerCapita 2013
MapEuropeSmall WattPerCapita 2014
Early, very tentative estimate of 2015 (working version).

Licensing

Public domain I, the copyright holder of this work, release this work into the public domain. This applies worldwide.
In some countries this may not be legally possible; if so:
I grant anyone the right to use this work for any purpose, without any conditions, unless such conditions are required by law.

Captions

Add a one-line explanation of what this file represents

Items portrayed in this file

depicts

7 May 2015

File history

Click on a date/time to view the file as it appeared at that time.

Date/TimeThumbnailDimensionsUserComment
current11:42, 7 May 2015Thumbnail for version as of 11:42, 7 May 2015401 × 420 (497 KB)Rfassbindincluding map of 2014 (version: all slides as of May 7, 2015)
00:20, 30 August 2014Thumbnail for version as of 00:20, 30 August 2014332 × 348 (358 KB)Rfassbindextended time displayed for last frame (2013) by a factor of four (4 duplicated layers)
16:38, 15 July 2014Thumbnail for version as of 16:38, 15 July 2014332 × 348 (299 KB)Rfassbindcolor fixes for countiresː DEN, SWE, TUR, UKR, for years 1993-2005, 2009-2011, and 2013.
07:03, 15 July 2014Thumbnail for version as of 07:03, 15 July 2014332 × 348 (297 KB)RfassbindAdded years 1992-2003, GIMP animation intervall set to 1500ms
20:16, 15 June 2014Thumbnail for version as of 20:16, 15 June 2014332 × 348 (141 KB)RfassbindAdded years 2004-2007. Total timespan now 2004-2013
18:45, 15 June 2014Thumbnail for version as of 18:45, 15 June 2014332 × 348 (87 KB)RfassbindUser created page with UploadWizard

Global file usage

Metadata