
File:Edgton population change graph.jpg
No higher resolution available.
Edgton_population_change_graph.jpg (558 × 329 pixels, file size: 44 KB, MIME type: image/jpeg)
Summary[edit]
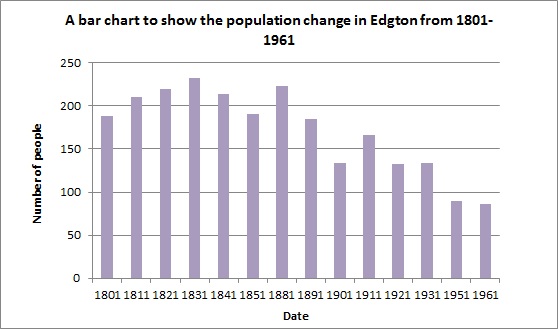
| Description |
A bar chart to show the population change in Edgton from 1801-1921 |
|---|---|
| Source |
I created the graph in Microsoft excel |
| Date |
2012-03-17 |
| Author | |
| Permission (Reusing this file) |
See below.
|
- Other information
I got the data to make the graph from the Vision of Britain website.
Licensing[edit]
I, the copyright holder of this work, hereby publish it under the following licenses:
 | Permission is granted to copy, distribute and/or modify this document under the terms of the GNU Free Documentation License, Version 1.2 or any later version published by the Free Software Foundation; with no Invariant Sections, no Front-Cover Texts, and no Back-Cover Texts. |
| This work is licensed under the Creative Commons Attribution-ShareAlike 3.0 License. |
You may select the license of your choice.
 | This file is a candidate to be copied to Wikimedia Commons.
Any user may perform this transfer; refer to Wikipedia:Moving files to Commons for details. If this file has problems with attribution, copyright, or is otherwise ineligible for Commons, then remove this tag and DO NOT transfer it; repeat violators may be blocked from editing. Other Instructions
| ||
| |||
File history
Click on a date/time to view the file as it appeared at that time.
| Date/Time | Thumbnail | Dimensions | User | Comment | |
|---|---|---|---|---|---|
| current | 14:12, 17 March 2012 | | 558 × 329 (44 KB) | Hannahritchie26 (talk | contribs) | Uploading a self-made file using File Upload Wizard |
You cannot overwrite this file.
File usage
The following pages on the English Wikipedia use this file (pages on other projects are not listed):