
File:Cumulative vs normal histogram.svg

Size of this PNG preview of this SVG file: 800 × 400 pixels. Other resolutions: 320 × 160 pixels | 640 × 320 pixels | 1,024 × 512 pixels | 1,280 × 640 pixels | 2,560 × 1,280 pixels | 900 × 450 pixels.
Original file (SVG file, nominally 900 × 450 pixels, file size: 52 KB)
| This is a file from the Wikimedia Commons. Information from its description page there is shown below. Commons is a freely licensed media file repository. You can help. |
Summary
| Description |
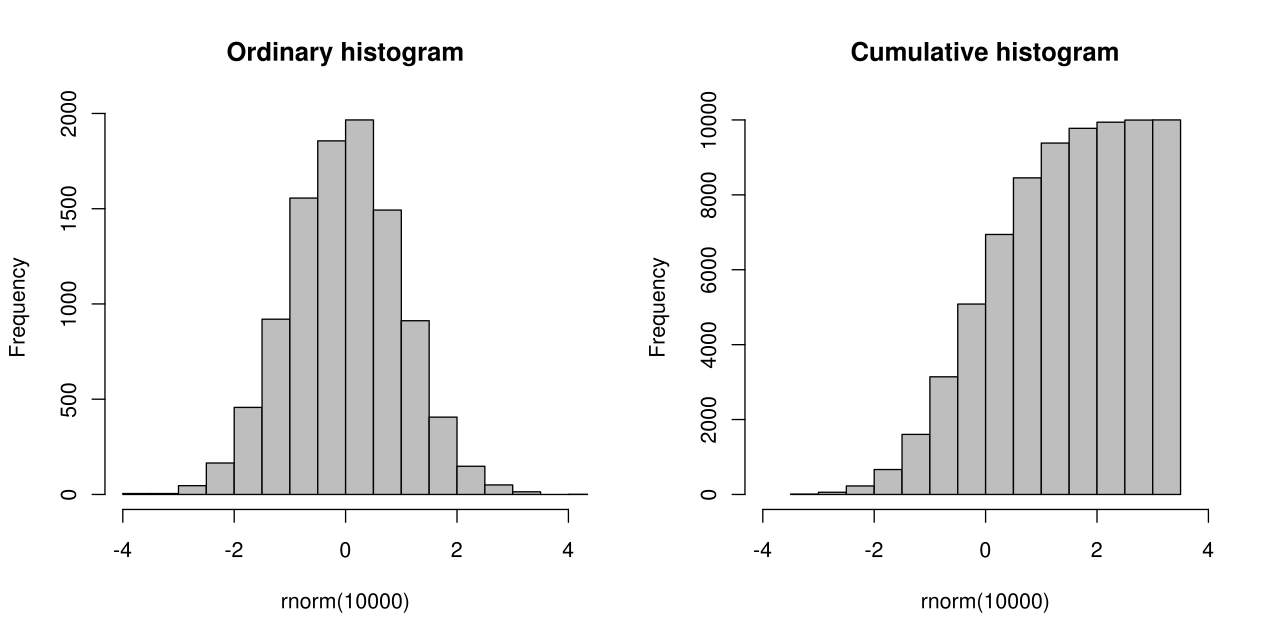
English: A plot showing a regular and a cumulative histogram of the same data. The data shown is 10,000 points randomly sampled from a normal distribution with mean of 0 and standard deviation of 1.
Figure generated in R |
| Date | |
| Source | Own work |
| Author | Kierano |
| Other versions | Derivative works of this file: Cumulative vs normal histogram cz.svg |
Licensing
I, the copyright holder of this work, hereby publish it under the following licenses:
This file is licensed under the Creative Commons Attribution-Share Alike 3.0 Unported license.
- You are free:
- to share – to copy, distribute and transmit the work
- to remix – to adapt the work
- Under the following conditions:
- attribution – You must give appropriate credit, provide a link to the license, and indicate if changes were made. You may do so in any reasonable manner, but not in any way that suggests the licensor endorses you or your use.
- share alike – If you remix, transform, or build upon the material, you must distribute your contributions under the same or compatible license as the original.

|
Permission is granted to copy, distribute and/or modify this document under the terms of the GNU Free Documentation License, Version 1.2 or any later version published by the Free Software Foundation; with no Invariant Sections, no Front-Cover Texts, and no Back-Cover Texts. A copy of the license is included in the section entitled GNU Free Documentation License. |
You may select the license of your choice.
File history
Click on a date/time to view the file as it appeared at that time.
| Date/Time | Thumbnail | Dimensions | User | Comment | |
|---|---|---|---|---|---|
| current | 09:27, 6 April 2009 | | 900 × 450 (52 KB) | Kierano | Changed "plain" to "ordinary" - I think it's a clearer word. |
| 09:22, 6 April 2009 |  | 900 × 450 (51 KB) | Kierano | Used a grey fill to make the bars clearer. | |
| 09:14, 6 April 2009 |  | 900 × 450 (49 KB) | Kierano | {{Information |Description={{en|1=A plot showing a regular and a cumulative histogram of the same data. The data shown is 10,000 points randomly sampled from a normal distribution with mean of 0 and standard deviation of 1.}} |Source=Own work by uploader |
File usage
The following pages on the English Wikipedia use this file (pages on other projects are not listed):
Global file usage
The following other wikis use this file:
- Usage on he.wikipedia.org
- Usage on hu.wikipedia.org
- Usage on id.wikipedia.org
- Usage on ja.wikipedia.org
- Usage on ms.wikipedia.org
- Usage on pt.wikipedia.org
- Usage on sl.wikipedia.org
- Usage on tr.wikipedia.org
- Usage on uz.wikipedia.org