
File:Channel Capacity with Power- and Bandwidth-Limited Regimes.png
Size of this preview: 800 × 594 pixels. Other resolutions: 320 × 238 pixels | 640 × 475 pixels | 1,024 × 761 pixels | 1,217 × 904 pixels.
Original file (1,217 × 904 pixels, file size: 71 KB, MIME type: image/png)
| This is a file from the Wikimedia Commons. Information from its description page there is shown below. Commons is a freely licensed media file repository. You can help. |
Summary
| Description |
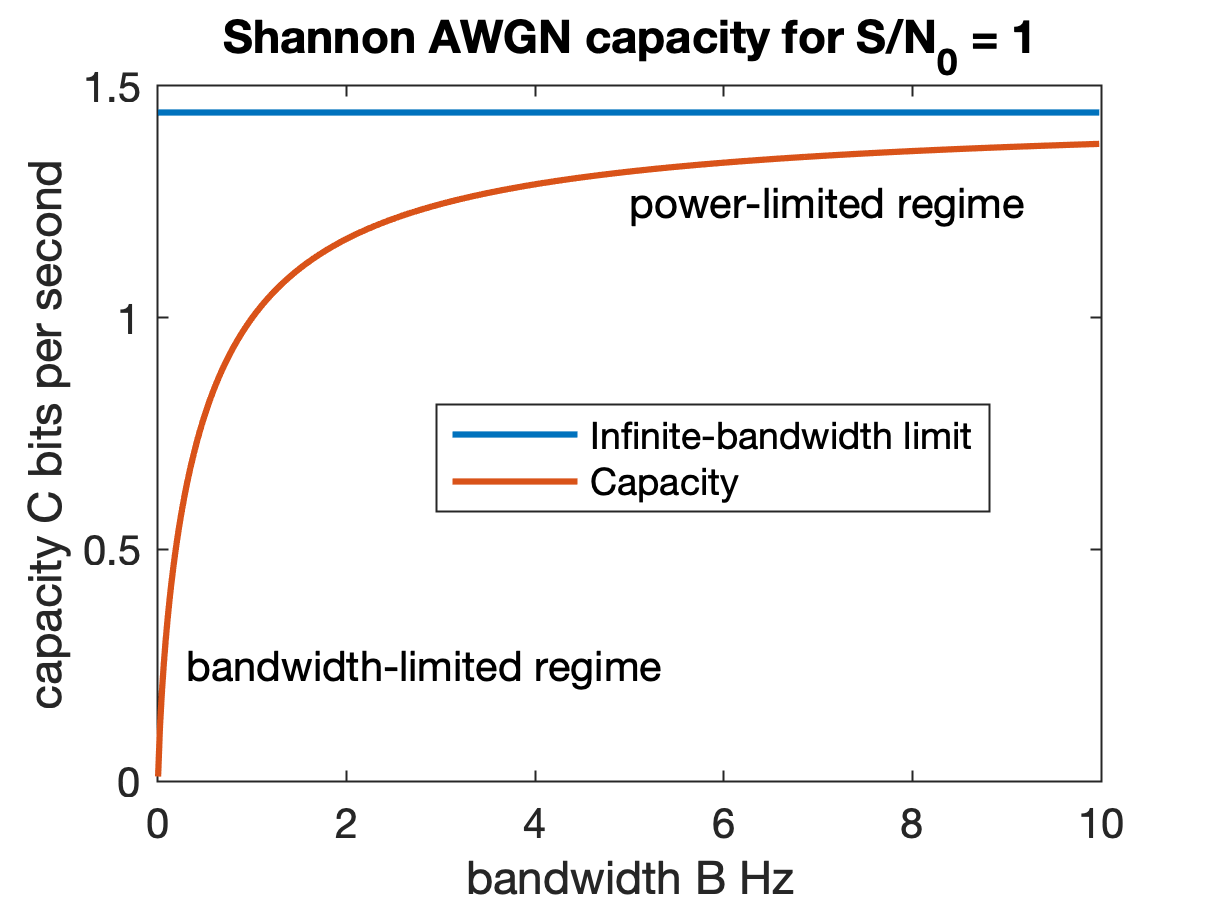
English: I am the originator of this image. I created the plot using MATLAB based on the formulas in the article. The diagram shows the channel capacity of an AWGN channel, indicating the bandwidth-limited region and the power-limited. |
| Date | 5 July 2010 (original upload date) |
| Source | Transferred from en.wikipedia to Commons by Sreejithk2000 using CommonsHelper. |
| Author | Isheden at English Wikipedia |
This diagram was created with MATLAB.
Licensing
Isheden at the English Wikipedia, the copyright holder of this work, hereby publishes it under the following license:

|
Permission is granted to copy, distribute and/or modify this document under the terms of the GNU Free Documentation License, Version 1.2 or any later version published by the Free Software Foundation; with no Invariant Sections, no Front-Cover Texts, and no Back-Cover Texts. A copy of the license is included in the section entitled GNU Free Documentation License. |
Original upload log
The original description page was here. All following user names refer to en.wikipedia.
- 2010-07-07 11:15 Isheden 700×452× (5141 bytes) I am the originator of this image. I created the plot using MATLAB based on the formulas in the article. The diagram showa the channel capacity of an AWGN channel, indicating the bandwidth-limited region and the power-limited region.
- 2010-07-06 07:20 Isheden 700×452× (5141 bytes) AWGN channel capacity with power-limited regime and bandwidth-limited regime indicated. Image free for use!
- 2010-07-05 09:56 Isheden 700×452× (5141 bytes) AWGN channel capacity with power-limited regime and bandwidth-limited regime indicated. Image free for use!
File history
Click on a date/time to view the file as it appeared at that time.
| Date/Time | Thumbnail | Dimensions | User | Comment | |
|---|---|---|---|---|---|
| current | 22:13, 26 September 2019 | | 1,217 × 904 (71 KB) | Dicklyon | Less pixelated; readable at smaller scale; normalized to S/N_0 = 1. |
| 11:04, 9 July 2010 |  | 700 × 452 (5 KB) | File Upload Bot (Magnus Manske) | {{BotMoveToCommons|en.wikipedia|year={{subst:CURRENTYEAR}}|month={{subst:CURRENTMONTHNAME}}|day={{subst:CURRENTDAY}}}} {{Information |Description={{en|I am the originator of this image. I created the plot using MATLAB based on the formulas in the article |
File usage
The following pages on the English Wikipedia use this file (pages on other projects are not listed):
Global file usage
The following other wikis use this file:
- Usage on ar.wikipedia.org
- Usage on ca.wikipedia.org
- Usage on fr.wikipedia.org