
File:COVID-19 outbreak the Netherlands per capita cases map (last 14 days).svg

Size of this PNG preview of this SVG file: 509 × 599 pixels. Other resolutions: 204 × 240 pixels | 407 × 480 pixels | 652 × 768 pixels | 869 × 1,024 pixels | 1,739 × 2,048 pixels | 512 × 603 pixels.
Original file (SVG file, nominally 512 × 603 pixels, file size: 138 KB)
| This is a file from the Wikimedia Commons. Information from its description page there is shown below. Commons is a freely licensed media file repository. You can help. |
.svg)
Summary
| Description |
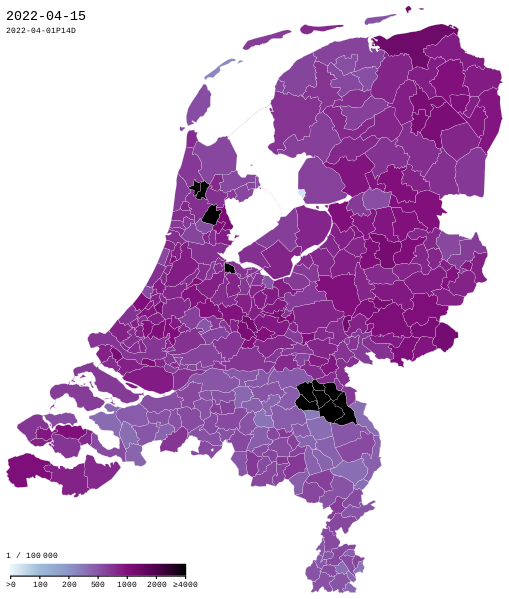
English: COVID-19 in the Netherlands - Rolling 14-day prevalence by municipality per 100,000 residents. Gradient steps: 0 > 0 100 200 500 1000 2000 ≥ 4000 |
| Data table | Data:COVID-19 outbreak the Netherlands per capita cases map.tab |
| Date | |
| Source |
|
| Author | Xplus1 |
| SVG development | This map was created with an unknown SVG tool. |
| Camera location | | View this and other nearby images on: OpenStreetMap |
|---|
.svg¶ms=052.190000_N_0005.330000_E_globe:Earth_type:camera__&language=en)
Licensing
I, the copyright holder of this work, hereby publish it under the following license:
This file is licensed under the Creative Commons Attribution-Share Alike 4.0 International license.
- You are free:
- to share – to copy, distribute and transmit the work
- to remix – to adapt the work
- Under the following conditions:
- attribution – You must give appropriate credit, provide a link to the license, and indicate if changes were made. You may do so in any reasonable manner, but not in any way that suggests the licensor endorses you or your use.
- share alike – If you remix, transform, or build upon the material, you must distribute your contributions under the same or compatible license as the original.
File history
Click on a date/time to view the file as it appeared at that time.
.svg&dir=prev)
.svg&offset=20220404154234)
.svg&offset=&limit=20)
.svg&offset=&limit=50)
.svg&offset=&limit=100)
.svg&offset=&limit=250)
.svg&offset=&limit=500)
| Date/Time | Thumbnail | Dimensions | User | Comment | |
|---|---|---|---|---|---|
| current | 15:42, 15 April 2022 | | 512 × 603 (138 KB) | XplusMapBot | data 2022-04-01 - 2022-04-15, 131.472 total, map diff: -17.176 = -11.55% |
| 15:42, 14 April 2022 |  | 512 × 603 (138 KB) | XplusMapBot | data 2022-03-31 - 2022-04-14, 148.648 total, map diff: -20.244 = -11.99% | |
| 15:42, 13 April 2022 |  | 512 × 603 (138 KB) | XplusMapBot | data 2022-03-30 - 2022-04-13, 168.892 total, map diff: -22.405 = -11.71% | |
| 15:42, 12 April 2022 |  | 512 × 603 (138 KB) | XplusMapBot | data 2022-03-29 - 2022-04-12, 191.297 total, map diff: -23.676 = -11.01% | |
| 15:42, 11 April 2022 |  | 512 × 603 (138 KB) | XplusMapBot | data 2022-03-28 - 2022-04-11, 214.973 total, map diff: -49.863 = -18.83% | |
| 15:42, 8 April 2022 |  | 512 × 603 (138 KB) | XplusMapBot | data 2022-03-25 - 2022-04-08, 264.836 total, map diff: -23.601 = -8.18% | |
| 15:42, 7 April 2022 |  | 512 × 603 (139 KB) | XplusMapBot | data 2022-03-24 - 2022-04-07, 288.437 total, map diff: -34.502 = -10.68% | |
| 15:42, 6 April 2022 |  | 512 × 603 (139 KB) | XplusMapBot | data 2022-03-23 - 2022-04-06, 322.939 total, map diff: -29.034 = -8.25% | |
| 15:42, 5 April 2022 |  | 512 × 603 (139 KB) | XplusMapBot | data 2022-03-22 - 2022-04-05, 351.973 total, map diff: -25.955 = -6.87% | |
| 15:42, 4 April 2022 |  | 512 × 603 (139 KB) | XplusMapBot | data 2022-03-21 - 2022-04-04, 377.928 total, map diff: -20.610 = -5.17% |
File usage
No pages on the English Wikipedia use this file (pages on other projects are not listed).
Global file usage
The following other wikis use this file:
- Usage on es.wikipedia.org
- Usage on fa.wikipedia.org
- Usage on pt.wikipedia.org
- Usage on www.wikidata.org
.svg)