
File:Battery-cost-learning-curve.png
Original file (1,773 × 2,106 pixels, file size: 188 KB, MIME type: image/png)
| This is a file from the Wikimedia Commons. Information from its description page there is shown below. Commons is a freely licensed media file repository. You can help. |

|
This graph image could be re-created using vector graphics as an SVG file. This has several advantages; see Commons:Media for cleanup for more information. If an SVG form of this image is available, please upload it and afterwards replace this template with
{{vector version available|new image name}}.
It is recommended to name the SVG file “Battery-cost-learning-curve.svg”—then the template Vector version available (or Vva) does not need the new image name parameter. |
Summary
| Description |
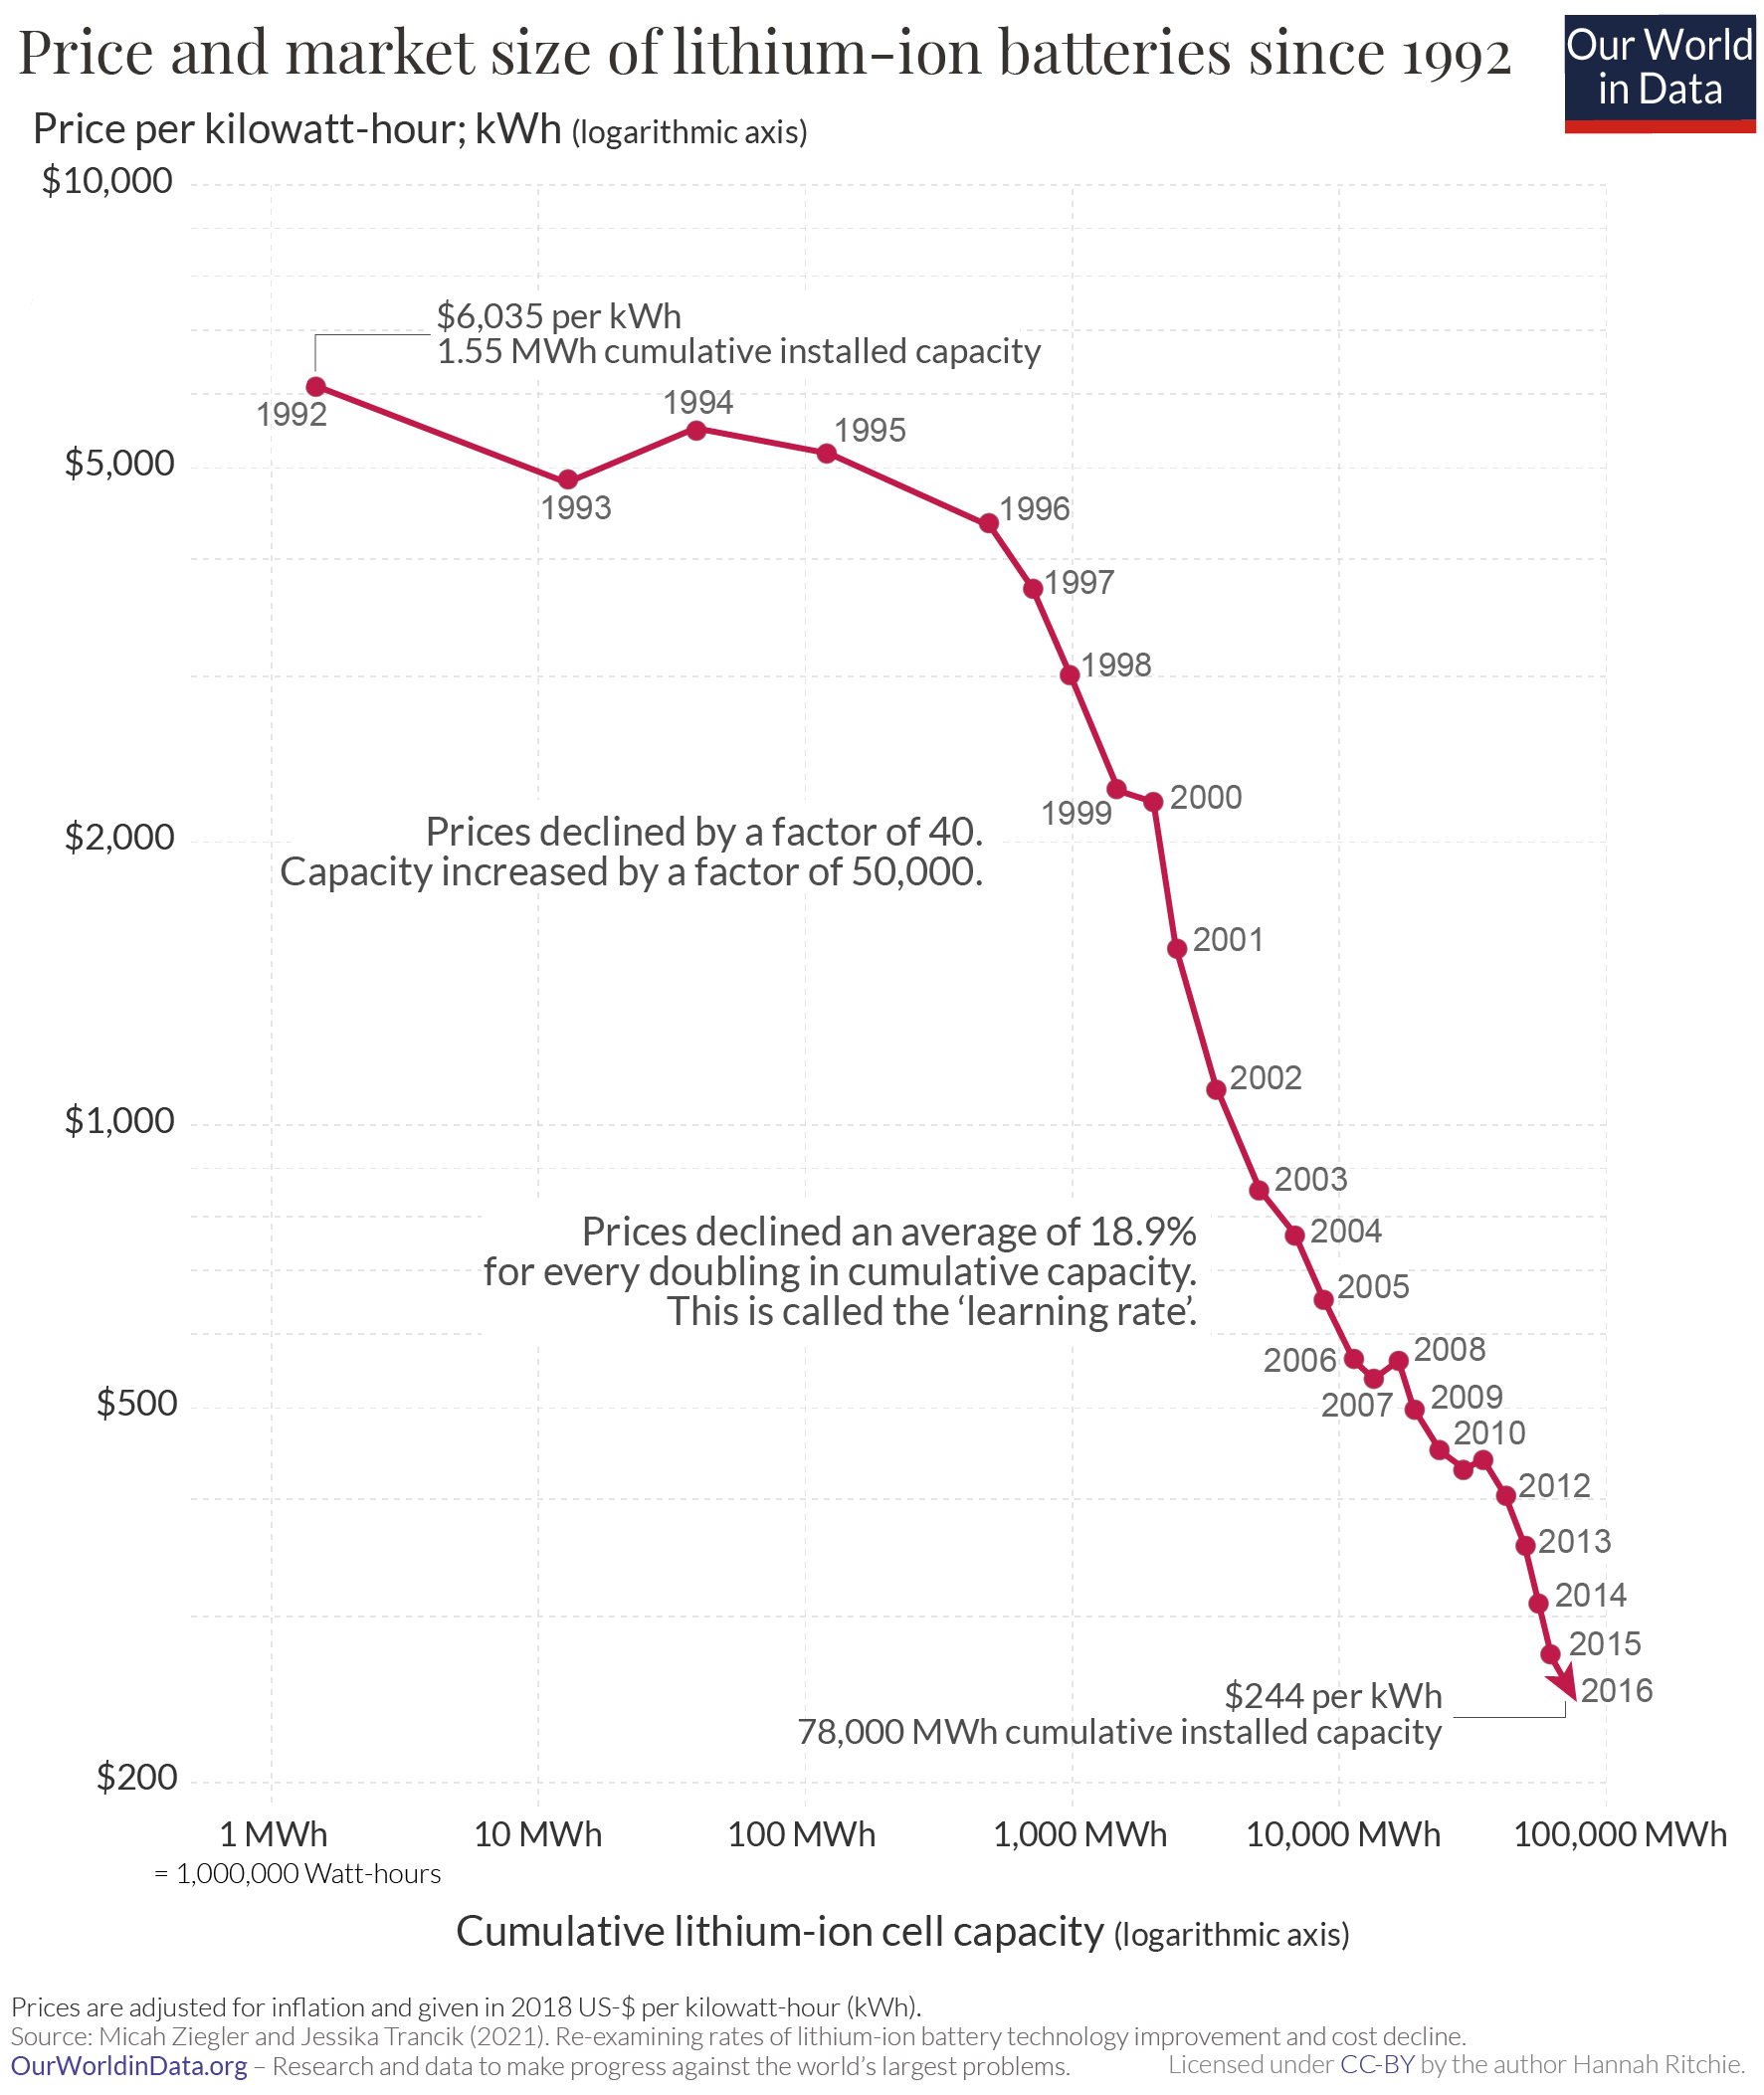
English: Batteries and electricity storage follow learning curves too
One of the downsides of renewable sources is their intermittent supply cycle. The sun doesn’t always shine and the wind doesn’t always blow. Technologies like batteries that store electric power are key to balance the changing supply from renewables with the inflexible demand for electricity. Fortunately electricity storage technologies are also among the few technologies that are following learning curves – their learning curve are indeed very steep, as the chart here shows. This chart is from my colleague Hannah Ritchie; she documents in her article that the price of batteries declined by 97% in the last three decades.41 At their current price there might only be demand for five large power storage systems in the world, but as a prediction for the future this might sound foolish one day (if you don’t know what I’m alluding to, you skipped reading the text in the fold-out box above). |
| Date | |
| Source | https://ourworldindata.org/cheap-renewables-growth |
| Author | Max Roser |
Licensing
- You are free:
- to share – to copy, distribute and transmit the work
- to remix – to adapt the work
- Under the following conditions:
- attribution – You must give appropriate credit, provide a link to the license, and indicate if changes were made. You may do so in any reasonable manner, but not in any way that suggests the licensor endorses you or your use.
- share alike – If you remix, transform, or build upon the material, you must distribute your contributions under the same or compatible license as the original.
File history
Click on a date/time to view the file as it appeared at that time.
| Date/Time | Thumbnail | Dimensions | User | Comment | |
|---|---|---|---|---|---|
| current | 10:48, 8 October 2021 | | 1,773 × 2,106 (188 KB) | PJ Geest | Uploaded a work by Max Roser from https://ourworldindata.org/cheap-renewables-growth with UploadWizard |
File usage
Global file usage
The following other wikis use this file:
- Usage on ca.wikipedia.org
- Usage on de.wikipedia.org
- Usage on es.wikipedia.org
- Usage on fa.wikipedia.org
- Usage on fr.wikipedia.org
- Usage on it.wikipedia.org
- Usage on ko.wikipedia.org
- Usage on nl.wikipedia.org
- Usage on ru.wikipedia.org
- Usage on uk.wikipedia.org
- Usage on vi.wikipedia.org