
File:After tax household income in the US.svg

Size of this PNG preview of this SVG file: 483 × 599 pixels. Other resolutions: 193 × 240 pixels | 387 × 480 pixels | 619 × 768 pixels | 826 × 1,024 pixels | 1,652 × 2,048 pixels | 750 × 930 pixels.
Original file (SVG file, nominally 750 × 930 pixels, file size: 16 KB)
| This is a file from the Wikimedia Commons. Information from its description page there is shown below. Commons is a freely licensed media file repository. You can help. |
Summary
| Description |
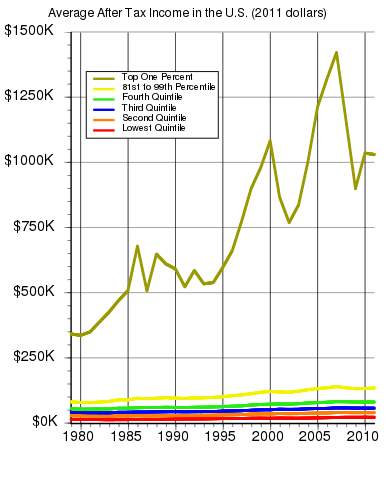
English: After tax household income in the United States for each quintile from 1979 to 2011. The percentage increase (inflation adjusted) in the lowest quintile was 48%, in the second quintile, 37%, in the third quintile 35%, in the fourth quintile 45%, for the 81st to 99th percentile 64%, and for the top one percent, 200%. Data source: The Distribution of Household Income and Federal Taxes, 2011 |
| Date | |
| Source | Own work |
| Author | Delphi234 |
Generated with Wikimedia SVG Chart
| Data format | The source data of the chart is in the SVG image file in a clearly readable format. You see the original numbers inside of the SVG file in the form of a list such as this:
... 1995 10.06 1996 11.75 1997 12.45 ... |
| Content of SVG | To view the data download the SVG file itself. To do so right-click this link, and then choose the option to save: File:After tax household income in the US.svg. Launch any text editor. Open the downloaded SVG file with the text editor (usually; file menu, open). To see the list of data, search for the phrase id="graph1". |
| Please, do not use a special SVG editor such as Inkscape; the readability of the database would be destroyed. You can edit the SVG file with any text editor, for example; en: List of text editors. You can view the edited SVG file in various web browsers. As of 2011, all major desktop browsers, and many minor ones, have some level of SVG support. See: en: Scalable Vector Graphics#Support for SVG in web browsers. When satisfied with your edits, upload the edited SVG file with the link labeled "Upload a new version of this file".
W3C-validity not checked. This chart was created with Wikimedia SVG Chart. This chart uses embedded text/digits. |
|
| Code to generate SVG | See: File talk:After tax household income in the US.svg. Documentation see: Wikimedia SVG Chart. |

|
This file may be updated to reflect new information. If you wish to use a specific version of the file without new updates being mirrored, please upload the required version as a separate file. |
Licensing
I, the copyright holder of this work, hereby publish it under the following license:
| This file is made available under the Creative Commons CC0 1.0 Universal Public Domain Dedication. | |
| The person who associated a work with this deed has dedicated the work to the public domain by waiving all of their rights to the work worldwide under copyright law, including all related and neighboring rights, to the extent allowed by law. You can copy, modify, distribute and perform the work, even for commercial purposes, all without asking permission.
|
File history
Click on a date/time to view the file as it appeared at that time.
| Date/Time | Thumbnail | Dimensions | User | Comment | |
|---|---|---|---|---|---|
| current | 07:20, 16 April 2016 | | 750 × 930 (16 KB) | Delphi234 | legend |
| 01:05, 16 March 2016 |  | 750 × 930 (16 KB) | Delphi234 | User created page with UploadWizard |
File usage
The following pages on the English Wikipedia use this file (pages on other projects are not listed):
Global file usage
The following other wikis use this file:
- Usage on zh.wikipedia.org