
File:07 July - Percent of global area at temperature records - Global warming - NOAA.svg

Size of this PNG preview of this SVG file: 800 × 560 pixels. Other resolutions: 320 × 224 pixels | 640 × 448 pixels | 1,024 × 717 pixels | 1,280 × 896 pixels | 2,560 × 1,792 pixels | 1,000 × 700 pixels.
Original file (SVG file, nominally 1,000 × 700 pixels, file size: 5 KB)
| This is a file from the Wikimedia Commons. Information from its description page there is shown below. Commons is a freely licensed media file repository. You can help. |
Summary
| Description |
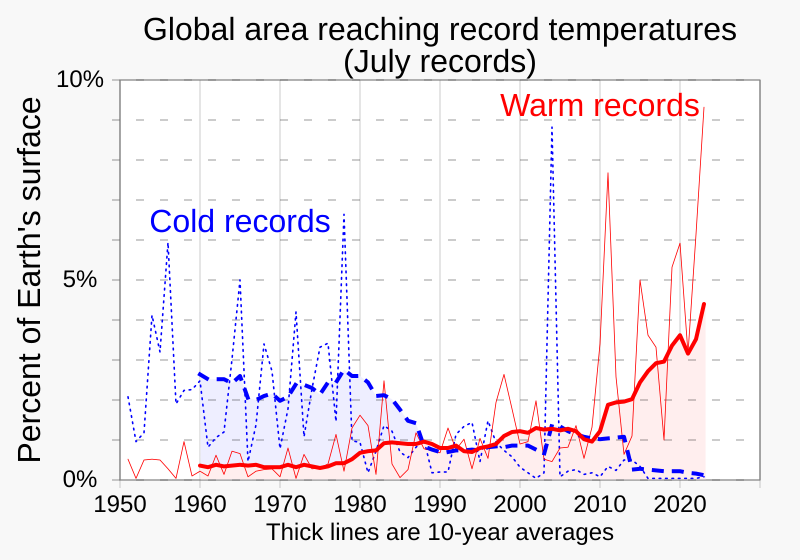
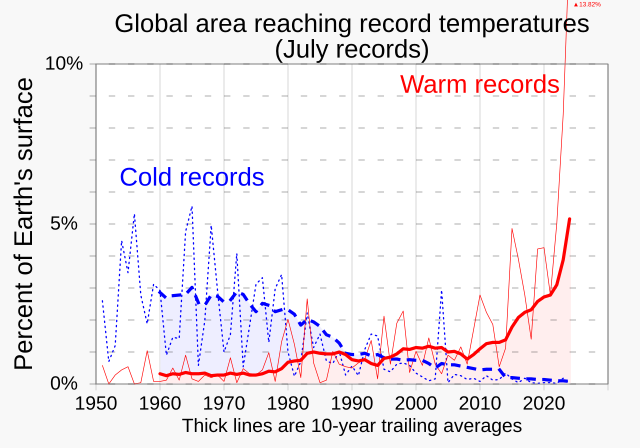
English: Line graphs of the percentages of Earth's surface reaching a record July temperature as a function of time over years 1951-, from NOAA data.
|
||
| Date | |||
| Source | Own work | ||
| Author | RCraig09 |

Related files
-
 01 January - Percent of global area at temperature records - Global warming - NOAA.svg
(January data) -
 02 February - Percent of global area at temperature records - Global warming - NOAA.svg
(February data) -
 03 March - Percent of global area at temperature records - Global warming - NOAA.svg
(March data) -
 04 April - Percent of global area at temperature records - Global warming - NOAA.svg
(April data) -
 05 May - Percent of global area at temperature records - Global warming - NOAA.svg
(May data) -
 06 June - Percent of global area at temperature records - Global warming - NOAA.svg
(June data)


-
 07 July - Percent of global area at temperature records - Global warming - NOAA.svg
(July data) -
 08 August - Percent of global area at temperature records - Global warming - NOAA.svg
(August data) -
 09 September - Percent of global area at temperature records - Global warming - NOAA.svg
(September data) -
 10 October - Percent of global area at temperature records - Global warming - NOAA.svg
(October data) -
 11 November - Percent of global area at temperature records - Global warming - NOAA.svg
(November data) -
 12 December - Percent of global area at temperature records - Global warming - NOAA.svg
(December data)


-
 1951+ Percent of global area at temperature records - Seasonal comparison - NOAA.svg
Seasonal comparison -
 1951 - Percent of global area at temperature records (monthly) - Global warming - NOAA.svg
All months scatterplot/dot plot -
 1951- RATIO of new record warm temperatures to new record cold temperatures (monthly) - Global warming.svg
Ratios scatterplot/dot plot (monthly) -
 1951- Percent of record temperatures that are cold or warm records.svg
 -
 1951- Warm and cold record temperatures - bar chart.svg

_-_Global_warming_-_NOAA.svg)
_-_Global_warming.svg)


Licensing
I, the copyright holder of this work, hereby publish it under the following license:
This file is licensed under the Creative Commons Attribution-Share Alike 4.0 International license.
- You are free:
- to share – to copy, distribute and transmit the work
- to remix – to adapt the work
- Under the following conditions:
- attribution – You must give appropriate credit, provide a link to the license, and indicate if changes were made. You may do so in any reasonable manner, but not in any way that suggests the licensor endorses you or your use.
- share alike – If you remix, transform, or build upon the material, you must distribute your contributions under the same or compatible license as the original.
File history
Click on a date/time to view the file as it appeared at that time.
| Date/Time | Thumbnail | Dimensions | User | Comment | |
|---|---|---|---|---|---|
| current | 03:42, 15 August 2023 | | 1,000 × 700 (5 KB) | RCraig09 | Version 20: update to include data through July 2023 |
| 03:54, 29 July 2023 |  | 1,000 × 700 (7 KB) | RCraig09 | Version 9: centering some text strings . . . making "(July records)" more conspicuous | |
| 15:18, 28 July 2023 |  | 1,000 × 700 (7 KB) | RCraig09 | Version 8: created new graphic for JULY figures.... but only through July 2021 . . . I plan to update when July 2023 data becomes available | |
| 16:47, 15 June 2023 |  | 1,000 × 700 (9 KB) | RCraig09 | Version 7: arrange order of code to make horizontal gridlines appear in front of colored areas | |
| 22:09, 25 May 2023 |  | 1,000 × 700 (9 KB) | RCraig09 | Version 6: Add blue fill area . . . . simplify horizontal axis | |
| 15:50, 25 May 2023 |  | 1,000 × 750 (9 KB) | RCraig09 | Version 5: changed dark blue line to dashed line . . . . making read fill-area be under 10-year average (rather than under annual numbers which are not as smooth a trace) | |
| 05:15, 25 May 2023 |  | 1,000 × 750 (9 KB) | RCraig09 | Version 4: Add 10-year moving averages traces | |
| 18:50, 24 May 2023 |  | 1,000 × 750 (6 KB) | RCraig09 | Version 3: update to include data through April 2023 . . . . add shading under red trace | |
| 19:31, 2 September 2021 |  | 1,000 × 750 (5 KB) | RCraig09 | Version 2: Amending title to be more descriptive | |
| 19:06, 2 September 2021 |  | 1,000 × 750 (5 KB) | RCraig09 | Uploaded own work with UploadWizard |
File usage
The following pages on the English Wikipedia use this file (pages on other projects are not listed):
Global file usage
The following other wikis use this file:
- Usage on bn.wikipedia.org
- Usage on es.wikipedia.org
- Usage on fa.wikipedia.org
- Usage on ja.wikipedia.org
- Usage on no.wikipedia.org
- Usage on tr.wikipedia.org