
File:2018 Pacific typhoon season summary.png

Size of this preview: 800 × 600 pixels. Other resolutions: 320 × 240 pixels | 640 × 480 pixels | 1,024 × 768 pixels | 1,280 × 960 pixels | 2,560 × 1,920 pixels | 4,000 × 3,000 pixels.
Original file (4,000 × 3,000 pixels, file size: 7.77 MB, MIME type: image/png)
| This is a file from the Wikimedia Commons. Information from its description page there is shown below. Commons is a freely licensed media file repository. You can help. |
Summary
| Description |
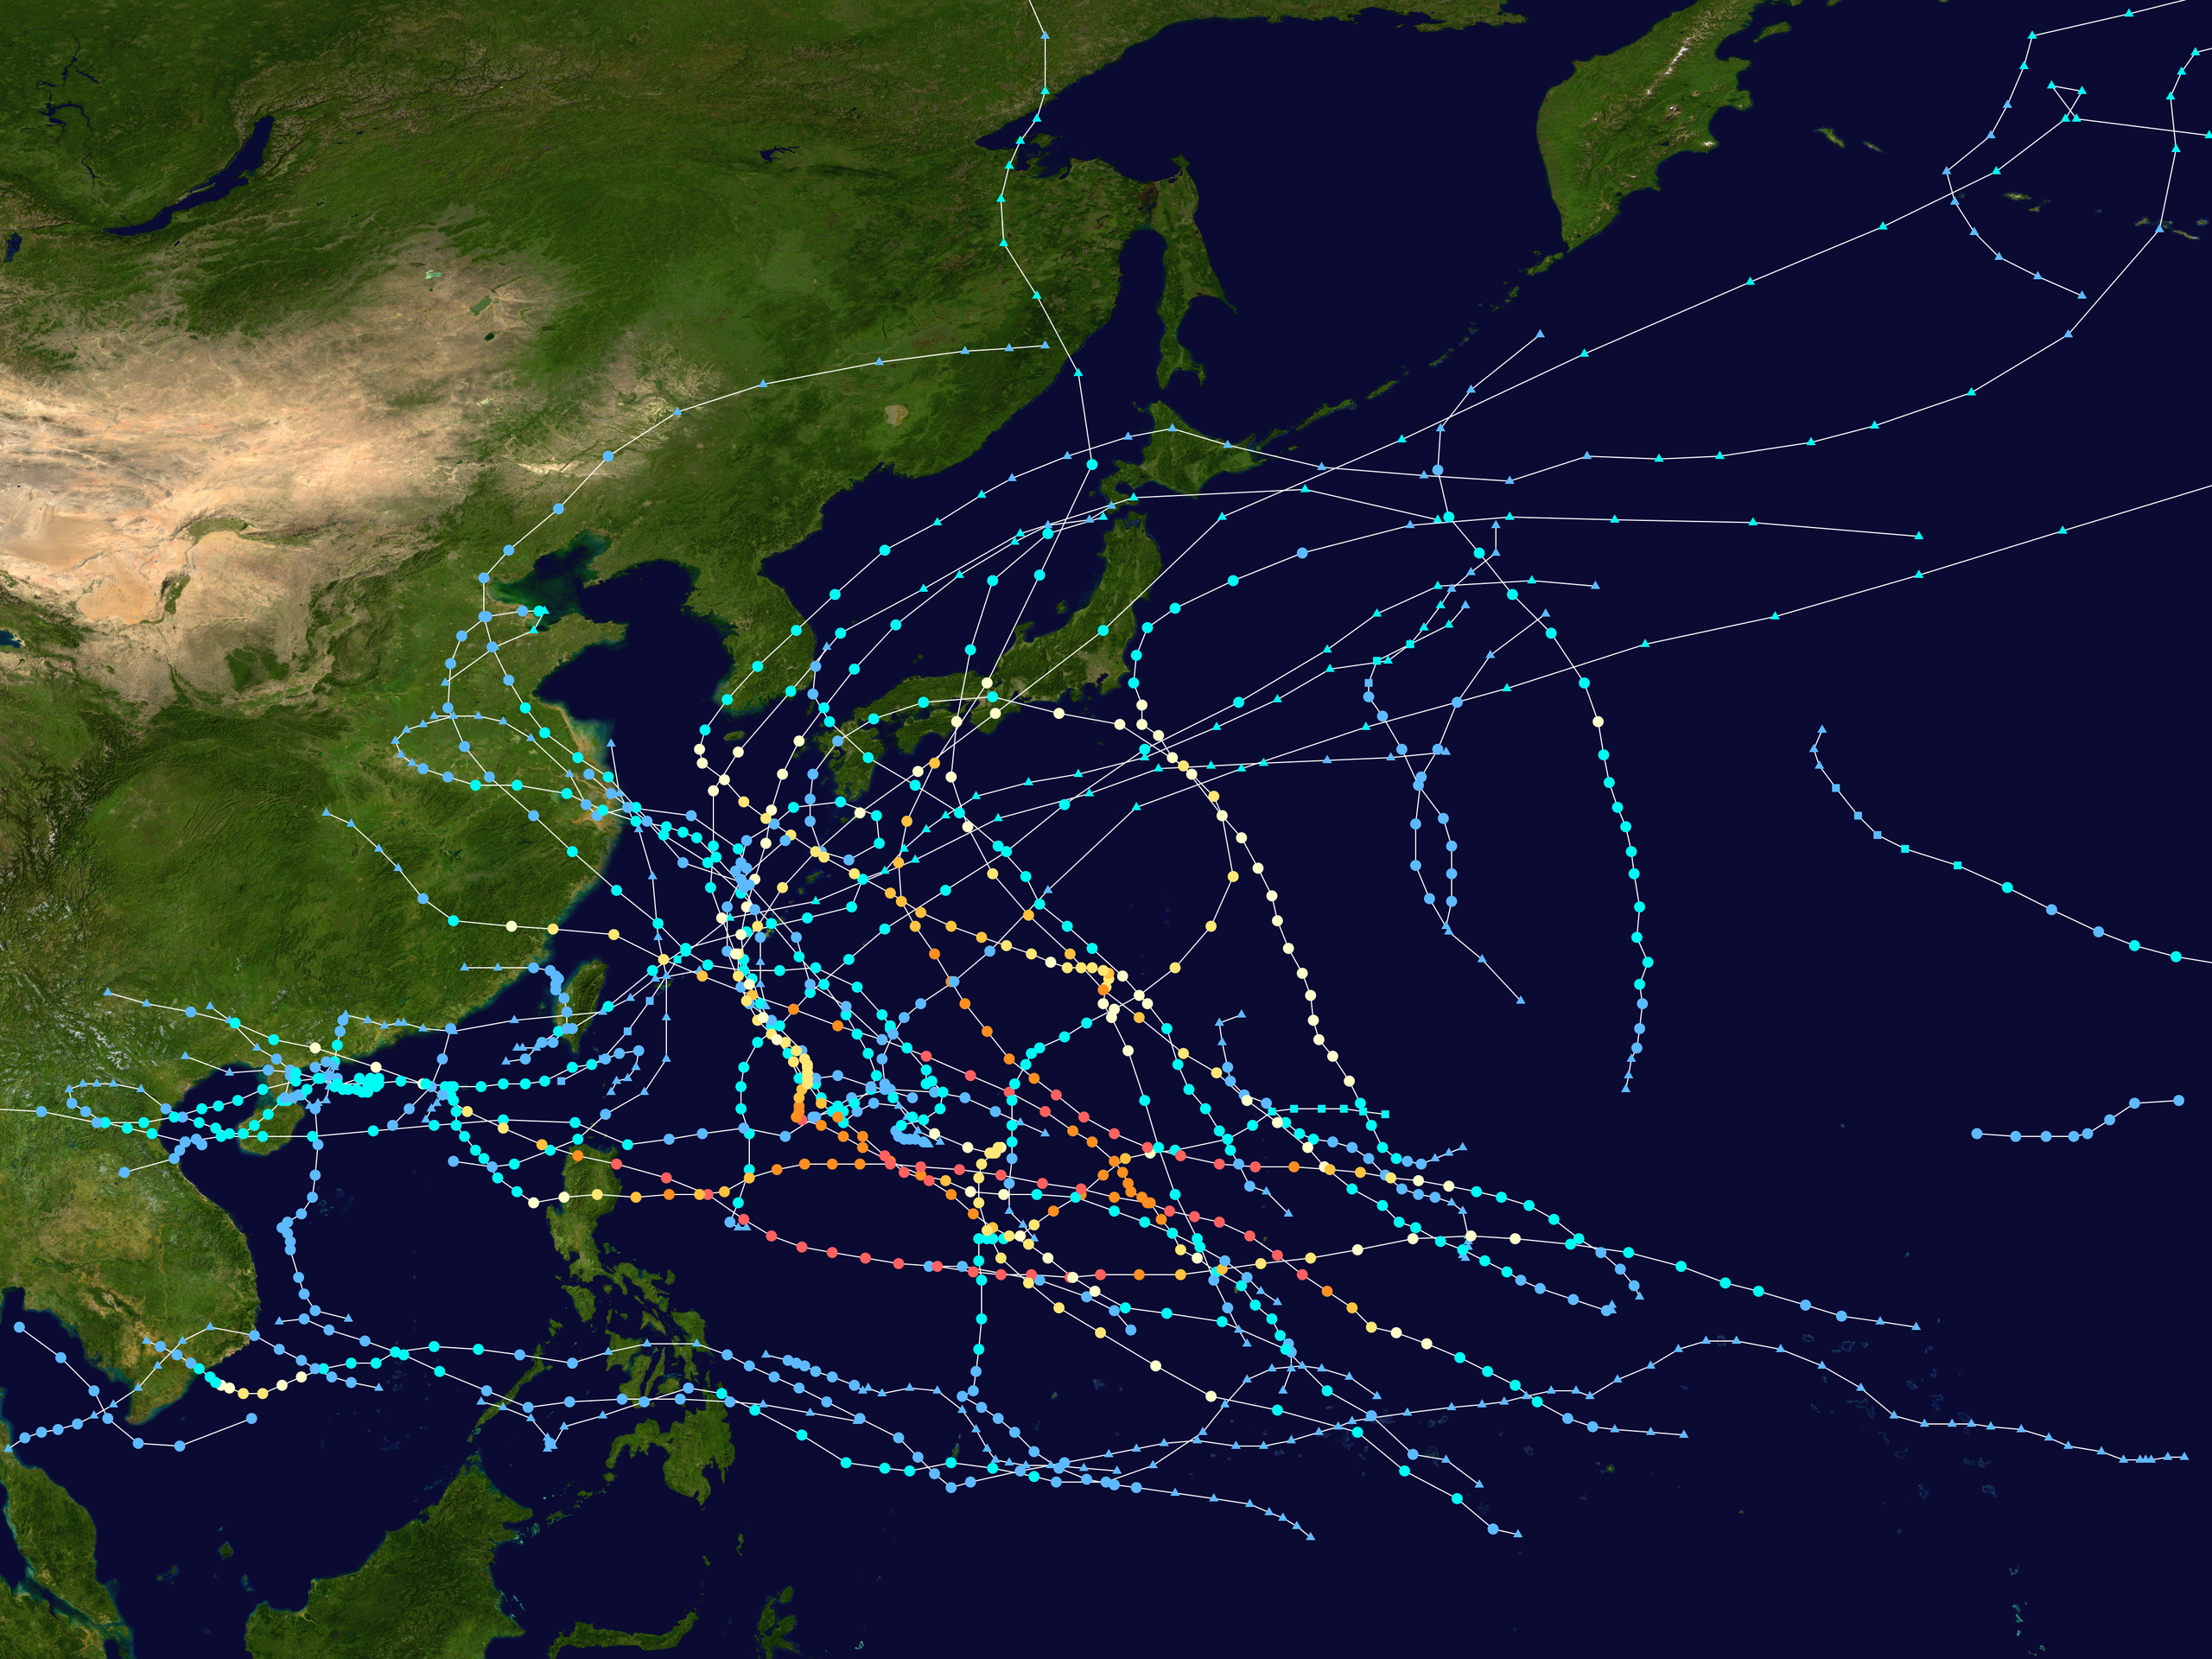
English: This map shows the tracks of all tropical cyclones in the 2018 Pacific typhoon season. The points show the location of each storm at 6-hour intervals. The colour represents the storm's maximum sustained wind speeds as classified in the Saffir-Simpson Hurricane Scale (see below), and the shape of the data points represent the type of the storm. Map generation parameters: --res 4000 --extra 1 --dots 0.2 --lines 0.04 --xmin 100 --xmax 180 --ymin 0 --ymax 60
Tropical depression (≤38 mph, ≤62 km/h)
Tropical storm (39–73 mph, 63–118 km/h)
Category 1 (74–95 mph, 119–153 km/h)
Category 2 (96–110 mph, 154–177 km/h)
Category 3 (111–129 mph, 178–208 km/h)
Category 4 (130–156 mph, 209–251 km/h)
Category 5 (≥157 mph, ≥252 km/h)
Unknown
Storm type |
| Source | Created using Wikipedia:WikiProject Tropical cyclones/Tracks. The background image is from NASA [1]. The tracking data is from the Joint Typhoon Warning Center's best track database |
| Author | Keith Edkins |
| This work has been released into the public domain by its author, Keith Edkins. This applies worldwide. In some countries this may not be legally possible; if so: Keith Edkins grants anyone the right to use this work for any purpose, without any conditions, unless such conditions are required by law. |
File history
Click on a date/time to view the file as it appeared at that time.
| Date/Time | Thumbnail | Dimensions | User | Comment | |
|---|---|---|---|---|---|
| current | 07:14, 11 July 2020 | | 4,000 × 3,000 (7.77 MB) | Supportstorm | Minor JTWC updates |
| 03:13, 21 January 2020 |  | 4,000 × 3,000 (7.77 MB) | Supportstorm | Corrections (Removal of unofficial SS, nonsynoptic data and a TD considered ET. Minor JMA TD data from finalized weather maps) | |
| 13:58, 6 October 2019 |  | 4,000 × 3,000 (7.62 MB) | Meow | JTWC best track data | |
| 14:46, 12 January 2019 |  | 4,000 × 3,000 (7.7 MB) | Meow | 12-30 12Z (Usman) | |
| 14:32, 4 December 2018 |  | 4,000 × 3,000 (7.67 MB) | Meow | RSMC Tokyo Best Track Data (Trami & Kong-rey) | |
| 14:28, 28 November 2018 |  | 4,000 × 3,000 (7.68 MB) | Meow | 11-28 06Z (Toraji, Man-yi and Usagi) | |
| 16:57, 3 November 2018 |  | 4,000 × 3,000 (7.62 MB) | Meow | 11-03 12Z (Yutu) | |
| 16:15, 9 October 2018 |  | 4,000 × 3,000 (7.59 MB) | Meow | 10-08 12Z (Trami & Kong-rey) | |
| 13:52, 28 September 2018 |  | 4,000 × 3,000 (7.52 MB) | Meow | 09-28 12Z (29W) | |
| 14:31, 19 September 2018 |  | 4,000 × 3,000 (7.48 MB) | Meow | 09-17 18Z (Mangkhut) |
File usage
The following pages on the English Wikipedia use this file (pages on other projects are not listed):
- 2018 Pacific typhoon season
- Hurricane Hector (2018)
- Timeline of the 2018 Pacific typhoon season
- Tropical Depression Josie
- Tropical Depression Usman
- Tropical Storm Ampil
- Tropical Storm Barijat
- Tropical Storm Bebinca (2018)
- Tropical Storm Bolaven (2018)
- Tropical Storm Ewiniar (2018)
- Tropical Storm Maliksi (2018)
- Tropical Storm Rumbia
- Tropical Storm Sanba (2018)
- Tropical Storm Son-Tinh
- Tropical Storm Toraji (2018)
- Tropical Storm Usagi (2018)
- Tropical Storm Yagi (2018)
- Tropical cyclones in 2018
- Typhoon Cimaron (2018)
- Typhoon Jebi
- Typhoon Jelawat (2018)
- Typhoon Jongdari
- Typhoon Kong-rey (2018)
- Typhoon Mangkhut
- Typhoon Maria (2018)
- Typhoon Prapiroon (2018)
- Typhoon Soulik (2018)
- Typhoon Trami
- Typhoon Yutu
- User:Akbermamps/Tropical Depression Luis
- User:Akbermamps/sandbox
- User:Hurricane Noah/Hurricane Hector
- User:Hurricane Noah/Meteorological history of Typhoon Mangkhut
- User:Hurricane Noah/Sandbox8
- User:KN2731/Cimaron
- User:Nepbert/2018 Pacific typhoon season
- User:Nino Marakot/2018 Pacific typhoon season
- User:Tfmbty/2018 Pacific typhoon season
- Wikipedia:WikiProject Tropical cyclones/2018 FT task force
- Wikipedia talk:WikiProject Tropical cyclones/Archive 48
- Template:2018 Pacific typhoon season buttons
Global file usage
The following other wikis use this file:
- Usage on de.wikipedia.org
- Usage on es.wikipedia.org
- Usage on ja.wikipedia.org
- Usage on ko.wikipedia.org
- Usage on pt.wikipedia.org
- Usage on ru.wikipedia.org
- Usage on simple.wikipedia.org
- Usage on th.wikipedia.org
- Usage on tl.wikipedia.org
- Usage on vi.wikipedia.org
- Usage on www.wikidata.org
- Usage on zh-yue.wikipedia.org
View more global usage of this file.