
File:2017-2018 South Pacific cyclone season summary.png

Size of this preview: 800 × 500 pixels. Other resolutions: 320 × 200 pixels | 640 × 400 pixels | 1,024 × 640 pixels | 1,280 × 800 pixels | 2,560 × 1,600 pixels | 4,000 × 2,500 pixels.
Original file (4,000 × 2,500 pixels, file size: 573 KB, MIME type: image/png)
| This is a file from the Wikimedia Commons. Information from its description page there is shown below. Commons is a freely licensed media file repository. You can help. |
| Description |
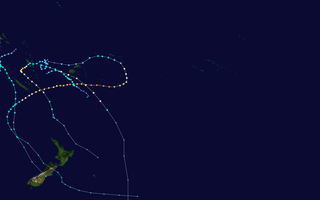
English: This map shows the tracks of all tropical cyclones in the 2017-18 South Pacific cyclone season. The points show the location of each storm at 6-hour intervals. The colour represents the storm's maximum sustained wind speeds as classified in the Saffir-Simpson Hurricane Scale (see below), and the shape of the data points represent the type of the storm.
Tropical depression (≤38 mph, ≤62 km/h)
Tropical storm (39–73 mph, 63–118 km/h)
Category 1 (74–95 mph, 119–153 km/h)
Category 2 (96–110 mph, 154–177 km/h)
Category 3 (111–129 mph, 178–208 km/h)
Category 4 (130–156 mph, 209–251 km/h)
Category 5 (≥157 mph, ≥252 km/h)
Unknown
Storm type |
| Source | Created using Wikipedia:WikiProject Tropical cyclones/Tracks. The background image is from NASA [1]. The tracking data |
| Author | Keith Edkins |
| This work has been released into the public domain by its author, Keith Edkins. This applies worldwide. In some countries this may not be legally possible; if so: Keith Edkins grants anyone the right to use this work for any purpose, without any conditions, unless such conditions are required by law. |
File history
Click on a date/time to view the file as it appeared at that time.
| Date/Time | Thumbnail | Dimensions | User | Comment | |
|---|---|---|---|---|---|
| current | 16:30, 22 January 2020 | | 4,000 × 2,500 (573 KB) | Supportstorm | JTWC/Wellington data, added Iris |
| 03:41, 10 December 2019 |  | 4,000 × 2,500 (571 KB) | Supportstorm | Best track data (Removed minor systems that were not analyzed post-season), dimensions of the basin --xmax 240 --xmin 160 --ymax 0 --ymin -50 | |
| 05:12, 10 May 2019 |  | 3,000 × 1,854 (1.36 MB) | Es204L | Reverted to version as of 01:15, 23 October 2018 (UTC) | |
| 00:45, 20 March 2019 |  | 4,000 × 2,472 (694 KB) | Es204L | Reverted to version as of 04:13, 9 April 2018 (UTC) | |
| 01:15, 23 October 2018 |  | 3,000 × 1,854 (1.36 MB) | Es204L | last | |
| 04:13, 9 April 2018 |  | 4,000 × 2,472 (694 KB) | Cyclonebiskit | update, add JTWC TS | |
| 13:40, 5 April 2018 |  | 3,000 × 1,854 (450 KB) | Keith Edkins | Added Joise | |
| 12:27, 25 March 2018 |  | 3,000 × 1,854 (442 KB) | Keith Edkins | Added 08F, Hola, and Iris | |
| 18:49, 21 February 2018 |  | 3,000 × 1,854 (424 KB) | Keith Edkins | Added Gita | |
| 13:54, 2 February 2018 |  | 3,000 × 1,854 (363 KB) | Keith Edkins | Updated thru Fehi |
File usage
The following pages on the English Wikipedia use this file (pages on other projects are not listed):
Global file usage
The following other wikis use this file:
- Usage on ko.wikipedia.org
- Usage on pt.wikipedia.org
- Usage on vi.wikipedia.org
- Usage on zh.wikipedia.org