
File:2010 Pacific typhoon season summary.png

Size of this preview: 800 × 600 pixels. Other resolutions: 320 × 240 pixels | 640 × 480 pixels | 1,024 × 768 pixels | 1,280 × 960 pixels | 2,560 × 1,920 pixels | 4,000 × 3,000 pixels.
Original file (4,000 × 3,000 pixels, file size: 7.4 MB, MIME type: image/png)
| This is a file from the Wikimedia Commons. Information from its description page there is shown below. Commons is a freely licensed media file repository. You can help. |
| Description |
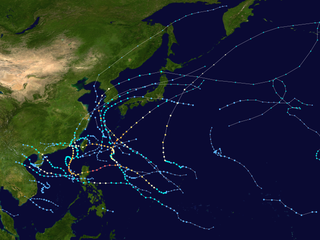
English: This map shows the tracks of all tropical cyclones in the 2010 Pacific typhoon season. The points show the location of each storm at 6-hour intervals. The colour represents the storm's maximum sustained wind speeds as classified in the Saffir-Simpson Hurricane Scale (see below), and the shape of the data points represent the type of the storm.
Tropical depression (≤38 mph, ≤62 km/h)
Tropical storm (39–73 mph, 63–118 km/h)
Category 1 (74–95 mph, 119–153 km/h)
Category 2 (96–110 mph, 154–177 km/h)
Category 3 (111–129 mph, 178–208 km/h)
Category 4 (130–156 mph, 209–251 km/h)
Category 5 (≥157 mph, ≥252 km/h)
Unknown
Storm type |
| Source | Created using Wikipedia:WikiProject Tropical cyclones/Tracks. The background image is from NASA [1]. The tracking data is from the Joint Typhoon Warning Center's best track database |
| Author | Keith Edkins |
| This work has been released into the public domain by its author, Keith Edkins. This applies worldwide. In some countries this may not be legally possible; if so: Keith Edkins grants anyone the right to use this work for any purpose, without any conditions, unless such conditions are required by law. |
File history
Click on a date/time to view the file as it appeared at that time.
| Date/Time | Thumbnail | Dimensions | User | Comment | |
|---|---|---|---|---|---|
| current | 21:32, 18 June 2020 | | 4,000 × 3,000 (7.4 MB) | Supportstorm | JTWC/JMA/CMA data, corrected dimensions |
| 22:49, 18 January 2019 |  | 4,000 × 3,480 (10.61 MB) | Supportstorm | Reverted to version as of 03:43, 26 September 2016 (UTC) | |
| 18:29, 27 August 2018 |  | 4,000 × 3,000 (9.71 MB) | David Petrovsky | Added the dimensional | |
| 03:43, 26 September 2016 |  | 4,000 × 3,480 (10.61 MB) | Supportstorm | Best track data/ add operational tracked depressions and removal of depressions not tracked by the JMA | |
| 16:21, 16 December 2010 |  | 3,000 × 1,854 (3.72 MB) | Keith Edkins | Add TD 19W | |
| 12:43, 14 November 2010 |  | 1,024 × 633 (591 KB) | Keith Edkins | Update with recent systems | |
| 02:23, 27 October 2010 |  | 3,000 × 1,854 (2.87 MB) | Cyclonebiskit | Reverted to version as of 02:21, 27 October 2010 undid accidental re-upload :P | |
| 02:21, 27 October 2010 |  | 3,000 × 1,854 (2.86 MB) | Syntheticalconnections | fixed resolution | |
| 02:21, 27 October 2010 |  | 3,000 × 1,854 (2.87 MB) | Cyclonebiskit | fixed resolution and added other storms | |
| 02:18, 27 October 2010 |  | 1,024 × 633 (483 KB) | Syntheticalconnections | update |
File usage
The following pages on the English Wikipedia use this file (pages on other projects are not listed):
- 2010 Pacific typhoon season
- Li's field
- Timeline of the 2010 Pacific typhoon season
- Typhoon Chaba (2010)
- Typhoon Chanthu (2010)
- Typhoon Conson (2010)
- Typhoon Fanapi
- Typhoon Kompasu (2010)
- Typhoon Megi (2010)
- User:Jarda2020/2023 Pacific typhoon season
- User:Tfmbty/2010 Pacific typhoon season
- Template:2010 Pacific typhoon season buttons
Global file usage
The following other wikis use this file:
- Usage on de.wikipedia.org
- Usage on ja.wikipedia.org
- Usage on ko.wikipedia.org
- Usage on ms.wikipedia.org
- Usage on nl.wikipedia.org
- Usage on pt.wikipedia.org
- Usage on simple.wikipedia.org
- Usage on th.wikipedia.org
- Usage on tl.wikipedia.org
- Usage on vi.wikipedia.org
- Usage on www.wikidata.org
- Usage on zh.wikipedia.org