
File:2005kiwi fruit.PNG
Size of this preview: 800 × 351 pixels. Other resolutions: 320 × 140 pixels | 640 × 281 pixels | 1,425 × 625 pixels.
Original file (1,425 × 625 pixels, file size: 58 KB, MIME type: image/png)
| This is a file from the Wikimedia Commons. Information from its description page there is shown below. Commons is a freely licensed media file repository. You can help. |
| Description |
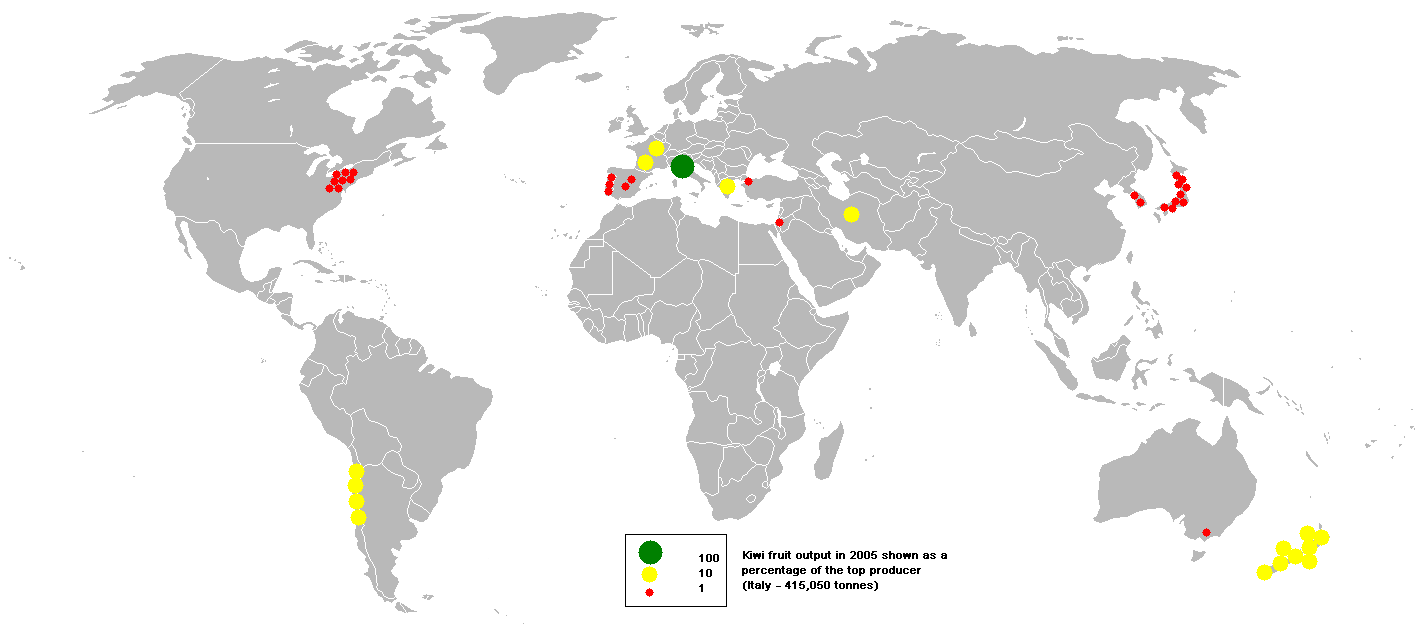
This bubble map shows the global distribution of kiwifruit output in 2005 as a percentage of the top producer (Italy - 415,050 tonnes). This map is consistent with incomplete set of data too as long as the top producer is known. It resolves the accessibility issues faced by colour-coded maps that may not be properly rendered in old computer screens. |
||
| Date | |||
| Source | Data was extracted on 9th June 2007 from http://faostat.fao.org/site/336/DesktopDefault.aspx?PageID=336 | ||
| Author | w:User:Anwar_saadat, who was the original uploader on Wikipedia | ||
| Permission (Reusing this file) |
|

|
This economic map image could be re-created using vector graphics as an SVG file. This has several advantages; see Commons:Media for cleanup for more information. If an SVG form of this image is available, please upload it and afterwards replace this template with
{{vector version available|new image name}}.
It is recommended to name the SVG file “2005kiwi fruit.svg”—then the template Vector version available (or Vva) does not need the new image name parameter. |
File history
Click on a date/time to view the file as it appeared at that time.
| Date/Time | Thumbnail | Dimensions | User | Comment | |
|---|---|---|---|---|---|
| current | 22:29, 13 November 2007 | | 1,425 × 625 (58 KB) | CarolSpears | {{Information |Description= This bubble map shows the global distribution of kiwifruit output in 2005 as a percentage of the top producer (Italy - 415,050 tonnes). This map is consistent with incomplete set of data too as long as the top producer is know |
File usage
No pages on the English Wikipedia use this file (pages on other projects are not listed).
Global file usage
The following other wikis use this file:
- Usage on fa.wikipedia.org
- Usage on kn.wikipedia.org
- Usage on ko.wikipedia.org
- Usage on pt.wikipedia.org
- Usage on sl.wikipedia.org