
File:1997- Lanes per bowling center.png

Original file (2,155 × 1,575 pixels, file size: 189 KB, MIME type: image/png)
| This is a file from the Wikimedia Commons. Information from its description page there is shown below. Commons is a freely licensed media file repository. You can help. |
Summary
| Description |
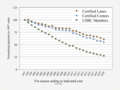
English: Graph of the number of lanes per bowling center, annually beginning in 1997.
|
||||
| Date | |||||
| Source | Own work | ||||
| Author | RCraig09 |
Related files using essentially the same USBC dataset
-
 1997- Bowling centers, league members, and lanes - raw numbers.svg
 -
 1997- Bowling centers, league members, and lanes - normalized.svg
 -
 1997- Lanes per bowling center.svg


Outdated and supeseded PNGs:
-
 1997- USBC membership and certified lanes.png
 -
 1997- USBC membership and lanes and centers NORMALIZED.png
 -
 1997- Lanes per bowling center.png


Licensing
- You are free:
- to share – to copy, distribute and transmit the work
- to remix – to adapt the work
- Under the following conditions:
- attribution – You must give appropriate credit, provide a link to the license, and indicate if changes were made. You may do so in any reasonable manner, but not in any way that suggests the licensor endorses you or your use.
- share alike – If you remix, transform, or build upon the material, you must distribute your contributions under the same or compatible license as the original.
File history
Click on a date/time to view the file as it appeared at that time.
| Date/Time | Thumbnail | Dimensions | User | Comment | |
|---|---|---|---|---|---|
| current | 07:07, 30 January 2021 | | 2,155 × 1,575 (189 KB) | RCraig09 | Version 3: Updated to include 2020 data. |
| 04:27, 28 October 2019 |  | 1,724 × 1,260 (142 KB) | RCraig09 | Update to include 2019 data. | |
| 20:19, 1 April 2019 |  | 1,945 × 1,325 (186 KB) | RCraig09 | User created page with UploadWizard |