Elbow method (clustering)

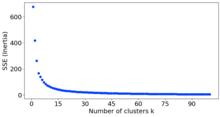
In cluster analysis, the elbow method is a heuristic used in determining the number of clusters in a data set. The method consists of plotting the explained variation as a function of the number of clusters and picking the elbow of the curve as the number of clusters to use. The same method can be used to choose the number of parameters in other data-driven models, such as the number of principal components to describe a data set.
The method can be traced to speculation by Robert L. Thorndike in 1953.[1]
Intuition[edit]
Using the "elbow" or "knee of a curve" as a cutoff point is a common heuristic in mathematical optimization to choose a point where diminishing returns are no longer worth the additional cost. In clustering, this means one should choose a number of clusters so that adding another cluster doesn't give much better modeling of the data.
The intuition is that increasing the number of clusters will naturally improve the fit (explain more of the variation), since there are more parameters (more clusters) to use, but that at some point this is over-fitting, and the elbow reflects this. For example, given data that actually consist of k labeled groups – for example, k points sampled with noise – clustering with more than k clusters will "explain" more of the variation (since it can use smaller, tighter clusters), but this is over-fitting, since it is subdividing the labeled groups into multiple clusters. The idea is that the first clusters will add much information (explain a lot of variation), since the data actually consist of that many groups (so these clusters are necessary), but once the number of clusters exceeds the actual number of groups in the data, the added information will drop sharply, because it is just subdividing the actual groups. Assuming this happens, there will be a sharp elbow in the graph of explained variation versus clusters: increasing rapidly up to k (under-fitting region), and then increasing slowly after k (over-fitting region).
Criticism[edit]
The elbow method is considered both subjective and unreliable. In many practical applications, the choice of an "elbow" is highly ambiguous as the plot does not contain a sharp elbow.[2] This can even hold in cases where all other methods for determining the number of clusters in a data set (as mentioned in that article) agree on the number of clusters.

Even on uniform random data (with no meaningful clusters) the curve follows approximately the ratio 1/k where k is the number of clusters parameter, causing users to see an "elbow" to mistakenly choose some "optimal" number of clusters.[3]
Because the two axes (the number of clusters and the remaining variance) have no semantic relationship, various attempt to capture the elbow by "slope" are ill-defined and sensitive to the parameter range.[3] Increasing the maximum number of clusters can change the location of the perceived "elbow", and in many cases alternate heuristics such as the variance-ratio-criterion or the average silhouette width are considered to be more reliable.[3] But even with such measures, the results may depend much on the data preprocessing (feature selection and scaling) and users may come to very different clustering results on the same data.
Measures of variation[edit]
There are various measures of "explained variation" used in the elbow method. Most commonly, variation is quantified by variance, and the ratio used is the ratio of between-group variance to the total variance. Alternatively, one uses the ratio of between-group variance to within-group variance, which is the one-way ANOVA F-test statistic.[4]
See also[edit]
References[edit]
- ^ Robert L. Thorndike (December 1953). "Who Belongs in the Family?". Psychometrika. 18 (4): 267–276. doi:10.1007/BF02289263. S2CID 120467216.
- ^ See, e.g., Ketchen, Jr, David J.; Shook, Christopher L. (1996). "The application of cluster analysis in Strategic Management Research: An analysis and critique". Strategic Management Journal. 17 (6): 441–458. doi:10.1002/(SICI)1097-0266(199606)17:6<441::AID-SMJ819>3.0.CO;2-G.[dead link]
- ^ a b c Schubert, Erich (2023-07-05). "Stop using the elbow criterion for k-means and how to choose the number of clusters instead". ACM SIGKDD Explorations Newsletter. 25 (1): 36–42. arXiv:2212.12189. doi:10.1145/3606274.3606278. ISSN 1931-0145.
- ^ See, e.g., Figure 6 in
- Goutte, Cyril; Toft, Peter; Rostrup, Egill; Nielsen, Finn Årup; Hansen, Lars Kai (March 1999). "On Clustering fMRI Time Series". NeuroImage. 9 (3): 298–310. CiteSeerX 10.1.1.29.2679. doi:10.1006/nimg.1998.0391. PMID 10075900. S2CID 14147564.
