2000 United States presidential election in Wisconsin
| ||||||||||||||||||||||||||
| ||||||||||||||||||||||||||
| ||||||||||||||||||||||||||
| ||||||||||||||||||||||||||
| Elections in Wisconsin |
|---|
 |
The 2000 United States presidential election in Wisconsin took place on November 7, 2000, and was part of the 2000 United States presidential election. Voters chose 11 representatives, or electors to the Electoral College, who voted for president and vice president.
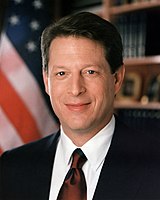
Wisconsin was won by Vice President Al Gore by a slim 0.22% margin of victory, a mere difference of 5,708 votes. This was the first time since 1988, and only the second time since 1960 that Wisconsin did not vote for the overall winner of a presidential election. This was the last time that Wisconsin voted to the right of neighboring Iowa, as well as the national popular vote until 2016.
Wisconsin was won by a narrow margin by Gore by less than 6,000 votes. Gore carried Milwaukee County home of Milwaukee, and Dane County home of Madison, which contributed to his victory.
Results[edit]
| 2000 United States presidential election in Wisconsin[1] | |||||
|---|---|---|---|---|---|
| Party | Candidate | Votes | Percentage | Electoral votes | |
| Democratic | Albert Arnold Gore Jr. | 1,242,987 | 47.83% | 11 | |
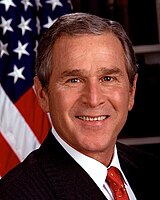
| Republican | George Walker Bush | 1,237,279 | 47.61% | 0 | |
| Green | Ralph Nader | 94,070 | 3.62% | 0 | |
| Independent | Pat Buchanan | 11,471 | 0.44% | 0 | |
| Libertarian | Harry Browne | 6,640 | 0.26% | 0 | |
By Congressional District[edit]
Gore won 5 of the 9 congressional districts. Both candidates won a district held by the opposite party.[2]
| District | Bush | Gore | Representative |
|---|---|---|---|
| 1st | 47% | 49% | Paul Ryan |
| 2nd | 36% | 58% | Tammy Baldwin |
| 3rd | 46% | 49% | Ron Kind |
| 4th | 51% | 45% | Jerry Kleczka |
| 5th | 31% | 65% | Tom Barrett |
| 6th | 53% | 43% | Tom Petri |
| 7th | 46% | 48% | Dave Obey |
| 8th | 52% | 44% | Mark Andrew Green |
| 9th | 63% | 34% | Jim Sensenbrenner |
By county[edit]
| County | Al Gore Democratic |
George W. Bush Republican |
Various candidates Other parties |
Margin | Total votes cast | ||||
|---|---|---|---|---|---|---|---|---|---|
| # | % | # | % | # | % | # | % | ||
| Adams | 4,826 | 52.94% | 3,920 | 43.00% | 370 | 4.06% | 906 | 9.94% | 9,116 |
| Ashland | 4,356 | 55.21% | 3,038 | 38.50% | 496 | 6.29% | 1,318 | 16.71% | 7,890 |
| Barron | 8,928 | 44.86% | 9,848 | 49.48% | 1,128 | 5.67% | -920 | -4.62% | 19,904 |
| Bayfield | 4,427 | 53.60% | 3,266 | 39.54% | 566 | 6.85% | 1,161 | 14.06% | 8,259 |
| Brown | 49,096 | 45.56% | 54,258 | 50.25% | 4,415 | 4.10% | -5,162 | -4.79% | 107,769 |
| Buffalo | 3,237 | 48.74% | 3,038 | 45.75% | 366 | 5.51% | 199 | 2.99% | 6,641 |
| Burnett | 3,626 | 44.49% | 3,967 | 48.67% | 558 | 6.85% | -341 | -4.18% | 8,151 |
| Calumet | 8,202 | 41.12% | 10,837 | 54.33% | 908 | 4.55% | -2,635 | -13.21% | 19,947 |
| Chippewa | 12,102 | 46.24% | 12,835 | 49.04% | 1,236 | 4.72% | -733 | -2.80% | 26,173 |
| Clark | 5,931 | 41.92% | 7,461 | 52.73% | 757 | 5.35% | -1,530 | -10.81% | 14,149 |
| Columbia | 12,636 | 49.38% | 11,987 | 46.85% | 964 | 3.77% | 649 | 2.53% | 25,587 |
| Crawford | 4,005 | 54.17% | 3,024 | 40.90% | 365 | 4.94% | 981 | 13.27% | 7,394 |
| Dane | 142,317 | 61.15% | 75,790 | 32.56% | 14,632 | 6.29% | 66,527 | 28.59% | 232,739 |
| Dodge | 14,580 | 38.67% | 21,684 | 57.52% | 1,437 | 3.81% | -7,104 | -18.85% | 37,701 |
| Door | 6,560 | 43.10% | 7,810 | 51.31% | 850 | 5.58% | -1,250 | -8.21% | 15,220 |
| Douglas | 13,593 | 62.62% | 6,930 | 31.93% | 1,183 | 5.45% | 6,663 | 30.69% | 21,706 |
| Dunn | 9,172 | 47.45% | 8,911 | 46.10% | 1,247 | 6.45% | 261 | 1.35% | 19,330 |
| Eau Claire | 24,078 | 50.29% | 20,921 | 43.70% | 2,876 | 6.01% | 3,157 | 6.59% | 47,875 |
| Florence | 816 | 33.93% | 1,528 | 63.53% | 61 | 2.54% | -712 | -29.60% | 2,405 |
| Fond du Lac | 18,181 | 39.02% | 26,548 | 56.98% | 1,860 | 3.99% | -8,367 | -17.96% | 46,589 |
| Forest | 2,158 | 45.76% | 2,404 | 50.98% | 154 | 3.27% | -246 | -5.22% | 4,716 |
| Grant | 10,691 | 48.69% | 10,240 | 46.64% | 1,025 | 4.67% | 451 | 2.05% | 21,956 |
| Green | 7,863 | 51.47% | 6,790 | 44.45% | 623 | 4.08% | 1,073 | 7.02% | 15,276 |
| Green Lake | 3,301 | 36.25% | 5,451 | 59.86% | 355 | 3.90% | -2,150 | -23.61% | 9,107 |
| Iowa | 5,842 | 55.42% | 4,221 | 40.04% | 478 | 4.53% | 1,621 | 15.38% | 10,541 |
| Iron | 1,620 | 46.19% | 1,734 | 49.44% | 153 | 4.36% | -114 | -3.25% | 3,507 |
| Jackson | 4,380 | 52.04% | 3,670 | 43.60% | 367 | 4.36% | 710 | 8.44% | 8,417 |
| Jefferson | 15,203 | 42.11% | 19,204 | 53.20% | 1,692 | 4.69% | -4,001 | -11.09% | 36,099 |
| Juneau | 4,813 | 47.10% | 4,910 | 48.05% | 495 | 4.84% | -97 | -0.95% | 10,218 |
| Kenosha | 32,429 | 50.90% | 28,891 | 45.35% | 2,389 | 3.75% | 3,538 | 5.55% | 63,709 |
| Kewaunee | 4,670 | 46.31% | 4,883 | 48.42% | 531 | 5.27% | -213 | -2.11% | 10,084 |
| La Crosse | 28,455 | 51.22% | 24,327 | 43.79% | 2,777 | 5.00% | 4,128 | 7.43% | 55,559 |
| Lafayette | 3,710 | 51.08% | 3,336 | 45.93% | 217 | 2.99% | 374 | 5.15% | 7,263 |
| Langlade | 4,199 | 43.20% | 5,125 | 52.72% | 397 | 4.08% | -926 | -9.52% | 9,721 |
| Lincoln | 6,664 | 46.80% | 6,727 | 47.24% | 848 | 5.96% | -63 | -0.44% | 14,239 |
| Manitowoc | 17,667 | 45.51% | 19,358 | 49.86% | 1,799 | 4.63% | -1,691 | -4.35% | 38,824 |
| Marathon | 26,546 | 45.48% | 28,883 | 49.48% | 2,945 | 5.05% | -2,337 | -4.00% | 58,374 |
| Marinette | 8,676 | 43.55% | 10,535 | 52.88% | 710 | 3.56% | -1,859 | -9.33% | 19,921 |
| Marquette | 3,437 | 47.78% | 3,522 | 48.96% | 235 | 3.27% | -85 | -1.18% | 7,194 |
| Menominee | 949 | 76.97% | 225 | 18.25% | 59 | 4.79% | 724 | 58.72% | 1,233 |
| Milwaukee | 252,329 | 58.20% | 163,491 | 37.71% | 17,717 | 4.09% | 88,838 | 20.49% | 433,537 |
| Monroe | 7,460 | 45.67% | 8,217 | 50.30% | 658 | 4.03% | -757 | -4.63% | 16,335 |
| Oconto | 7,260 | 43.75% | 8,706 | 52.46% | 630 | 3.79% | -1,446 | -8.71% | 16,596 |
| Oneida | 8,339 | 44.14% | 9,512 | 50.35% | 1,040 | 5.51% | -1,173 | -6.21% | 18,891 |
| Outagamie | 32,735 | 43.22% | 39,460 | 52.10% | 3,547 | 4.68% | -6,725 | -8.88% | 75,742 |
| Ozaukee | 15,030 | 31.48% | 31,155 | 65.24% | 1,566 | 3.28% | -16,125 | -33.76% | 47,751 |
| Pepin | 1,854 | 50.60% | 1,631 | 44.51% | 179 | 4.89% | 223 | 6.09% | 3,664 |
| Pierce | 8,559 | 47.65% | 8,169 | 45.48% | 1,234 | 6.87% | 390 | 2.17% | 17,962 |
| Polk | 8,961 | 45.34% | 9,557 | 48.36% | 1,244 | 6.29% | -596 | -3.02% | 19,762 |
| Portage | 17,942 | 53.15% | 13,214 | 39.14% | 2,604 | 7.71% | 4,728 | 14.01% | 33,760 |
| Price | 3,413 | 43.04% | 4,136 | 52.16% | 381 | 4.80% | -723 | -9.12% | 7,930 |
| Racine | 41,563 | 46.77% | 44,014 | 49.53% | 3,288 | 3.70% | -2,451 | -2.76% | 88,865 |
| Richland | 3,837 | 46.27% | 3,994 | 48.16% | 462 | 5.57% | -157 | -1.89% | 8,293 |
| Rock | 40,472 | 57.49% | 27,467 | 39.01% | 2,465 | 3.50% | 13,005 | 18.48% | 70,404 |
| Rusk | 3,161 | 42.91% | 3,758 | 51.02% | 447 | 6.07% | -597 | -8.11% | 7,366 |
| St. Croix | 13,077 | 43.66% | 15,240 | 50.88% | 1,637 | 5.47% | -2,163 | -7.22% | 29,954 |
| Sauk | 13,035 | 50.81% | 11,586 | 45.16% | 1,032 | 4.02% | 1,449 | 5.65% | 25,653 |
| Sawyer | 3,333 | 42.91% | 3,972 | 51.14% | 462 | 5.95% | -639 | -8.23% | 7,767 |
| Shawano | 7,335 | 41.67% | 9,548 | 54.24% | 720 | 4.09% | -2,213 | -12.57% | 17,603 |
| Sheboygan | 23,569 | 42.70% | 29,648 | 53.71% | 1,984 | 3.59% | -6,079 | -11.01% | 55,201 |
| Taylor | 3,254 | 36.19% | 5,278 | 58.70% | 460 | 5.12% | -2,024 | -22.51% | 8,992 |
| Trempealeau | 6,678 | 54.88% | 5,002 | 41.11% | 488 | 4.01% | 1,676 | 13.77% | 12,168 |
| Vernon | 6,577 | 50.42% | 5,684 | 43.58% | 783 | 6.00% | 893 | 6.84% | 13,044 |
| Vilas | 4,706 | 38.19% | 6,958 | 56.47% | 658 | 5.34% | -2,252 | -18.28% | 12,322 |
| Walworth | 15,492 | 38.29% | 22,982 | 56.80% | 1,984 | 4.90% | -7,490 | -18.51% | 40,458 |
| Washburn | 3,695 | 45.93% | 3,912 | 48.63% | 438 | 5.44% | -217 | -2.70% | 8,045 |
| Washington | 18,115 | 29.50% | 41,162 | 67.03% | 2,135 | 3.48% | -23,047 | -37.53% | 61,412 |
| Waukesha | 64,319 | 31.57% | 133,105 | 65.33% | 6,310 | 3.10% | -68,786 | -33.76% | 203,734 |
| Waupaca | 8,787 | 38.53% | 12,980 | 56.92% | 1,037 | 4.55% | -4,193 | -18.39% | 22,804 |
| Waushara | 4,239 | 41.36% | 5,571 | 54.36% | 438 | 4.27% | -1,332 | -13.00% | 10,248 |
| Winnebago | 33,983 | 44.67% | 38,330 | 50.38% | 3,767 | 4.95% | -4,347 | -5.71% | 76,080 |
| Wood | 15,936 | 44.56% | 17,803 | 49.78% | 2,022 | 5.65% | -1,867 | -5.22% | 35,761 |
| Totals | 1,242,987 | 47.83% | 1,237,279 | 47.61% | 118,341 | 4.55% | 5,708 | 0.22% | 2,598,607 |
Counties that flipped from Democratic to Republican[edit]
- Barron (Largest city: Rice Lake)
- Brown (Largest city: Green Bay)
- Burnett (Largest city: Grantsburg)
- Chippewa (Largest city: Chippewa Falls)
- Clark (Largest city: Neillsville)
- Door (Largest city: Sturgeon Bay)
- Forest (Largest city: Crandon)
- Iron (Largest city: Hurley)
- Jefferson (Largest city: Watertown)
- Juneau (Largest city: Mauston)
- Kewaunee (Largest city: Algoma)
- Langlade (Largest city: Antigo)
- Lincoln (Largest city: Merrill)
- Manitowoc (Largest city: Manitowoc)
- Marathon (Largest city: Wausau)
- Marinette (Largest city: Marinette)
- Marquette (Largest city: Montello)
- Monroe (Largest city: Sparta)
- Oconto (Largest city: Oconto)
- Oneida (Largest city: Rhinelander)
- Outagamie (Largest city: Appleton)
- Polk (Largest city: Amery)
- Price (Largest city: Park Falls)
- Racine (Largest city: Racine)
- Richland (Largest city: Richland Center)
- Rusk (Largest city: Ladysmith)
- Sawyer (Largest city: Hayward)
- Shawano (Largest city: Shawano)
- Sheboygan (Largest city: Sheboygan)
- St. Croix (Largest city: Hudson)
- Taylor (Largest city: Medford)
- Washburn (Largest city: Spooner)
- Waushara (Largest city: Berlin)
- Winnebago (Largest city: Oshkosh)
- Wood (Largest city: Marshfield)
Electors[edit]
The electors of each state and the District of Columbia met on December 18, 2000[3] to cast their votes for president and vice president. The Electoral College itself never meets as one body. Instead the electors from each state and the District of Columbia met in their respective capitols.
The following were the members of the Electoral College from the state. All were pledged to and voted for Al Gore and Joe Lieberman:[4]
- Alice Clausing
- Pedro Colon
- Paulette Copeland
- Reynolds Honold
- Joan Kaeding
- Mark McQuate
- Ruth Miner-Kessel
- Christine Sinicki
- Tim Sullivan
- Angela Sutkiewicz
- Charlie Wolden
See also[edit]
References[edit]
- ^ "Dave Leip's Atlas of U.S. Presidential Elections".
- ^ "Wisconsin Elections Results | Wisconsin Elections Commission".
- ^ 2000 Presidential General Election Results - Pennsylvania
- ^ "President Elect - 2000". Archived from the original on March 3, 2009. Retrieved May 10, 2011.


