
File talk:EPICA temperature plot.svg
There really ought to be a graph displaying the Fourier transform of this graph and others like it.
Is "ago" from today or 1950?[edit]
My understanding is thatmany paleoclimate records define "the present/today" as 1950. E.g. https://www.ncei.noaa.gov/access/paleo-search/cvterms?termId=133
- calendar year before present
an age unit of years, calibrated to actual years if derived from radiocarbon dating, before present with present defined as 1950 Common Era. Times after 1950 CE are expressed as negative values.
Is that why this graph doesn't show recent warming beyond likely temperature in the Eemian? If so, it should be clarified. -- Skierpage (talk) 00:29, 14 January 2023 (UTC)
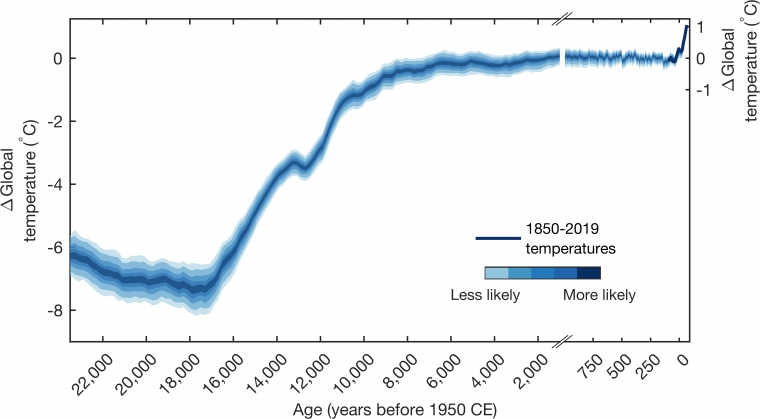
- The EPICA page mentions 1950 half-way down, so I'm pretty sure 0 means 1950. Either the x-axis label should be changed to "Thousands of years before 1950 CE", or "0" on the graph needs a marker "1950 CE", or something. E.g. Tierney and Osman's graph is labeled "Age (years before 1950 CE)". -- Skierpage (talk) 20:23, 3 March 2023 (UTC)