
File:Yearly trends in annual regional carbon dioxide emissions from fuel combustion between 1971 and 2009.png

Size of this preview: 798 × 599 pixels. Other resolutions: 320 × 240 pixels | 639 × 480 pixels | 1,023 × 768 pixels | 1,041 × 782 pixels.
Original file (1,041 × 782 pixels, file size: 41 KB, MIME type: image/png)
| This is a file from the Wikimedia Commons. Information from its description page there is shown below. Commons is a freely licensed media file repository. You can help. |
Summary
| Description |
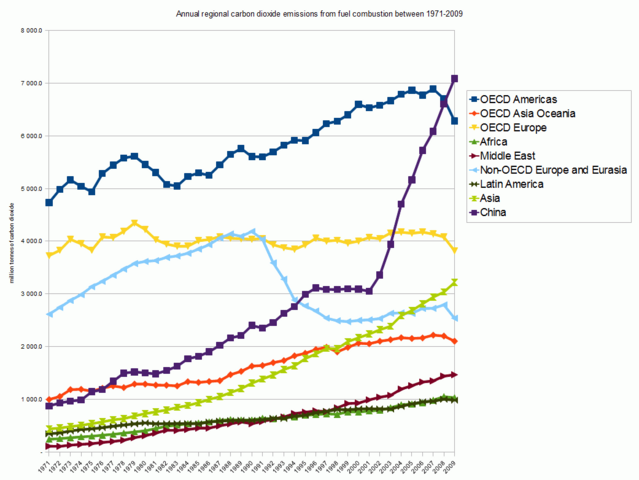
English: This graph shows yearly trends in annual regional carbon dioxide emissions from fuel combustion between 1971 and 2009. Excluding China, countries are grouped into the following regions: OECD Americas, OECD Asia Oceania, OECD Europe, Africa, Middle East, non-OECD Europe and Eurasia, Latin America, Asia, and China. This graph is based on data taken from the International Energy Agency (IEA) publication “CO2 Emissions From Fuel Combustion: Highlights (2011 edition);” publisher: IEA, Paris, France. The PDF version is freely available for download (size 1,717 KB) from the IEA. The bar graph was produced using data from an Excel spreadsheet, which is also freely available for download (1,008 KB). |
| Date | |
| Source | Own work |
| Author | Enescot |
Licensing
I, the copyright holder of this work, hereby publish it under the following licenses:
This file is licensed under the Creative Commons Attribution-Share Alike 3.0 Unported license.
- You are free:
- to share – to copy, distribute and transmit the work
- to remix – to adapt the work
- Under the following conditions:
- attribution – You must give appropriate credit, provide a link to the license, and indicate if changes were made. You may do so in any reasonable manner, but not in any way that suggests the licensor endorses you or your use.
- share alike – If you remix, transform, or build upon the material, you must distribute your contributions under the same or compatible license as the original.

|
Permission is granted to copy, distribute and/or modify this document under the terms of the GNU Free Documentation License, Version 1.2 or any later version published by the Free Software Foundation; with no Invariant Sections, no Front-Cover Texts, and no Back-Cover Texts. A copy of the license is included in the section entitled GNU Free Documentation License. |
You may select the license of your choice.
File history
Click on a date/time to view the file as it appeared at that time.
| Date/Time | Thumbnail | Dimensions | User | Comment | |
|---|---|---|---|---|---|
| current | 15:59, 19 January 2012 | | 1,041 × 782 (41 KB) | Enescot | {{Information |Description ={{en|1=This graph shows yearly trends in annual regional carbon dioxide emissions from fuel combustion between 1971 and 2009. Excluding China, countries are grouped into the following regions: OECD Americas, OECD Asia Oceani |
File usage
The following pages on the English Wikipedia use this file (pages on other projects are not listed):