
File:XYZ-DIS magnetic field coordinates.svg

Size of this PNG preview of this SVG file: 512 × 175 pixels. Other resolutions: 320 × 109 pixels | 640 × 219 pixels | 1,024 × 350 pixels | 1,280 × 438 pixels | 2,560 × 875 pixels.
Original file (SVG file, nominally 512 × 175 pixels, file size: 8 KB)
| This is a file from the Wikimedia Commons. Information from its description page there is shown below. Commons is a freely licensed media file repository. You can help. |
Summary
| Description |
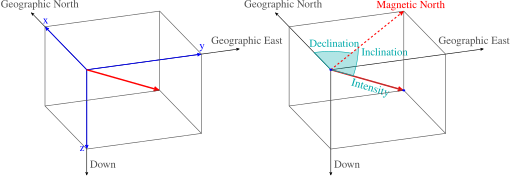
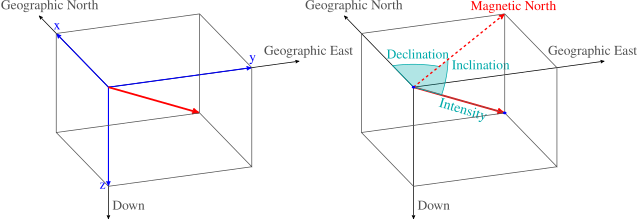
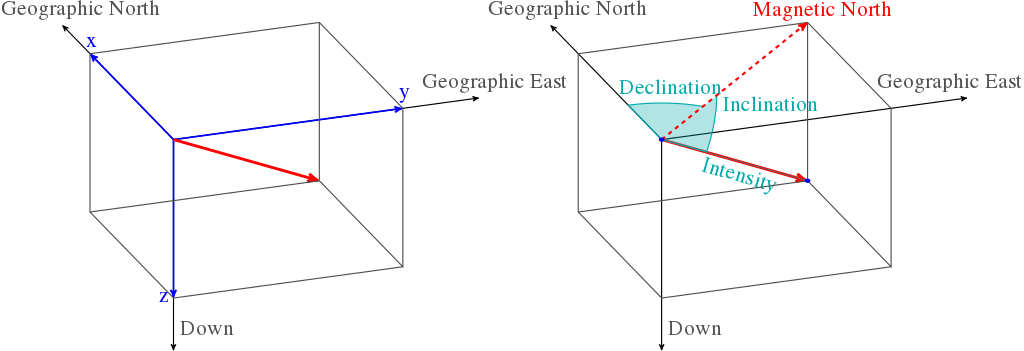
English: The graphic serves to represent the analogy of the XYZ and the more commonly used DIS coordinate systems. Blue indicated the coordinates in the two different systems, while red indicates the resultant magnetic field. |
| Date | |
| Source |
Own work |
| Author |
Chymæra Recreated in LaTeX by: Rubber Duck (☮ • ✍) |
| SVG development | This vector image was created with LaTeX by Rubber Duck (☮ • ✍) and converted to SVG using dvisvgm and manually edited. |
| Source code | SVG code\documentclass[12pt,border=0pt,tikz,class=scrartcl,multi=false]{standalone}
\usepackage{times}
\usepackage{pgfplots}
\pgfplotsset{compat=1.10}
\usetikzlibrary{arrows,decorations.text}
\usepackage{tikz-3dplot}
\pagestyle{empty}
\begin{document}
\def\LA{2}
\def\Lb{1.5}
\def\gap{1.5cm}
\tdplotsetmaincoords {-60}{70}
\begin{tikzpicture}[thick,auto,>=stealth',xscale=4,yscale=3,tdplot_main_coords]
\begin{scope} [xshift=-\gap]
\draw [->] (0,0,0) -- (-\LA,0,0) node [anchor=south,gray] {Geographic North};
\draw [->] (0,0,0) -- (0,\LA,0) node [anchor=south,gray] {Geographic East};
\draw [->] (0,0,0) -- (0,0,\LA) node [pos=.9,right,gray] {Down};
\draw [->,blue,very thick] (0,0,0) -- (-\Lb,0,0) node [anchor=south] {x};
\draw [->,blue,very thick] (0,0,0) -- (0,\Lb,0) node [anchor=south] {y};
\draw [->,blue,very thick] (0,0,0) -- (0,0,\Lb) node [left] {z};
\draw [->,red,line width=2pt] (0,0,0) -- (-\Lb,\Lb,\Lb);
\draw [gray] (-\Lb,0,0) -- ++(0,\Lb,0) -- ++(\Lb,0,0)
-- ++(0,0,\Lb) -- ++(-\Lb,0,0) -- ++(0,0,-\Lb)
(-\Lb,0,0) -- ++(0,0,\Lb) -- ++(\Lb,0,0) -- ++(0,\Lb,0)
(-\Lb,0,\Lb) -- ++(0,\Lb,0)
;
\end{scope}
\begin{scope} [xshift=\gap]
\draw [->] (0,0,0) -- (-\LA,0,0) node [anchor=south,gray] {Geographic North};
\draw [->] (0,0,0) -- (0,\LA,0) node [anchor=south,gray] {Geographic East};
\draw [->] (0,0,0) -- (0,0,\LA) node [pos=.9,right,gray] {Down};
\draw [->,red,line width=2pt] (0,0,0) -- (-\Lb,\Lb,\Lb);
\draw [thin,cyan,postaction={decoration={text along path,
raise=-10pt,text color=cyan,text align={center},
text={Intensity} },decorate}]
(0,0,0) -- (-\Lb,\Lb,\Lb);
\tdplotsetthetaplanecoords{135};
%\tdplotdrawarc [tdplot_rotated_coords,cyan] {(0,0,0)} {.8} {55}{90}{above right=5pt and 0pt}{Inclination};
\draw [tdplot_rotated_coords,fill=cyan,fill opacity=.3,cyan] (0,.8,0)
arc (90:55:.8) node [pos=.1,right,opacity=1] {Inclination}
-- (0,0,0);
%\tdplotdrawarc [cyan,fill=cyan] {(0,0,0)} {.6} {180}{135}{above}{Declination};
\draw [cyan,fill=cyan,fill opacity=.3] (0,0,0) -- (-.6,0,0)
arc (180:135:.6) node [above,pos=.5,opacity=1] {Declination};
\draw [gray] (-\Lb,0,0) -- ++(0,\Lb,0) -- ++(\Lb,0,0)
-- ++(0,0,\Lb) -- ++(-\Lb,0,0) -- ++(0,0,-\Lb)
(-\Lb,0,0) -- ++(0,0,\Lb) -- ++(\Lb,0,0) -- ++(0,\Lb,0)
(-\Lb,0,\Lb) -- ++(0,\Lb,0)
;
\draw [->,red,dashed, line width=1.5pt] (0,0,0) -- (-\Lb,\Lb,0) node [anchor=south] {Magnetic North};
\draw [fill=blue,draw=none] (0,0,0) circle (.5pt) (-\Lb,\Lb,\Lb) circle (.5pt);
\end{scope}
\end{tikzpicture}
\end{document}
|

|
This SVG file contains embedded text that can be translated into your language, using any capable SVG editor, text editor or the SVG Translate tool. For more information see: About translating SVG files. |
Licensing
I, the copyright holder of this work, hereby publish it under the following license:
This file is licensed under the Creative Commons Attribution-Share Alike 3.0 Unported license.
- You are free:
- to share – to copy, distribute and transmit the work
- to remix – to adapt the work
- Under the following conditions:
- attribution – You must give appropriate credit, provide a link to the license, and indicate if changes were made. You may do so in any reasonable manner, but not in any way that suggests the licensor endorses you or your use.
- share alike – If you remix, transform, or build upon the material, you must distribute your contributions under the same or compatible license as the original.
File history
Click on a date/time to view the file as it appeared at that time.
| Date/Time | Thumbnail | Dimensions | User | Comment | |
|---|---|---|---|---|---|
| current | 19:26, 22 April 2015 | 512 × 175 (8 KB) | Krishnavedala | increased font size and more optimized | |
| 19:17, 22 April 2015 | 892 × 306 (8 KB) | Krishnavedala | Better drawing with bigger and legible translatable fonts. | ||
| 02:17, 8 June 2012 |  | 644 × 266 (27 KB) | Chymæra | font issues | |
| 01:58, 8 June 2012 |  | 644 × 266 (29 KB) | Chymæra | {{subst:Upload marker added by en.wp UW}} {{Information |Description = {{en|The graphic serves to represent the analogy of the XYZ and the more commonly used DIS coordinate systems. Blue indicated the coordinates in the two different systems, while red... |
File usage
The following pages on the English Wikipedia use this file (pages on other projects are not listed):
Global file usage
The following other wikis use this file:
- Usage on ast.wikipedia.org
- Usage on bn.wikipedia.org
- Usage on ca.wikipedia.org
- Usage on es.wikipedia.org
- Usage on hi.wikipedia.org
- Usage on it.wikibooks.org
- Usage on it.wikiversity.org
- Usage on or.wikipedia.org
- Usage on pt.wikipedia.org
- Usage on tr.wikipedia.org
- Usage on vi.wikipedia.org