
File:Vapor Pressure Chart.png
No higher resolution available.
Vapor_Pressure_Chart.png (301 × 397 pixels, file size: 9 KB, MIME type: image/png)
| This is a file from the Wikimedia Commons. Information from its description page there is shown below. Commons is a freely licensed media file repository. You can help. |
Summary
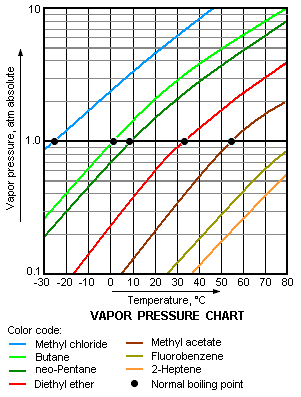
| Description | This image is a chart of vapor pressure versus temperature, for various liquids. The chart's y-axis is logarithmic and the x-axis is linear. It includes data for propane|, methyl chloride, butane, neo-pentane, diethyl ether, methyl acetate, fluorobenzene, and 2-heptene. | |||
| Date | ||||
| Source | Own work | |||
| Author | Mbeychok | |||
| Other versions |
|


Licensing
| I, the copyright holder of this work, release this work into the public domain. This applies worldwide. In some countries this may not be legally possible; if so: I grant anyone the right to use this work for any purpose, without any conditions, unless such conditions are required by law. |
File history
Click on a date/time to view the file as it appeared at that time.
| Date/Time | Thumbnail | Dimensions | User | Comment | |
|---|---|---|---|---|---|
| current | 13:00, 15 September 2015 | | 301 × 397 (9 KB) | Обедающий философ | Reverted to version as of 20:45, 6 March 2012 (cos Materialscientist cannot into resize) |
| 00:03, 11 June 2014 |  | 400 × 528 (8 KB) | Materialscientist | scaling issues | |
| 20:45, 6 March 2012 |  | 301 × 397 (9 KB) | Mbeychok | Added normal boiling points to the chart. | |
| 03:21, 12 October 2007 |  | 301 × 397 (9 KB) | Mbeychok | I am the original author and uploader of the existing Vapor Pressure Chart.png. I had to remove a short line segment that I had failed to erase. | |
| 03:14, 12 October 2007 |  | 301 × 397 (9 KB) | Mbeychok | This is an improved version of the existing Image:Vapor Pressure Chart.png which has been slightly modified and I am the original author and uploader of the existing image. | |
| 19:52, 6 October 2007 |  | 301 × 397 (9 KB) | Mbeychok | Made a minor correction/revision to this image file which I uploaded yesterday.This is the revised version. - ~~~~ | |
| 04:38, 6 October 2007 |  | 301 × 397 (9 KB) | Mbeychok | {{Information |Description= This image is a chart of vapor pressure versus temperature, for various liquids. The chart's y-axis if logarithmic and the x-axis is linear. |Source=self-made |Date=October 5, 2007 |Author= Mbeychok }} |
File usage
The following pages on the English Wikipedia use this file (pages on other projects are not listed):
Global file usage
The following other wikis use this file:
- Usage on ar.wikipedia.org
- Usage on bn.wikipedia.org
- Usage on ca.wikipedia.org
- Usage on et.wikipedia.org
- Usage on fa.wikipedia.org
- Usage on fr.wikipedia.org
- Usage on he.wikipedia.org
- Usage on hr.wikipedia.org
- Usage on hu.wikipedia.org
- Usage on id.wikipedia.org
- Usage on ja.wikipedia.org
- Usage on mk.wikipedia.org
- Usage on ml.wikipedia.org
- Usage on nl.wikipedia.org
- Usage on no.wikipedia.org
- Usage on pl.wikipedia.org
- Usage on sh.wikipedia.org
- Usage on sl.wikipedia.org
- Usage on sr.wikipedia.org
- Usage on sv.wikipedia.org
- Usage on ur.wikipedia.org