
File:Projected changes in crop yields at different latitudes with global warming.png
Original file (1,322 × 694 pixels, file size: 16 KB, MIME type: image/png)
| This is a file from the Wikimedia Commons. Information from its description page there is shown below. Commons is a freely licensed media file repository. You can help. |
Summary
| Description |
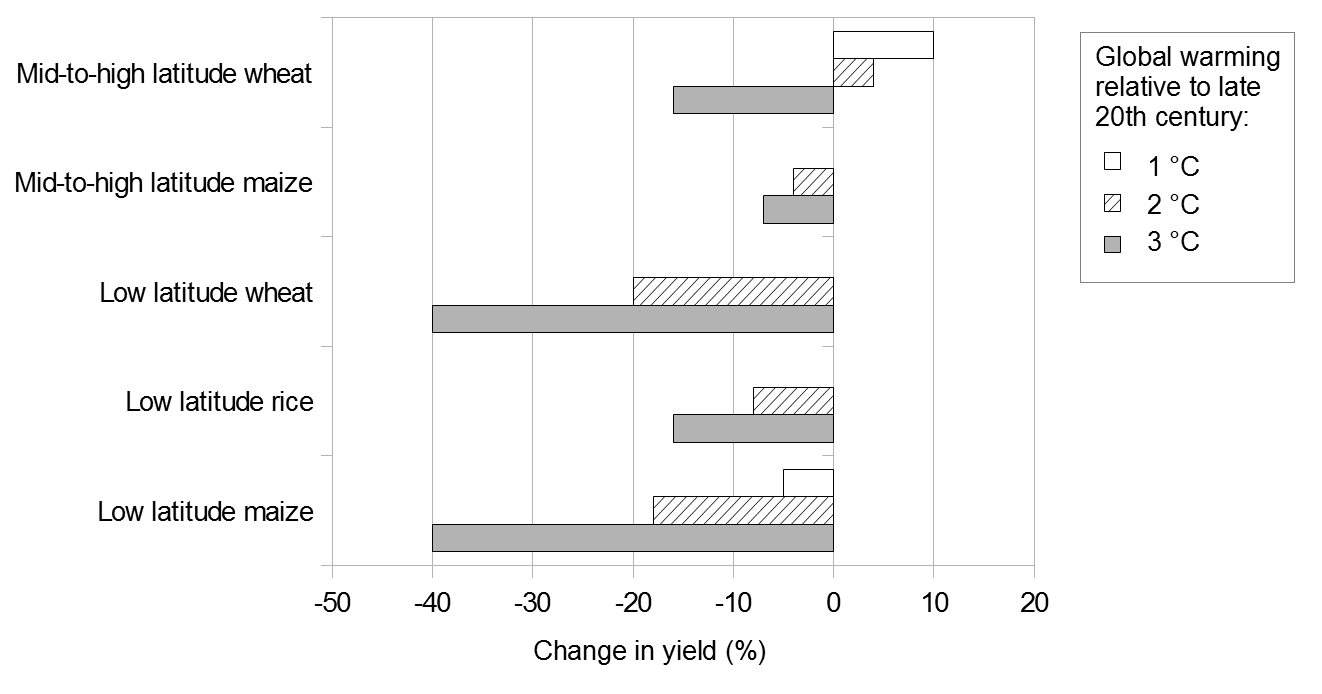
English: This bar graph shows projected changes in crop yields at different latitudes with global warming. Projected changes are shown for 1-3 °C of global warming, relative to late 20th century. For mid-to-high latitudes, changes in yield are shown for wheat and maize. For low-latitudes, changes are shown for wheat, rice and maize. In mid-to-high latitudes:
In low latitudes:
Data Values are approximate and are taken from the US National Research Council (US NRC, 2011).[1] The first, second and third numbers are the projected changes in yields (%) for 1, 2 and 3 °C of global warming, respectively.:
US NRC (2011)[1] drew on several studies. The graph does not show the "likely" ranges included in US NRC (2011).[1] The likely range means that there is a 67% chance of the projected change in yield being correct, based on expert judgement.[1] For 1 °C of global warming, the likely range is roughly equal to plus or minus (+/-) 10% for all projected changes in yields. Uncertainty increases with temperature. For 3 °C of warming, the likely range is roughly:
These projections broadly show the probable changes in regional yields.[2] The projections do not include measures to adapt to global warming.[2] Actual changes in yields may vary according to local conditions.[2] There are numerous other uncertainties, including how local climate will change with global warming, and the atmospheric concentration of carbon dioxide (CO2) associated with different magnitudes of global warming.[2] There is also the possibility that yields will change if critical thresholds are crossed.[2] Many of the uncertainties could bias the projections towards underestimating reductions in crop yields.[2] However, adaptation practices could help to reduce losses in yields.[2] Adaptation will be more difficult for higher magnitudes of warming, and may be less effective in tropical regions.[2] Notes
References
|
| Date | |
| Source | Own work |
| Author | Enescot |

|
This graph image could be re-created using vector graphics as an SVG file. This has several advantages; see Commons:Media for cleanup for more information. If an SVG form of this image is available, please upload it and afterwards replace this template with
{{vector version available|new image name}}.
It is recommended to name the SVG file “Projected changes in crop yields at different latitudes with global warming.svg”—then the template Vector version available (or Vva) does not need the new image name parameter. |
Comma-separated values
Data were exported from OpenOffice.org 3.4.1 Calc as comma-separated values (csv). The following options were used:
- Character set: Western Europe 1252
- Field delimiter: ,
- Text delimiter: "
- Quote all text cells: no
- Save cell content as shown: yes
- Fixed column width: no
,,,,,,
,,,,,,
,,,Global warming relative to late 20th century,,,
,,Region and crop,1,2,3,
,,Mid-to-high latitude wheat,10,4,-16,Changes in yield (%)
,,Mid-to-high latitude maize,0,-4,-7,
,,Low latitude wheat,0,-20,-40,
,,Low latitude rice,0,-8,-16,
,,Low latitude maize,-5,-18,-40,
Licensing
| This file is made available under the Creative Commons CC0 1.0 Universal Public Domain Dedication. | |
| The person who associated a work with this deed has dedicated the work to the public domain by waiving all of their rights to the work worldwide under copyright law, including all related and neighboring rights, to the extent allowed by law. You can copy, modify, distribute and perform the work, even for commercial purposes, all without asking permission.
|
File history
Click on a date/time to view the file as it appeared at that time.
| Date/Time | Thumbnail | Dimensions | User | Comment | |
|---|---|---|---|---|---|
| current | 13:25, 21 July 2013 | | 1,322 × 694 (16 KB) | Enescot | {{Information |Description ={{en|1=This bar graph shows projected changes in crop yields at different latitudes with global warming. Projected changes are shown for 1-3&n... |
File usage
Global file usage
The following other wikis use this file:
- Usage on ar.wikipedia.org
- Usage on bn.wikipedia.org
- Usage on mk.wikipedia.org
- Usage on nl.wikipedia.org
- Usage on zh.wikipedia.org